Geotechnical focus:
Core drilling and sampling standards are about controlling damage, not just drilling depth: correct core barrel and bit selection (HQ/NQ/T2), low-disturbance drilling parameters, full core recovery, proper orientation, and disciplined handling and boxing. Poor practice shows up immediately as low recovery, broken core, and unreliable RQD.
Mineral exploration focus:
In mineral exploration, core drilling standards aim to preserve geology and structure: appropriate barrel size, stable drilling parameters, accurate core orientation, and strict core handling and logging. Recovery quality directly affects structural interpretation, grade control, and confidence in resource models.
Fundamental Pit Geometry
▪ Pit:
The large, terraced excavation created to extract ore from near-surface deposits.
▪ Bench:
A horizontal step cut into the pit, formed during mining to provide stability and access.
▪ Berm:
A safety strip or horizontal shelf left between benches to catch falling rocks and support stability.
▪ Batter:
The sloping surface of a bench wall.
▪ Batter Angle:
The angle of inclination of the bench wall, measured from the horizontal.
▪ Face:
The active rock surface where drilling, blasting, and loading occur.
▪ Crest:
The top edge of a bench or slope.
▪ Toe:
The bottom point where the bench slope meets the horizontal floor.
▪ Inter-Ramp Angle (IRA):
The angle formed by a stack of benches without considering the berms at every level.
▪ Overall Angle:
The final stable slope angle from pit crest to pit bottom, accounting for all benches and berms.
Mining Operations & Equipment
▪ Pit Stages:
Sequential mining phases that advance the pit outward and downward in planned steps.
▪ Loading:
The process of picking up blasted rock using machinery such as shovels, excavators, or loaders.
▪ Hauling:
Transporting ore or waste rock from the pit to dumps, crushers, or stockpiles using haul trucks.
▪ Haul Road:
Engineered roads designed within the pit for the safe movement of heavy machinery.
▪ Shovel / Excavator:
Primary loading equipment used to dig and load blasted rock.
▪ Front-End Loader:
A versatile machine used for loading, stockpiling, and short-distance material movement.
▪ Dump:
A designated area where waste rock is deposited.
▪ ROM (Run of Mine):
Material delivered directly from the mine to the processing plant without any pre-crushing.
▪ Drilling:
The creation of blast holes for explosives.
▪ Blasting:
Fragmentation of rock using explosives to allow efficient excavation.
Last week I wrote about how mining companies are sitting on transformational value trapped in their data systems, and the comments that followed were fascinating.
Most people agreed with the opportunity. But a recurring theme emerged: "That's all well and good, but what about the quality of the data in the first place?"
Fair point. Because if you're going to build an AI-powered intelligence layer on top of decades of mining data, you'd better hope that data isn't complete rubbish.
Recent industry surveys paint a confronting picture. The vast majority of mining professionals say data management is critically important to their organisation. Yet less than a third have an established framework for managing it. Most keep data "organised in various systems", which is corporate speak for scattered across a dozen folders, three legacy databases, and someone's USB stick.
The historical data problem is particularly challenging. More than half the industry identifies unmanaged historical data as a significant challenge, yet only half feel confident their company can actually handle it properly. When you've got an average of 22 people touching datasets within an organisation and most companies can't reliably tell you who changed what, when, or why, you've got a recipe for expensive mistakes.
In mining, decisions based on flawed geological data can lead to drilling in the wrong locations, overestimating reserves, or underestimating processing costs. Boards should be asking hard questions about this.
So is fixing it actually possible?
Yes. But it requires something the industry has historically resisted: discipline.
The solution is in establishing clear data governance from the point of collection. Every piece of data needs provenance: who collected it, when, using what methodology, and what QA/QC processes were applied. The technology to automate most of this now exists. The barrier is cultural, not technical.
Consider the alternative. You spend millions on an AI platform, hire a data science team, and build predictive maintenance models, only to discover your insights are based on assay results that were transcribed incorrectly in 2009.
The billions sitting in server rooms that I mentioned last week? They're only accessible if the data is trustworthy.
That’s why we aim to built our approach around data integrity from the start. AI technology must validate, cross-references, and flag anomalies before decisions are made. Because the most sophisticated algorithm in the world is worthless if it's trained on low quality data.
Cleaning historical data and establishing proper frameworks isn't glamorous. It won't make headlines at mining conferences. But it's the foundation upon which every other digital transformation initiative depends.
Comparto con ustedes este banco de preguntas que elaboré en compañía de mis colegas Diego Burgos Huanambal y Danny Cao.
Esperamos que este material pueda ser de utilidad para su preparación académica y profesional en temas de minería.
Sigamos aportando conocimiento y fortaleciendo nuestra comunidad minera.
Source: Credit to José Pedro Cortez Ordoñez, Diego Burgos Huanambal, Danny Cao
Mine Manager’s Playbook Series
Haul roads look simple.
They are not.
They are the biggest hidden cost centre in open-pit mining.
A shovel can be world-class.
A fleet can be brand new.
Explosives can be perfect.
But if the haul road is bad, the mine becomes slow, expensive, and unproductive — every single hour.
The Financial Truth No One Talks About
Every 1% increase in rolling resistance causes 10% loss in truck productivity.
Just one soft patch, one wet curve, one ungraded segment… and your entire fleet behaves underpowered.
You won’t see this in fuel sheets.
You won’t see it in daily MIS.
You’ll only see it in the total cycle time, the silent killer of mine economics.
Where Haul Roads Drain Money
1️⃣ Fuel Burn
Bad roads increase diesel consumption by 15–35%.
Multiply that by 20–30 trucks and the numbers become brutal.
2️⃣ Payload Loss
Operators start playing safe. “Almost full loads” replace full loads.
You lose BCM quietly.
3️⃣ Tyre Life Crash
Rough roads kill tyres 40–60% faster.
Each tyre costs USD 3,000–5,000.
A road can wipe out your tyre budget faster than any operator mistake.
4️⃣ Shovel Starvation
Slow trucks → empty shovels → lost tonnes → lost month-end targets.
5️⃣ Maintenance Backlog
More braking = more heat = more failures.
Your workshop gets punished for road issues.
The Core Science
A Mine Manager must master one chain:
Geometry → Rolling Resistance → Speed → Cycle Time → Cost/BCM → Profitability
Fix this chain and your mine performance transforms.
Four Engineering Truths
• Geometry:
Gradient, curvature, super-elevation. A truck runs on engineering, not hope.
• Surface Quality:
Corrugation, ruts, potholes — these are cost signals, not “road conditions.”
• Width & Berms:
If operators feel unsafe, they reduce speed. Safety and speed go together.
• Drainage:
Water destroys most haul roads. Poor drainage destroys the rest.
The Behaviour Side (Most Ignored)
Good road design loses 50% of value if behaviour is poor:
– lane discipline
– over-speeding on straights
– shortcuts on curves
– inconsistent water bowser cycles
– reactive grading instead of scheduled grading
Road science is half engineering, half discipline.
The Most Important KPI in Open-Pit Mining
Not fuel burn.
Not tyre cost.
Not tonnes per hour.
It’s “Average Speed on Loaded Haul.”
Increase it by even 1 km/h, and your mine’s monthly profit moves instantly.
Mine Manager’s Non-Negotiables
✔ Grade every shift
✔ Maintain drainage religiously
✔ Enforce lane discipline
✔ Prevent truck queues at shovel
✔ Measure rolling resistance weekly
✔ Audit roads using drones
✔ Make road quality a production KPI
Because the truth is simple:
Mines rarely lose money in digging.
They lose it on the road.
It all began in the South African gold mines in the 1950s. An engineer named Danie Krige was frustrated by the inaccuracy of reserve estimates. The manual methods of the time were subjective, inconsistent and led to costly mis‑judgements.
The problem was simple yet crucial: how could one estimate the grade of millions of tonnes of ore based on only a few hundred drill holes?
🔹 The solution came from France:
Georges Matheron, a French mathematician, was struck by Krige’s empirical work. In 1962 he formalized the mathematical theory behind Krige’s observations, creating what we now know as kriging.
The kriging revolution:
Unbiased estimates with minimal variance
Quantification of uncertainty through the kriging variance
A rigorous statistical method replacing specialists’ “gut feeling”
A mathematical foundation based on variograms and spatial correlation
Transformational impact:
Kriging was not merely an incremental improvement-it was a paradigm shift. For the first time in the history of mining, there was a method that not only estimated grades but also quantified the confidence placed in those estimates.
🔹 Concurrently, another revolution:
In 1965, Helmut Lerchs and Ingo Grossmann solved another fundamental problem: what is the optimal pit? Their algorithm, based on graph theory, provided for the first time a mathematically optimal solution for delineating open pits.
Before: manual pit design based on experience.
After: mathematical optimization ensuring maximum economic value.
The perfect marriage:
Kriging provided reliable grade estimates.
The Lerchs–Grossmann algorithm optimized economic recovery.
Result: scientific planning in place of intuition.
A historical note: the Lerchs–Grossmann algorithm only became widespread twenty years later, once computers were powerful enough. The Whittle 3D software of the 1980s was the milestone that democratized pit optimization.
Why does this matter today?
These two pillars-reliable estimation and mathematical optimization-laid the foundation of modern mining. Without them, we would not have the basis to integrate machine learning, stochastic simulation and advanced optimization, as we see today.
The journey continues:
1960s: Kriging + Lerchs–Grossmann
1980s: Stochastic simulation
2000s: Optimization under uncertainty
2020s: Machine learning + geostatistics
From South Africa to the world, from intuition to science, from deterministic to probabilistic methods.
1️⃣ Diamond Core Drilling (HQ/NQ/BQ)
Produces intact core — the gold standard.
If you want RQD, fractures, UCS, structure, or lab tests, this is your method.
→ Best for: Tunnels, dams, slopes, deep exploration.
2️⃣ Reverse Circulation (RC) Drilling
Fast, efficient, and cost-effective. Delivers rock chips, not core.
Brilliant for quick decisions in hard rock.
→ Best for: Reconnaissance, orebody delineation, grade control.
3️⃣ Down-The-Hole (DTH) Hammer
A pneumatic hammer breaks very hard rock with ease.
High penetration, low cost, no core.
→ Best for: Hard volcanics, blasting holes, geotechnical boreholes.
4️⃣ Top Hammer / Percussive Drilling (Jackleg, Stopper, Jumbo)
High-frequency drilling where mobility matters most.
If you’ve been underground, you’ve heard it before you saw it.
→ Best for: Underground headings, stopes, tunnel blasting.
5️⃣ Rotary Air Drilling (Tri-cone Bit)
Fast and cheap. Produces cuttings only.
Love it for dry, competent rock.
→ Best for: Recon drilling, pre-collar holes, shallow investigations.
6️⃣ Rotary Mud Drilling (in Fractured Rock)
When the rock mass is weak, crushed, or sheared — mud keeps the hole open.
Not ideal for core, but perfect for stability.
→ Best for: Shear zones, faulted rock, geotechnical instrument holes.
7️⃣ Horizontal / Directional Core Drilling
When you need rock data in a specific direction — especially in tunnels or dams.
Game-changer for proactive hazard detection.
→ Best for: Tunnel face probing, slope anchors, deep foundations.
8️⃣ Sonic Drilling (Moderately Hard Rock)
Vibration-assisted advance that preserves core in weathered rock where diamond drilling struggles.
→ Best for: Rock-soil transitions, altered rock.
El verdadero seniority no se demuestra solo hablando: se demuestra antes, durante y después de la reunión.
La mayoría de líderes creen que su presencia ejecutiva se construye solo “cuando hablan”.
Pero la verdad es que el 70% de lo que proyectas ya estaba decidido antes de pronunciar la primera palabra.
Lo veo todos los días.
▫️Gente que llega a reuniones críticas sin una intención clara.
▫️Profesionales senior que aún hablan desde la defensa y no desde la claridad.
▫️Líderes con experiencia que hacen preguntas “tácticas” cuando deberían formular preguntas que revelen visión.
Y no es falta de conocimiento.
Es falta de presencia estratégica.
Porque una reunión de alto nivel no se improvisa.
Se prepara como un atleta prepara una final: con intención, foco y energía emocional alineada.
Cuando entras así, todo cambia:
✔️ Tu mensaje deja de ser disperso y se vuelve memorable.
✔️ Tus pausas proyectan seguridad, no dudas.
✔️ Tu lenguaje corporal respalda tu voz (no compite con ella).
✔️ Y al cerrar, no suenas “amable”: suenas senior.
Y ahí está el secreto de los líderes que avanzan más rápido:
No hablan más fuerte.
Hablan mejor.
Con propósito.
Con límites.
Con presencia.
Piensa en tu última reunión importante:
¿Entraste con intención o reaccionaste a la situación?
¿Qué vas a cambiar en la próxima reunión?
Key Performance Indicators (KPIs) for Optimisation of Drilling & Blasting operation in Opencast Mines
1. Technical KPIs
Monitor powder factor optimization
Track fragmentation size distribution
Measure blast-induced damage levels
Assess drilling accuracy and precision
Evaluate explosive utilization efficiency
Monitor equipment productivity rates
2. Safety and Environmental KPIs
Track safety incident rates
Monitor vibration and noise compliance
Assess air quality impact levels
Measure flyrock occurrence frequency
Document environmental compliance status
Record community feedback and concerns
Key performance indicators (KPIs) for optimization of drilling and blasting include *
*Rate of Penetration (ROP) **
, Powder Factor,
Rock Fragmentation
, Equipment Utilization
Cycle Time of Shovel
Throughput of Crushers
, Drilling and Blasting Costs,
Ground Vibration,
Bit Life, and
Safety Incidents.
These KPIs provide quantifiable measures to evaluate drilling effectiveness, blast performance, operational efficiency, and safety, facilitating continuous improvement and alignment with overall mine goals.
Drilling Performance KPIs
Rate of Penetration (ROP): Measures the speed at which the drilling unit can penetrate the rock.
Penetration Rate (Depth per Hour): Assesses the productivity of the drilling unit over time.
Bit Life: Tracks the durability and performance of drill bits.
Equipment Utilization: Measures the effective working hours of drilling units against their total working hours.
Drilling Costs per Foot: Evaluates the cost-effectiveness of drilling operations.
Blasting Performance KPIs
Powder Factor: The amount of explosive used per volume of rock blasted, used to optimize blast design.
Rock Fragmentation: The size distribution of the blasted rock, a critical factor for downstream processes like crushing and milling.
Flyrock: Measures the distance and potential danger of rocks thrown from the blast site.
Back Break: Indicates the extent of rock damage beyond the intended blast perimeter.
Air-Overpressure (AOp): Measures the force of the air blast, which can impact surrounding areas.
Safety & Environmental KPIs
Ground Vibration: Tracks the level of ground shaking caused by the blast, which is critical for maintaining structural integrity and minimizing environmental impact.
Safety Incidents: The number of safety-related incidents during drilling and blasting operations.
Overall Operational KPIs
Cycle Time Optimization: Focuses on reducing the overall time taken for drilling and blasting cycles.
Volume Blasted: Measures the total volume of rock successfully blasted within a given period.
Energy and Environmental Metrics: Includes energy consumption and other environmental impacts to ensure sustainable operations.
Hydraulic Accumulators – The Hidden Power Behind System Reliability
In every hydraulic system, there’s an unsung hero that ensures smooth performance, energy efficiency, and safety — the hydraulic accumulator.
Whether it’s storing energy, absorbing shocks, or providing emergency power, accumulators play a crucial role in keeping systems stable and responsive.
There are three main types:
⚙️ Weight-loaded – delivers constant pressure but is bulky.
⚙️ Spring-loaded – simple but limited by spring elasticity.
⚙️ Gas-charged (Piston, Bladder, Diaphragm) – the most widely used for their compactness, quick response, and efficiency.
💡 Applications go far beyond energy storage:
• Safety systems in aircraft and railways ✈️🚆
• Energy saving in injection molding machines
• Suspension and vibration damping in heavy vehicles 🚜
• Pressure stabilization in pumps and hydraulic circuits
By using accumulators smartly, engineers can reduce pump load, save energy, and extend equipment life — all while maintaining system stability.
🔹 Small component, massive impact on system performance.
When we analyzed shift efficiency patterns for internal research, we discovered that many mining sites lose millions in productive time.
This finding points to a structural problem: mining operations generate extensive operational data but lack systems to translate that data into actionable time utilization insights. Most managers track equipment hours and tonnage without understanding the relationship between these metrics and actual productive capacity.
Our field studies revealed consistent measurement gaps across operations. A mine we researched reported 56-64% effective working time, with variance tied to blast and shift configurations. The real insight wasn't the efficiency range but rather the absence of systematic approaches to understand variance drivers. Time Utilisation Model (TUM) codes capture some activities while equipment resets and haulage queuing remain untracked. This selective visibility creates optimization bias: teams improve measured activities while unmeasured bottlenecks expand.
The incentive structure analysis uncovered predictable but overlooked dynamics. Tonnage-based rewards drive short-term production at the expense of equipment utilization and maintenance windows.
This creates cascading effects: increased wear rates lead to unplanned downtime, which compresses maintenance schedules, which further reduces equipment reliability. Standard shift designs assume static operating conditions, but actual mining environments require dynamic response capabilities. Supervisors receive performance data after shifts end, preventing real-time adjustments that could prevent minor delays from becoming production losses.
The competitive analysis shows widening performance gaps between integrated and traditional planning approaches. Companies with modern planning systems capture 10-15% productivity gains through dynamic scheduling and bottleneck prediction. Legacy operators face both immediate cost disadvantages and reduced learning rates from limited operational feedback.
In commodity markets where margins compress during downturns, operational efficiency differences determine which companies maintain positive cash flow.
The shift planning problem isn't about time management but about building systems that convert operational data into sustained competitive advantage.
Today, key human resources indicators (KPIs) have become more sophisticated because they no longer only measure administrative efficiency, but also the strategic impact on the business.
Here are 5 big blocks with examples:
1. Attraction and recruitment
• Time to Fill: average days to fill a vacancy.
• Time to Hire: from the time the candidate is contacted until they accept the offer.
• Cost per hire: sum of investment in recruitment divided by the number of hires.
• Quality of hiring: performance and permanence of the talent hired.
2. Performance and productivity
• Productivity per employee: revenue or results generated / number of employees.
• Compliance with performance objectives (individual OKRs/KPIs): % of goals achieved.
• Absenteeism rate: absences vs. scheduled working hours.
• Overtime worked: indicator of overload or poor planning.
3. Retention and Turnover
• Voluntary and involuntary turnover rate: % of employees who leave the company.
• Retention of key talent: permanence of critical profiles for the business.
• Average tenure: average seniority of employees.
• Turnover cost: expense associated with replacing an employee (recruitment + training + loss of productivity).
4. Development and training
• Investment in training per employee: annual amount invested.
• Training hours per capita: average number of training hours per employee.
• Applicability index of the training: % of skills learned applied on the job.
• Internal mobility: percentage of vacancies filled with internal talent.
5. Organizational climate and commitment
• Employee Engagement Index: level of commitment and job satisfaction.
• eNPS (Employee Net Promoter Score): willingness to recommend the company as a place to work.
• Well-being index: perception of work-life balance, physical and mental health.
• Level of diversity and inclusion: % of women, generations, multicultural profiles in key positions.
The most current HR KPIs go beyond payroll and turnover: today they focus on employee experience, productivity, development, and strategic value for the business.
At HRA Talent we can help you prepare an analysis with solution proposals so that your company is profitable and recovers an exceptional service culture!
Open pit mining is one of the most common and cost-effective methods used to extract valuable minerals from the earth. It’s like digging a giant bowl-shaped hole in the ground — layer by layer — to reach the desired ore.
But behind this massive excavation lies the critical role of a Geotechnical Engineer — often working silently in the background to keep everything stable, safe, and efficient.
🧠 So, what exactly does a Geotechnical Engineer do in open pit mining?
Let’s break it down with simple examples:
🪨 1. Slope Design & Stability
Imagine cutting a big slice out of a cake. If the sides are too steep, it collapses. In mining, we design pit walls (slopes) that are stable enough to stand safely while also allowing the maximum amount of ore to be recovered.
📌 We study:
Rock and soil strength
Water pressure in the ground (pore pressure)
Discontinuities (like fractures or faults)
🛠 Tools like limit equilibrium analysis, finite element modeling, and slope monitoring systems help us make decisions.
🌧️ 2. Water Control
Water is a major enemy of open pit stability.
💧 Scenario: During heavy rain, water can seep into the pit walls, weaken the rock, and trigger landslides.
✅ Geotechnical Engineers design drainage systems, dewatering wells, and piezometers to manage groundwater and prevent failures.
🏗️ 3. Rock Mass Classification
Every rock behaves differently under stress. We classify the rock mass using systems like:
RMR (Rock Mass Rating)
Q-System
GSI (Geological Strength Index)
📌 This helps in selecting:
Support systems (bolts, mesh)
Slope angles
Excavation methods
🚧 4. Monitoring & Risk Management
We don’t stop after design — we monitor pit walls continuously.
📡 Using instruments like:
Inclinometers
Extensometers
Prism monitoring with total stations
Drone-based LiDAR and photogrammetry
📈 This allows us to detect movements early and warn the operations team before a slope failure occurs.
🛑 Real-Life Example:
At a gold mine in a mountainous area, unexpected rainfall can cause slope instability. The geotechnical team may install piezometers and modify the pit slope angle. This timely intervention can prevent a major failure and save millions in lost ore and equipment.
💼 Whether it’s copper in Chile, gold in Ghana, or phosphate in Saudi Arabia — open pit mining cannot operate safely without geotechnical expertise.
👉 A small misjudgment in slope angle can result in catastrophic slope failure, risking lives, equipment, and production.
Hoy en día existe un análisis de tendencias, tecnologías e investigaciones enfocadas en transformar la industria minera hacia un modelo más inteligente y sostenible con un énfasis en el pilar de protección ambiental🌍.
⚒️ Minería 4.0 (Smart Mining)
👉 Uso de IoT, IA, Big Data, robótica, nube, gemelos digitales y ciberseguridad.
👉 Impacto en toda la cadena de valor: exploración, extracción y producción.
👉 Retos: comunicación en minas subterráneas y gobernanza de datos.
🌱 Minería 5.0 (Sostenible / Verde)
👉 Tecnología + Personas + Sostenibilidad.
👉 Uso de energías limpias (hidrógeno verde, solar, eólica).
👉 Meta de cero fatalidades con sistemas inteligentes.
👉 Minería con valor social y licencia social para comunidades.
👉 Economía circular, trazabilidad con blockchain y alineación a criterios ESG.
🌟 Casos reales:
✔️Anglo American (Sudáfrica) → camiones con hidrógeno verde.
✔️CODELCO (Chile) → realidad aumentada en entrenamiento.
✔️Mina San Cristóbal (Bolivia) → IoT para salud y seguridad.
✔️BHP (Australia) → Integración de energías renovables.
✔️Anglo American – Quellaveco (Perú) → Mina digital, CIO en Lima, 100% energía renovable, camiones autónomos.
En tu opinión, ¿En el Perú, crees que las empresas mineras en su mayoría —sobre todo mediana y gran minería — ya tienen una tendencia clara hacia la Minería 4.0? Te leo 👍
Personal Protective Equipment Saves Lives : Leadership and Safety in Action - SHE Part VI
🚨Every year, approximately 2.3 million women and men worldwide DIE from work-related accidents or illnesses a figure reported by the International Labour Organization (ILO).
🚨This tragically equates to more than 6,300 deaths every single day around the globe.
🚨The ILO further estimates there are over 374 million non-fatal work-related injuries annually, many of which could be prevented through consistent use of PPEs
🚨Studies also show that only about 64% of workers globally use PPE properly, highlighting a critical gap in safety culture and training, especially in developing regions.
Personal Protective Equipment (PPE) is more than just a set of tools; it’s the frontline defense against workplace hazards. From construction to healthcare, PPE protects employees from physical, chemical, and biological risks, ensuring that everyone leaves work as healthy as they arrived.
Essential Types & Proper Usage
⛑️ Head Protection: Helmets prevent head injuries from falling objects.
🥽 Eye and Face Protection: Safety glasses and face shields block hazardous particles and chemicals.
🎧 Hearing Protection: Earplugs protect against damaging noise.
😷 Respiratory Protection: Masks and respirators filter out harmful substances.
🧤 Hand Protection: Gloves safeguard against cuts, burns, and exposure.
🥾 Foot Protection: Safety boots reduce risks of impact or punctures
👷♂️ Body Protection: Work clothes for body parts and vests protect body parts
🎽 Fall Arrest: Protective vests, belts and hooks protects fall injuries because of working in height
Why PPE Matters
✅ Minimizes exposure to hazards, preventing serious workplace injuries and occupational illnesses
✅ Safeguards workers from long-term health risks, such as chemical exposure or hearing damage
✅ Supports business continuity by reducing absenteeism, medical costs, and downtime from accidents
Always ensure PPE is well-fitted, undamaged, and used as instructed. Regular usage and awareness Trainings, Safety Walks, Checks and Behavioral Observation Programs are key!
Benefits Beyond Safety
👍 Boosts employee confidence and morale, knowing their wellbeing is prioritized
👍 Meets legal and regulatory requirements, avoiding fines and legal complications
👍 Demonstrates a proactive safety culture that values every worker.
By prioritizing PPE, companies build a foundation for operational excellence and show real leadership in workplace safety.
🫵 The plot
Conservative practices contribute to substantial economic inefficiencies in the mining sector. Industry-wide impairment losses exceeded $120 billion during the 2013/14 commodity downturn, with resource and reserve estimation issues identified as contributing factors in 17% of feasibility study failures.
McKinsey estimates $100 billion in potential value optimization across mining feasibility studies, with resource classification standards identified as one element requiring improved rigor.
🫵 The dirty little secret
Ore deposit valuation hinges on robust reserve estimation, yet prevailing mining standards conflate geological confidence with grade uncertainty, leading to conservative biases and undervaluation.
Geostatisticians often downgrade resources by focusing on local grade variability, ignoring geological reliability established in Indicated Resource classifications resulting in reduced reserves, deterring investment despite solid deposit foundations.
The evaluation and valuation of ore deposits too often undermined by the conflation of geological confidence with grade uncertainty.
🫵 The gatekeepers labyrinth
The classification of mineral resources and reserves has long struggled with this in both resource management and deposit valuation.
Current practices, under the CRIRSCO umbrella, geostatisticians override established geological assurances based solely on grade variability, resulting in unnecessary reductions in reported ore reserves.
Decoupling these risks and employing statistical confidence intervals, mining can preserve reserve estimates, capture upside potential, and enhance valuation accuracy.
🫵 Clear precedent
The petroleum industry's Proven-Probable-Possible framework (PRMS), assigns explicit confidence intervals to reserve estimates without abandoning sound geological interpretations.
The framework addresses both mineral resource classification requirements and deposit valuation imperatives, recognizing that classification decisions directly influence market valuations, access to capital, and investment returns.
Such an approach recognizes that resource classification decisions directly impact deposit valuations, making the conversion of Mineral Resources Reserves relevant to the valuation of Mineral deposits. Ignoring this risk conflation attracts opportunity costs and consequential economic harm to investors because undervaluation of projects of well-understood deposits that receive inappropriate classification due to statistical limitations rather than geological uncertainty can be significant.
Downgrading resource categories invokes different valuation multiples in market assessments resulting in poor market valuations that impede access to capital and capital formation. The misallocation of Mineral Resources can trigger the requirement for severe impairments charges that qualified persons seem aloof to.
Key Takeaways
Africa leads with 1,010 tonnes of gold, driven by Ghana, Mali, and South Africa.
China (380t) and Russia (330t) are the world’s top national producers.
Australia (284t) stands as the largest Western producer.
Gold remains one of the world’s most valuable natural resources, central to everything from central bank reserves to jewelry and electronics.
During 2025, the yellow metal set multiple price records, driven by a soft dollar, strong central bank buying and heightened global uncertainty.
This visualization breaks down global gold production by region in 2024, spotlighting the top-producing countries and their contributions to the region supply landscape. The data for this visualization comes from the World Gold Council.
Africa Leads Global Output
Africa is the world’s top gold-producing region, generating 1,010 tonnes in 2023. Ghana leads the continent with 141 tonnes, followed by Mali (100 tonnes) and South Africa (99 tonnes).
Region Production (tonnes) Largest Contributors
Africa 1,010 Ghana (141), Mali (100), South Africa (99)
Asia 665 China (380), Indonesia (140)
CIS 584 Russia (330), Uzbekistan (129)
North America 500 Canada (202), U.S. (158), Mexico (140)
Central & South America 519 Peru (137), Brazil (84), Colombia (66)
Oceania 346 Australia (284), Papua New Guinea (50)
Europe 36
This dominance reflects the continent’s vast mineral resources, though political and operational challenges continue to affect output in some areas.
China, Russia, and Australia Dominate Nationally
China remains the top national producer with 380 tonnes, followed by Russia at 330 tonnes. These two countries alone account for almost 20% of global output.
Australia follows with 284 tonnes, making it the leading Western gold producer and a cornerstone of Oceania’s 346-tonne total.
The Americas Remain Strong Contributors
North America produced 500 tonnes in 2023, driven by Canada (202 tonnes), the United States (158 tonnes), and Mexico (140 tonnes).
Central and South America added 519 tonnes, led by Peru (137 tonnes), Brazil (84 tonnes), and Colombia (66 tonnes). Combined, the Americas contribute more than one-fifth of global supply.
Source: https://www.visualcapitalist.com/charted-global-gold-production-by-region/
Definition:It is the ratio of the volume or weight of overburden (OB) removed to the volume or weight of ore or coal extracted in a surface mine.
SR=OB Removed (M³)/Ore or Coal Extracted (Tonnes)
• A lower SR means more economical mining; a higher SR increases cost.
🔸Types of the SR:
1.Overall Stripping Ratio(OSR): It is the total quantity of OB removed divided by the total quantity of Ore/Coal mined during entire life of mine,Used for long-term planning.
OSR=Total OB removed÷Total ore/coal mined during the mine’s life
2.Instantaneous or Bench SR (ISR or BSR): It is the ratio for a specific portion or bench of the mine,not the entire life,Used for short-term planning & assessing local variations in mine geometry.
3.Break-Even Stripping Ratio (BESR): It represents the max SR at which mining remains economically viable.Beyond this ratio,the cost of removing OB equals or exceeds the value of the ore (No Profit=No Loss).
BESR=Value of Ore-Cost of Ore Mining/Cost of OB Removal
🔸Factors Affecting the SR:
1.Depth of Ore Body: Deeper deposits→ higher SR.
2.Thickness of Seam: Thicker seams→lower SR.
3.Dip of Seam: Steeper dips→higher SR.
4.Nature of OB: Hard/compact OB→increases SR cost.
5.Ore Body Shape & Continuity: Irregular or faulted ore→higher SR.
6.Mining Method & Equipment: Efficient,high-capacity machines→lower SR.
7.Haulage Distance: Longer haul→increases SR cost.
8. Market Price of Ore/Coal: Higher price allows higher SR to remain economic.
9.Cost of OB Removal: Higher removal cost→lower acceptable SR.
10.Groundwater & Drainage: Poor drainage→more OB handling→higher SR.
11.Mine Planning & Scheduling: Proper planning reduces SR;early stages often have higher SR.
🔸Need for Determining SR: Determining the SR is essential because it helps in:
1.Economic Feasibility: To know if mining is profitable or not.
2.Mine Planning & Design:Helps determine the Ultimate Pit Limit (UPL),pit depth & layout,selecting the most suitable mining method and equipment capacity.
3.Production Scheduling: Guides annual stripping and ore production targets.Helps maintain a balance between OB removal and ore extraction.
4.Cost Estimation and Budgeting: SR provides the basis for estimating OB handling costs,unit cost of production and preparing project budgets.
5.Environmental and Safety Compliance: Determines the volume of waste to be handled,dumbed & backfilled.Affects slope design,reclamation planning & stability analysis.
6.Decision on Cut-off Grade and Pit Limit: Helps establish the BESR & Final boundaries of the pit (i.e.UPL).
7. Equipment & Resource Planning: Used to select suitable machine & manpower requirements based on waste-to-ore ratio.
•1.5:1 – Manual quarrying
•2:1 – Semi-mechanized quarrying
•3 to 4:1 – Bucket Wheel excavator
•4 to 5:1 – Shovel-Dumper combination
•8 to 10:1 – Dragline method
The SR is a key economic indicator that determines the feasibility, profitability, mine design, pit depth & life of a mining project.
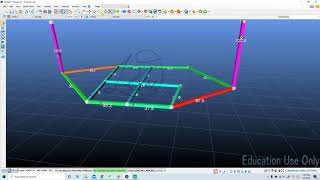
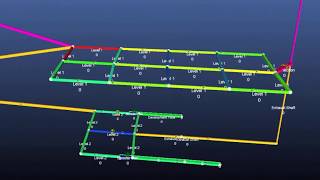
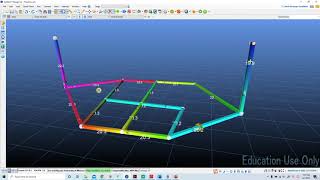
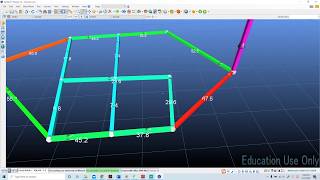
Open-pit mine planning plays a crucial role in defining mineral reserves and optimizing their extraction. The extraction process typically involves mining sequential pits known as pushbacks, which must satisfy complex geometrical constraints to ensure operational efficiency and safe equipment usage. However, current pushback designs are largely manual, rely-ing heavily on the expertise of engineers to translate outputs from commercial tools into practical solutions. This article introduces a novel algorithm inspired by the physical principles of soap bubbles, leveraging their natural tendency to form compact, efficient shapes. The algorithm integrates a new mathematical formulation that simultaneously considers both the economic value and geometric characteristics of pushbacks, producing compact and operationally feasible clusters of blocks. Extensive testing on real mines with large datasets demonstrates the algorithm’s capability to generate practical pushbacks that meet both economic and operational requirements.
Source: https://link.springer.com/epdf/10.1007/s42461-025-01191-7?sharing_token=zpVXSVTE85R1u0v8UVOXave4RwlQNchNByi7wbcMAY6f6iIrkDcZJvLhwsUl34VXMfbSgscTxjsiHZlo0kRQNblp0x5fAdQlUpmaYS629fa1_C7gU3LzFZP-_slBV5Jr_3WbUW_i7rvRWSYThnPpV4VlzkODcv9nn2kzScb7H1c%3D
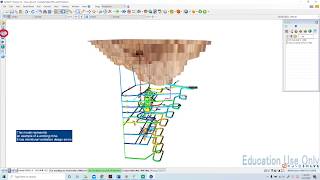
Earlier, I published an article detailing how I did some vibe coding to build a Python-based implementation of a pit optimiser using the Pseudoflow algorithm. While it is a powerful tool well-suited to this task, it has a significant limitation: it is not open source. According to its license, it may be used for educational, research, and not-for-profit purposes without a signed licensing agreement. However, anyone wishing to use it for commercial applications must contact the original developer to obtain a commercial license.
This limitation creates a real obstacle for practitioners and developers who want to integrate pit optimisation into open‑source mining tools, commercial software, or industrial workflows without running into legal or financial hurdles.
And honestly, it doesn’t work for me either. Imagine wanting to start your own mining consultancy but too broke to buy commercial mining software. Even if you build your own tool, you can’t legally use it to make a profit because of licensing restrictions — you’re basically doomed before you even start.
But for every wall that stands in your way, there’s always a way through. And that’s exactly where open source changes the game. It levels the playing field — you don’t need deep pockets, just skill, time, and the determination to build something that works.
And just like the Bear Grylls meme...
That’s why I’ve decided to shift gears and focus on building an open‑source alternative to the Ultimate Pit Limit (UPL) optimiser — free, transparent, and accessible to anyone, whether for research or for business.
And this is just the starting line. Pit optimisation is only the first step toward a bigger vision of open‑source mining software — a future where tools aren’t locked behind paywalls or buried in restrictive licenses. Pseudoflow is powerful, no doubt. But it doesn’t fit that vision. Open source does.
Exploring Open Source Alternatives
Looking for an open‑source alternative to pseudoflow for pit optimisation, I asked my "LLM advisor" for some pointers and ended up with two python graph libraries that can handle max‑flow/min‑cut algorithms — the core of pit optimisation logic. These are iGraph and PyMaxflow. Both are fully open source and widely used in the graph theory and computer vision communities, respectively.
1. igraph
igraph is a general-purpose graph library available in Python, R, and C, widely used for network analysis and graph theory tasks. Interestingly, it also includes a maximum flow solver, which I initially overlooked. My original pit optimiser used igraph solely for graph construction, while the flow computation was handled by the external Pseudoflow library. Only later did I realise (thanks to Chat GPT) that igraph itself can solve max-flow problems.
igraph is released under the GNU General Public License (GPL), making it fully open source and suitable for both academic and commercial use — as long as GPL license terms are respected.
Algorithm Used
igraph implements the Push-Relabel algorithm (also known as the Goldberg-Tarjan algorithm), a well-known method for solving the max-flow problem. This algorithm is efficient and generally performs well for large and dense graphs, though it may not be as fast as some specialised implementations for certain sparse or structured inputs, like mining block models.
I believe that some commercial pit optimisation software also implements Push-Relabel (or variants of it), likely due to its balance between theoretical guarantees and practical efficiency. This further supports the idea that igraph, while not originally designed for mining, can serve as a viable backbone for prototyping or even powering lightweight open-source optimisers.
Usage
You can find the repo for the pit optimiser using igraph here: https://github.com/m-r-v-n/pit-opt-igraph
Sample block model file used for the optimisation: https://github.com/m-r-v-n/pit-opt-igraph/blob/main/marvin_copper_final.csv
Usage remains largely the same as in the original optimiser. The key difference is that it no longer requires explicit search boundary parameters for the X and Y axes. Instead, the spatial search area is now automatically calculated based on the num_blocks_above parameter. This makes the setup simpler and more intuitive, while still maintaining control over the vertical extent for the slope calculation
2. PyMaxflow
PyMaxflow is a Python wrapper around a C++ implementation of the Boykov–Kolmogorov (BK) max-flow/min-cut algorithm, originally developed for image segmentation in computer vision — a problem that’s structurally quite similar to pit optimisation.
Given its performance characteristics and specialisation, PyMaxflow is a strong candidate for building a robust, open-source Pit Optimiser. The BK algorithm isn’t always the fastest in theory, but it performs exceptionally well in practice on many sparse, grid-like graphs — which closely resemble mining block models.
Like igraph, PyMaxflow is released under the GNU GPL license, making it fully open source and freely usable in both academic and commercial settings — as long as you comply with GPL terms.
Usage
You can find the repo for the pit optimiser using PyMaxflow here: https://github.com/m-r-v-n/pit-opt-pmf
Sample block model file used for the optimisation: https://github.com/m-r-v-n/pit-opt-pmf/blob/main/marvin_pmf.csv
Just like the igraph-based Pit Optimiser, usage is nearly identical to the previous Pseudoflow Pit Optimiser - the only required parameter for the search boundary calculation is num_blocks_above.
Also, for the Pymaxflow input data, the index column in the block model file must start at 0 (zero-based indexing). If it starts at 1 or any other value, the optimiser will raise an error during graph construction or execution. Be sure to check and adjust your input data to prevent issues.
Optimisation Result
Below you can see the optimisation result from the Pseudoflow, igraph, and PyMaxflow. The Pseudoflow result is the one used from the previous article while the igraph and PyMaxflow result were made at a later time. All 3 were done in a free tier Google Colab
All three implementations produced the same undiscounted cashflow, but the real differentiator was optimisation time:
Pseudoflow: 31.76 seconds
igraph (Push–Relabel): 2.19 seconds
PyMaxflow (BK): 0.77 seconds
Just a quick heads-up: all of these tests were run in a Python environment, so results may vary if you try them in a different setup like C++. Performance will also vary depending on the machine — for example, when I ran PyMaxflow multiple times in Colab, the optimisation time ranged anywhere from 0.3 s to 1 s.
That said, even with that variability, PyMaxflow’s performance really stood out — and as a miner, I have to dig deeper (pun intended).
A quick search online led me to a 2020 academic article exploring the use of the BK algorithm for ultimate pit limit optimisation — clear evidence that the algorithm is applicable beyond its original field.
The PyMaxflow library has been publicly available in PyPi since 2014.
This library is based on the 2004 version of the BK algorithm as described in: "An Experimental Comparison of Min-Cut/Max-Flow Algorithms for Energy Minimization in Vision," by Yuri Boykov and Vladimir Kolmogorov, published in IEEE Transactions on Pattern Analysis and Machine Intelligence (PAMI), September 2004.
So yeah, the BK algorithm has been around since 2004 — but did no one in mining (including me) actually notice? Or were we all just too busy mining our business? (Another pun intended.)
Anyway, while the optimisation itself is impressively fast in Python, the real bottleneck isn’t the solver — it’s the graph construction, particularly the generation of precedence arcs. This step is both computationally intensive and memory-hungry, often accounting for the bulk of the total runtime. With tens or even hundreds of millions of arcs, it can quickly overwhelm your system’s RAM, making it difficult to run on a standard machine without encountering performance drops or crashes.
This is especially true with my implementation, which includes support for variable slope angles — a feature that adds even more complexity to the arc-generation logic. If you find ways to optimise or improve it, I’d genuinely love to hear about it — feel free to reach out and share your improvements!
PyMaxflow Limits
I did some stress testing in Google Colab using the 300 GB RAM backend, and frustratingly, the process crashed once the number of generated arcs hit around 1 billion. I spent quite a bit of time assuming the issue was in my code, only to eventually uncover the real culprit: a 32-bit limitation that caps the number of arcs at 2³⁰ - 1. No matter how much memory you have, once you hit that threshold — it's game over.
Now, theoretically, it might be possible to lift that cap by tweaking the library to support 64-bit indexing. Whether that’s practical or advisable… well, let’s just say there could be ways. But for most users, it’s probably better to manage arc count conservatively and stay well below the limit.
Wrapping Up
And I guess that’s it — for now.
What started as a search for an open-source alternative quickly evolved into a deep dive into optimisation speed, algorithmic trade-offs, and performance tuning. From Pseudoflow to Push–Relabel to Boykov–Kolmogorov, it’s clear there’s more than one way to optimise a pit — and some are faster, lighter, and freer than others.
But don’t think of the tools I’ve shared here as a finished product. Think of them like a car with stock parts — functional, (un)reliable, and ready to go. With the right tuning, upgrades, and creativity, you can turn it into a 10-second car.
There’s still plenty of room for improvement, especially around memory usage and arc generation performance. If you find ways to optimise or extend it, I’d genuinely love to hear about it.
What’s Next?
Pit optimisation is only one piece of the mine planning puzzle. The next big step? Long-term scheduling — and that’s exactly what I’m diving into now.
I’ve been digging into optimisation techniques for block sequencing beyond classic MIP — things like simulated annealing, tabu search, large neighborhood search, hybrid methods, and maybe even a bit of reinforcement learning. It’s a tougher challenge, but definitely an exciting one!
And yes, it will be open source.
Stay tuned — I’ll be sharing progress and updates soon!
Until then, happy optimising!
Dans l’estimation et l’exploitation des blocs miniers, certaines erreurs peuvent coûter cher. En voici quelques-unes que j’ai pu observer ou éviter :
1️⃣ Mauvais choix de dimensions de bloc : des blocs trop grands masquent les variations de teneur, ceux trop petits surchargent les calculs.
2️⃣ Ignorer la dilution : négliger la dilution géologique ou opérationnelle fausse la rentabilité réelle.
3️⃣ Sous-estimer les pertes minières : oublier les zones inaccessibles ou les chantiers non récupérables biaise le modèle.
4️⃣ Utiliser une densité générique : chaque lithologie a sa propre densité ; la précision est essentielle pour un tonnage fiable.
5️⃣ Mal définir le seuil de coupure (cut-off) : un cut-off mal calculé conduit à l’exploitation de blocs non rentables… ou au rejet de blocs riches.
6️⃣ Absence de validation terrain : sans recouper le modèle avec les données de production, on reste dans la théorie.
📌 Une bonne analyse géométrique repose sur des données solides, des hypothèses réalistes et une collaboration étroite entre géologues, ingénieurs et métallurgistes.
Mine planning is the heart of any successful mining operation — it transforms geological resources into valuable, mineable reserves, ensuring technical, economic, and operational feasibility.
📊 Here's a simplified look at the Mine Planning Cycle — from resource modeling to operations:
🔹 Geological Model: The foundation — understanding the ore body.
🔹 Optimization Inputs: Mining method, geotechnical data, costs, and constraints.
🔹 life of Mine (LoM) Considerations:
Business goals, community impact, and operational limits.
🔹 Optimization & Its Results: Selecting the best pit shell for maximum value.
🔹 Mine Design: Creating the final pit, haul roads, and infrastructure layout.
🔹 Production Schedule: From LoM to weekly plans, aligned with NPV optimization.
🔹 Financial Modeling: Forecasting cost, revenue, and profitability.
🔹 Reconciliation: Comparing plan vs. actual — adjusting for real-world conditions.
🔹 Operational Plan: Turning plans into safe and efficient daily mining activities.
💡 This cycle is not linear — it’s dynamic and requires constant adjustment based on field feedback, economics, and safety.
As a mining engineer, mastering this cycle means improving both productivity and sustainability.
📌 Post 4: EDA- Exploring the Data Before Modeling
In geology, this is called EDA (Exploratory Data Analysis): the process of visualizing, understanding, and detecting patterns or errors in your data before modeling or estimation.
🔍 What does EDA look for in geology?
✅ Grade distribution – Are the values normal, skewed, or multimodal?
➡️ Histograms, boxplots, correlation matrix.
✅ Outliers – Is it an error or a geological anomaly?
➡️ Boxplots, scatter plots
✅ Gaps or unsampled intervals – Is there continuity in the data or zones without information?
➡️ Depth charts, heatmaps
✅ Behavior by geological unit – Do grades change by lithology?
➡️ Boxplots by geological unit
✅ Grades by depth or zone – Are there vertical or spatial trends?
➡️ Scatter plots, grade vs. depth profiles
✅ Comparison between campaigns or laboratories – Are there systematic differences?
➡️ Boxplots by group, comparative scatter plots
📊 A good EDA helps answer key questions:
📌 Where are the rich and poor zones?
📌 How does mineralization vary by rock type?
📌 Is there bias between methods or campaigns?
📌 How continuous is the sampling?
💡 Remember: you can’t estimate what you don’t understand. And EDA is also part of QA/QC, because it helps detect systematic errors or inconsistencies that you wouldn’t notice through geological validation alone.
🎯 In summary:
➡️ EDA is not just about visualization…
➡️ It’s about interpreting, questioning, and preparing your data for estimation with geological criteria.
💬 What charts do you use in your EDA? Have you ever been surprised?
Note: Image for illustrative purposes only 😉
Me permití hacer una investigación acerca de la Permisología Minera en los principales países del Mundo (incluyendo varios de Sudamérica), la información es relevante para nosotros en el Sur que necesitamos de reformas políticas sólidas para incrementar el atractivo de empresas basado en la confianza para invertir y por ende de generar desarrollo para el país y para la población:
Página 1: Marcos regulatorios y permisos mineros en Sudamérica
Página 31: Principales jurisdicciones mineras y marcos regulatorios (Europa, Norteamérica, Oceanía, África)
SECCIÓN I: PERMISOS DE EXPLORACIÓN
Página 50: Cuadro Permisos de Exploración (Europa - Norteamérica)
Página 51: Cuadro Permisos de Exploración (Sudamérica)
Página 52: Cuadro Permisos de Exploración (África y Oceanía)
SECCIÓN II: PERMISOS DE DESARROLLO Y EXPLOTACIÓN
Página 53: Tiempos totales y permisos requeridos: Europa y Norteamérica
Página 54: Tiempos totales y permisos requeridos: Sudamérica
Página 55: Tiempos totales y permisos requeridos: África y Oceanía
SECCIÓN III: ANALISIS COMPARATIVO Y CLASIFICACIONES
Página 56: Clasificación global por eficiencia (Tiempo total desarrollo)
Página 56: Factores críticos de Éxito y Fracaso
SECCIÓN IV: TENDENCIAS Y REFORMAS 2024-2025
Página 57: Principales reformas en curso
A Practical Reflection on Hidden Costs, Precision Engineering, and Operational Survival
This week, I revisited a robust technical report on operational costs in mining. The document, published by the respected SRK Consulting, is a valuable compendium: it details costs by activity, separates fixed and variable expenses, and discusses methodologies such as Activity-Based Costing (ABC), among other essential practices for reducing expenses and maximizing value.
However, one thing caught my attention: there was no mention of the cost of error — the kind that doesn’t appear directly on spreadsheets, but is paid for through rework, metallurgical losses, poorly executed blasts, geotechnical instability, or even irreversible social and environmental impacts.
I couldn’t help but recall 2019, when I was in Chile for a summer internship, visiting a low-grade iron ore operation. In that challenging context, margins were so tight that attention to every detail made a difference, and all quality and uncertainty control systems (QA/QC) were tuned to the highest level. I witnessed precision engineering being used as a tool for economic survival. In that setting, error simply wasn’t an option.
At that moment, I realized a stark contrast with the mindset I’ve often seen in Brazil: the idea that "errors can be absorbed", a mentality historically supported by high ore grades and a more forgiving market environment. But that reality no longer exists. Today, mining operations in Brazil are subject to much stricter demands for precision, control, social responsibility, and sustainability.
So, the big questions are:
👉 How much does an error really cost?
👉 What is the impact of uncertainty on our decisions?
👉 Why is there still resistance to modeling uncertainty as a strategic cost?
As my professor Joao Felipe Costa wisely says:
“Error exists, and our role is to quantify the space of uncertainty.”
And he’s absolutely right.
There are now statistical models, geotechnical systems, sensors, simulations, and algorithms that allow us to measure operational risks and uncertainties with remarkable precision. And every percentage point of ignored uncertainty is, in practice, a hidden cost that undermines the competitiveness and sustainability of any operation.
In a sector under pressure from narrow margins and high responsibility, increasing environmental pressure, stricter social demands, and a diversity of political and economic conditions, incorporating the cost of error into decision-making models is no longer a luxury: it’s a technical and ethical urgency. Ignoring the cost of uncertainty is no longer acceptable. It’s time to turn this “invisible Cost” into a strategic indicator.
Claiming certainty without knowing the degree of uncertainty doesn’t eliminate the error.
The error exists — and must be accounted for.
Precision Engineering Is Impact Engineering
We are called to act with excellence and responsibility. We must look beyond the visible CAPEX and OPEX, and include the variables that truly define long-term viability: error, uncertainty, trust in data, and a commitment to social and environmental impact.
That is the kind of engineering I believe in. That is the future I want to help build.
If you believe in this too, let’s talk. 📩 Leave a comment or send me a message.
💬 Let’s turn data into decisions — together.
Graphite is one of the most versatile and misunderstood materials in the modern industrial world. A crystalline form of carbon, it consists of stacked layers of graphene — a single sheet of carbon atoms arranged in a hexagonal lattice. Graphene is one of the best conductors of heat and electricity known to science, and in graphite form, it delivers a rare combination of exceptional conductivity, high thermal stability, chemical inertness, and remarkable strength-to-weight ratio.
With a melting point of 3,650°C, superb lubricity, and resistance to corrosion, graphite is indispensable across sectors — from energy storage to high-temperature manufacturing. But to understand graphite’s future, it’s essential to separate myth from reality, especially in the battery market.
Two Graphites, Two Stories
There are two main categories of natural graphite: amorphous and flake.
Amorphous graphite is a microcrystalline form derived from needle coke, a byproduct of fossil fuels like coal or tar. Fine and powdery, it’s typically low in purity and requires significant refining for high-tech use. Although natural in origin, its heavy processing means it’s often labelled “synthetic” — partly to distinguish it from flake graphite.
Flake graphite is the crystalline variety, formed in metamorphic rock. Found in flat, plate-like particles with angular edges, it’s made up of stacked graphene layers. Flake size matters: jumbo and large flakes can sell for 3–5× the price of fine flakes. In 2024, medium and large flake prices rose by ~10%, while fine flake prices dropped by ~20%. The natural flake market is expected to grow at a CAGR of 14.6% from 2025–2032, driven by high-performance applications.
The Big Advantage: Expandability
Large flake graphite can be converted into expandable graphite — a form that expands up to 100–300× its original volume when heated. Expanded graphite is then compressed into graphitic foils, prized for:
Thermal conductivity (up to 500 W/m·K in-plane)
Electrical conductivity
Chemical resistance
Durability in extreme environments
Graphitic foils excel in electronics, acting as heat spreaders, thermal interface materials, and heat sinks in smartphones, tablets, LEDs, laptops, and servers. With the rise of compact, high-power devices, their ability to dissipate heat is critical to preventing performance throttling and extending lifespan.
Traditional and Emerging Uses
Graphite’s industrial role extends well beyond batteries:
Steelmaking & Refractories – Furnace linings, crucibles, and molds, plus carbon addition in steel production.
Lubricants & Brake Linings – Dry lubrication in high-friction environments such as automotive brakes.
High-Tech Composites – Graphene production for electronics, fuel cells, solar cells, and plastics with enhanced thermal and mechanical performance.
The Battery Market Reality
Despite popular belief, most battery anodes are not made from natural graphite alone. In 2024, around 90% of battery anode graphite was synthetic and only 10% natural — a dramatic reversal from a decade ago, when natural graphite made up 60–65%.
Why the shift?
Synthetic graphite offers:
Exceptional purity and consistency
Longer cycle life and better SEI (solid electrolyte interphase) stability
Superior performance for fast charging
Better electrolyte compatibility
Synthetic costs roughly 2× more than natural, but for electric vehicles, the longevity advantage often outweighs the price premium.
Natural Graphite’s Comeback in Blends
Natural graphite still has a strong case:
Higher specific capacity (~372 mAh/g theoretical)
Lower cost
Better energy density after processing (e.g., spheronisation, coating)
For this reason, many EV makers are now using blends — ~10% natural in EV batteries and up to 30% in stationary energy storage systems. This delivers a balance of performance and cost.
Demand Outlook
Global lithium-ion battery demand is growing at 12–20% CAGR, and that’s good news for both graphite markets:
3–4× growth in total graphite demand
6–8× potential growth for natural graphite if its share in anodes doubles
With ~40% of current natural graphite output (~700,000 tonnes/year) already going into batteries, and additional demand for high value large flake graphite in electronics and high-performance applications, the future for mined graphite looks bright — even if synthetic dominates battery anodes.
Bottom line: Graphite isn’t just “the battery mineral.” It’s a foundation of many industries, and is increasingly becoming a cornerstone of thermal management in electronics, and a critical material for the energy transition. The key to its future lies in innovation, advanced coatings and blending natural and synthetic for optimal battery performance, scaling production for new technologies, and expanding its role in the high-tech supply chain.
En minería, solemos escuchar frases como “hay que optimizar el proceso” o “necesitamos mejorar la operación” y para algunos resulta ser lo mismo, aunque parecen equivalentes, no lo son.
La optimización y la mejora continua persiguen metas distintas, se aplican en momentos diferentes y exigen herramientas propias.
Técnicamente, "Optimización" se define como la búsqueda del mejor resultado posible a través de un estudio matemático y simulación. Dicho en otras palabras optimizar significa ajustar un proceso para lograr el máximo rendimiento o el mínimo costo dentro de ciertas restricciones. En minería a cielo abierto, un ejemplo típico es la programación de fases con softwares como Whittle o Vulcan, que buscan maximizar el valor presente neto del yacimiento. En ese mismo camino, en minería subterránea, la optimización se refleja en metodologías como Mine-to-Mill, que ajustan desde la fragmentación en tronadura hasta la molienda, reduciendo consumo energético y elevando la recuperación de mineral.
Mientras que la Mejora continua se define como pequeños pasos que construyen resultados. Es decir la mejora continua se centra en identificar fallas, eliminar ineficiencias y reforzar la cultura de trabajo. Aquí entran metodologías como el ciclo PHVA (Planificar, Hacer, Verificar, Actuar).
En la práctica, puede significar ajustar protocolos de ventilación en minería subterránea, reducir la dilución en perforación y tronadura, o rediseñar el flujo de transporte de mineral en faenas a cielo abierto.
Estos dos conceptos podrian explicarse facilmente de la siguiente manera.
- Optimización: es cuantitativa, se apoya en modelos y simulaciones.
- Mejora continua: es iterativa, sistematica, puede llegar a ser repetitiva se enfoca en hábitos, cultura y ajustes prácticos.
- Secuencia lógica: mejorar primero, optimizar después.
¿Por qué importa esta distinción?
Un proceso mal diseñado no puede ser optimizado con éxito. Primero hay que mejorarlo, estandarizarlo y estabilizarlo. Solo después es posible aplicar herramientas de optimización que realmente generen valor.
En minería, confundir estos términos puede llevar a inversiones en software avanzado sin haber resuelto antes problemas básicos de gestión, seguridad o cultura organizacional.
Reflexión final
Optimización y mejora continua no compiten: se complementan. La primera ofrece resultados medibles y cuantificables; la segunda asegura que esos resultados se sostengan en el tiempo. Juntas, son la clave para una minería más rentable, eficiente y sostenible.
Lesson 7 – Part 3
Sometimes, your explosive train doesn’t misfire completely —
It starts, but somewhere along the hole, the detonation wave dies out.
This is a Cut-Off, and it’s just as dangerous.
⸻
🔍 What causes a Cut-Off?
– Poor continuity in the explosive column
– Gaps between boosters or cartridges
– Water degradation of explosives
– Bad priming (wrong type or position)
– Column collapse due to improper stemming or geological failure
⸻
⚠️ Why is it dangerous?
– You think the hole fired, but part of it didn’t
– There could be unexploded explosive deep in the hole
– Secondary blasting becomes extremely risky
– Drill rigs hitting unexploded sections can cause fatal accidents
– You lose performance: poor fragmentation and high oversize
⸻
🛡️ How to prevent Cut-Offs:
✅ Use continuous explosive column — no gaps
✅ Ensure water-resistant explosives in wet holes
✅ Double-check booster placement and priming
✅ Proper stemming with suitable material and technique
✅ Avoid drilling in soft zones that collapse during loading
⸻
🛠️ Field Practice:
– Log all holes and match explosive types to hole conditions
– After blast, inspect muckpile signs — look for signs of poor breakage
– If a hole is suspicious, treat it like a misfire until confirmed otherwise
⸻
🎯 Remember:
A Cut-Off is a misfire in disguise.
Just because it started doesn’t mean it finished.
Treat it with the same caution — and plan to avoid it from the start.
Cutoff, production rate, value - shift one, shift them all.
How do you strike the right balance?
A sensitivity analysis is commonplace in any technical report - assessing project value when a single variable changes in isolation.
The problem is that a single variable seldom if ever changes in isolation.
Every decision has a ripple effect.
You can't optimize one variable without impacting the others.
Yet many project charters etch a singular focus from the start- whether it’s minimizing capital intensity, maximizing throughput, or squeezing cost per tonne.
As a result, studies tend fixate on technical hurdles, while overlooking business fundamentals and project delivery drivers.
I'm not throwing shade at the importance of technical rigor. But a technically sound project that never gets built is just a good-looking spreadsheet.
So how do we widen our focus?
Start by modeling mining's three-body problem - cutoff, production rate, and value. The concept is simple:
> Model scenarios using different cutoffs, methods, production rates
> Estimate resulting NPVs
> Identify where the value peaks
It's powerful at concept, scoping or PFS, where the range of outcomes is still wide enough to test.
For project teams, it exposes trade offs that aren't obvious in isolation.
But the value of this method hinges on your assumptions. Cost curves, recovery factors, geotechnical constraints, commodity pricing. Get these wrong and your "value" is nothing but a mirage.
Still, when grounded in good data and sound judgement, it can change the trajectory of a project. It moves the conversation from:
“What can we do with this deposit?”
to
“What should we do to maximize its value?”
It's not just a technical exercise.
It's a strategy tool, best applied before your options narrow.
The insights are worth the effort, but remember...
Garbage in still means garbage out.
Have you tried balancing mining's three-body problem?
How did it influence your design or strategy?
Too often, Reserves reporting is misunderstood—especially by non-technical stakeholders—as a self-contained exercise. In reality, reporting Mineral Reserves in accordance with the JORC Code (2012) or KCMI is not an objective in itself. It is the formal summary of a Life-of-Mine plan that has already been developed to a sufficiently detailed level.
As per JORC Clause 29:
"A Mineral Reserve is... defined by studies at Pre-Feasibility or Feasibility level as appropriate that include application of Modifying Factors."
In operating mines, this study is typically the Budget-level Life-of-Mine Plan—aligned with AACE Class 2 estimates under Recommended Practice 47R-11, a framework also recognised by CRIRSCO.
📌 Key Point:
A Reserve cannot be declared without a supporting mine plan. Attempting to do so is not only non-compliant, it risks misleading stakeholders.
✅ The Reserves statement is the output, not the input or objective, of mine planning.
I've been thinking about why some mining companies successfully adopt innovation while others struggle, despite having similar resources and challenges. The difference often comes down to organizational readiness. It is not a question of company size, but it is always a question of culture and legacy systems.
As part of our business model, Objectivity performs a scoping study to demonstrate how DRX can improve drilling efficiency (defined as expected volume meeting QP/CP requirements per metre drilled). When compared to a baseline plan, DRX will improve the efficiency and identify other value drivers leading to better drilling outcomes. Through this process, I’ve observed some clear indicators that distinguish companies genuinely open to innovation and change.
1. Decision-making speed.
If it takes you longer to get your new “innovative” supplier onboarded and under contract than it does for the innovator to deliver or demonstrate their value proposition, you're probably not ready.
We often confuse thoroughness with delay. If your approval process for testing new approaches involves multiple committees and months of deliberation, you're structurally designed to resist innovation.
2. Onboarding process for new technologies.
Do you have a clear pathway from concept to implementation? Or does each new idea get treated as a unique event requiring special handling?
Innovation requires a process for rapid experimentation and learning, not perfect first attempts.
3. Systems to assess whether an innovation was effective?
I've seen companies implement new technologies without clear metrics for success. They can't tell you whether the innovation worked because they never defined what "worked" means. Often, there is no baseline performance data to compare to, or, there is plenty of data, but little metadata describing the data or its quality.
4. Collaboration across disciplines
The most successful projects we have had are the ones where everyone involved benefits from working directly with people who know their domain inside out. Resource drilling eventually has to turn into a reserve, so you might as well get the engineers on the call. And if you’re already running a producing mine, you could get the production department involved. It may help them understand why they should support the rigs.
5. Innovation/adoption is principality driven by culture.
Good culture equals good and happy people equals good corporate growth (think Costco). A rigid hierarchy and lack of responsibility stops innovation.
You need an environment where technical personnel, domain experts, and decision-makers can talk openly, where responsibility and trust flow freely, not where they're trapped behind layers of legacy process.
Build systems based on respect, speed, fairness, clear measurement, and genuine openness. Flatten your structure, empower your people, and watch efficiency grow. Or don’t.
En los estudios económicos de un proyecto minero, las reservas juegan un rol crítico en la valorización del mismo.
En el gráfico, se muestra cómo una variación del 1% en las reservas minerales (por tonelaje o ley) puede modificar el NPV en aproximadamente $6.2 millones de dólares. Esta relación proporcional evidencia la alta sensibilidad del NPV frente a las reservas.
En este ejemplo se tiene un NPV base de 288 millones de USD. Una disminución del 30% en las reservas podría reducir el NPV a 105, mientras que un aumento del 30% lo elevaría hasta 474 millones.
📊 Fuente: Mining Project Value Optimization
Strength of materials - 20
Structural Analysis - 16
RCC-36
Soil & Foundations - 74
Hydrology - 20
Fluid Mechanics - 50
Irrigation - 50
Environmental Engineering - 50
Transportation - 77
It will be very helpful for every competitive Exams like ESE, GATE, SSC, DDA,BARC, ISRO, PSUs and State service Exams etc.
Reverse Circulation (RC) Drilling Rig: is a widely used technique and quick drilling method used in mineral exploration and method of testing the size, grade, and geology of mineral deposits before mining starts, where compressed air is used to push rock cuttings through the inner tubes of drill rods to the surface. This allows for the collection of fine rock samples for analysis and providing geological information at regular intervals .
RC Rig Functions:
Drilling:
Dual-tube drill rods (inner and outer) are pushed into the ground.
Air Delivery:
Compressed air is pumped down through the space between the tubes.
Cuttings Ejection:
Compressed air rises, carrying rock cuttings (from drilling) through the inner tube of the drill rods.
Sample Collection:
Rock cuttings are separated from the air via a cyclone system, and samples are collected for analysis.
RC Rig Components:
Dual-tube drill rods: These are the tubes that descend into the drilling rig.
Drill Hammer: This is the tool that breaks up the rock.
Drill bit : Typically made from hardened steel or tungsten carbide, designed to crush and break rock.
Air Pump: Provides the compressed air needed to propel the rock cuttings.
Cyclone System: Separates the rock cuttings from the air.
The importance of reverse circulation drilling (RC rig):
Sample extraction:
Fine samples of rock can be extracted for analysis.
Mineral locating:
Samples can be used to locate minerals such as gold and other metals.
Deep penetration: can reach significant depths, enhancing exploration capabilities.
Reverse circulation drilling:
Air is sent through the space between the tubes and forces rock pieces through the inner tube.
The most important informations we should collect while working on the rigs are :
- quick description of ( lithology, alteration, associated minerals appearance ).
- starts and ends of our expected mineralised zones approximately.
- split and prepare samples and its weight .
- Resource Assessment : Aids in quantifying mineral resources estimation.
- faster drilling rates: general quicker than diamond drilling, making it cost-effective for exploration.
Note : The drilling rate different by the rock unites and its hardness.
In short, an RC rig is an effective tool in mineral exploration, as it allows accurate rock samples to be extracted and analyzed and faster and more economical and less cost than other drilling methods .
Data centers are facilities that house computer systems, including servers, to store and manage data. Demand for data centers is rising, especially to support new AI technologies that are computationally intense. Data centers require large amounts of energy and mineral resources to build, including critical minerals. The U.S. relies on imports from other countries for many of these minerals. Here are some of the key minerals essential to data centers.
How to Read This: Here are key minerals used in each part of the data center, and the percent the U.S. imports to meet consumption for that mineral (based on the USGS Mineral Commodity Summaries 2025).
Serverboards and Circuitry: Serverboards connect the essential electrical components of a server. These, and other intricate circuitry, require minerals that are able to efficiently conduct electricity and are resistant to corrosion - especially copper.
Silver - 64%
Gold - 0%
Copper - 45%
Tin - 73%
Tantalum - 100%
Palladium - 36%
Platinum - 85%
Heat Sinks: Heat sinks prevent servers from overheating by transferring heat away from sensitive electronics. These metals are highly conductive, malleable and resistant to corrosion.
Aluminum - 47%
Copper - 45%
Semiconductors and Microchips: Microchips and processors are the “brains” of data centers. They work because of semiconductor materials like silicon and germanium that conduct electricity under specific conditions.
Arsenic - 100%
Flourspar - 100%
Gallium - 100%
Germanium - 100%
Indium - 100%
Palladium - 36%
Platinum - 85%
Silicon - 75%
Boron - 0%
Rare Earth Elements - 80%
Data centers are energy-intensive.
In addition to minerals required to build data centers, mineral resources are also used in energy production and storage to power data centers. Between 2014 and 2024, data center load growth tripled. By 2028, data centers could consume 12% of total U.S. electricity (Shehabi et al. 2024, United States Data Center Energy Usage Report, https://doi.org/10.71468/P1WC7Q).
The USGS tracks over 90 mineral commodities in 180 countries to provide information about the supply risks of, demand for, and flow of minerals used in diverse sectors of the economy.
Source: https://www.usgs.gov/media/images/key-minerals-data-centers-infographic
Resumo: Em depósitos polimetálicos, a presença de múltiplos elementos economicamente valiosos dificulta a análise comparativa e a classificação de recursos. O conceito de teor equivalente surge como uma ferramenta fundamental para integrar diferentes metais a partir de um único parâmetro de valor, facilitando a avaliação técnica e econômica. Este artigo discute os fundamentos do cálculo de teor equivalente, sua aplicação em diferentes contextos geoeconômicos, limitações práticas e exemplos reais de sua utilização na indústria mineral.
1. Introdução
Depósitos polimetálicos, como os de Cu-Au-Ag, Zn-Pb-Ag ou Cu-Mo-Au, representam desafios singulares para engenheiros de minas e geólogos econômicos devido à diversidade de elementos com diferentes valores de mercado, custos de recuperação e comportamentos metalúrgicos. Para facilitar a avaliação econômica e a comparabilidade entre blocos ou domínios de um depósito, utiliza-se o conceito de teor equivalente (equivalent grade), convertendo todos os teores ao equivalente de um único metal de referência.
2. Conceito de Teor Equivalente
O teor equivalente representa o teor de um único metal que geraria o mesmo valor econômico que a combinação de metais presentes. Ele permite, por exemplo, expressar teores de ouro e prata em termos de equivalente ouro (AuEq) ou cobre e molibdênio em termos de equivalente cobre (CuEq).
A fórmula básica do teor equivalente é:
2.1 Tipos de Teor Equivalente
A aplicação do conceito de teor equivalente pode assumir diferentes abordagens conforme o objetivo do estudo, o nível de conhecimento do depósito e a natureza dos produtos gerados. Os principais tipos de teor equivalente incluem:
a) Teor Equivalente Baseado em Preço de Mercado (ou Valor Bruto)
Este é o tipo mais comum e representa o valor dos diferentes metais com base nos seus preços brutos de mercado, sem considerar custos de recuperação metalúrgica, transporte ou comercialização. Embora seja útil para comparações iniciais e classificações exploratórias, tende a superestimar o valor real dos componentes do minério.
b) Teor Equivalente Metalúrgico (ou Teor Equivalente com Recuperação)
Neste caso, as recuperações metalúrgicas são incorporadas no cálculo, tornando o resultado mais representativo da realidade de uma futura operação. É amplamente utilizado em estudos de viabilidade, estimativas de recursos e projetos com definição de rota de processo conhecida.
c) Teor Equivalente Econômico (ou Teor Eq com Receita Líquida)
Este é o mais completo e acurado, considerando não apenas recuperação metalúrgica, mas também custos operacionais (tratamento, refino, transporte, royalties, penalidades). Converte todos os elementos em valor líquido recuperável em termos de um único metal, podendo ser utilizado para análise econômica de cenários e comparação entre projetos.
3. Aplicações Práticas
3.1 Avaliação Econômica Preliminar
Durante estudos de scoping e pré-viabilidade, o teor equivalente fornece uma estimativa simplificada de valor de um corpo mineral, ajudando na seleção de alvos de perfuração ou na modelagem preliminar de recursos.
3.2 Seleção de Cut-off
É comum definir o cut-off em termos de teor equivalente, como por exemplo:
4. Exemplo de Cálculo
Considere um depósito com os seguintes parâmetros:
Teor Cu: 0,5%, Recuperação Cu: 90%, Preço Cu: US$ 9.000/t
Teor Au: 0,4 g/t, Recuperação Au: 80%, Preço Au: US$ 2.000/oz
1 oz = 31,1035 g
Convertendo o teor de ouro para equivalente cobre:
CuEq(Au) = 0.4*(0.80*2000*(1/31.1035))/(0.90*9000) = 0.254%
CuEqTotal (Au) = 0.5% + 0.254% = 0.754%
5. Limitações do Método
Volatilidade de preços: Alterações nos preços de mercado afetam diretamente os teores equivalentes.
Recuperações distintas: Nem todos os metais têm recuperações previsíveis ou constantes.
Penalidades metalúrgicas: Certos elementos podem impactar negativamente o processo ou o concentrado final.
Riscos jurídicos/fiscais: A comercialização de determinados metais pode ser mais onerosa em certas jurisdições.
6. Considerações Finais
O uso de teor equivalente é uma prática consolidada na engenharia de minas, sendo uma ferramenta essencial para análise de viabilidade técnica e econômica de depósitos complexos. No entanto, seu uso deve ser criterioso, sempre baseado em premissas atualizadas de preço, recuperação e fluxo de processo.
Referências
CRIRSCO (2019). International Reporting Template for the Public Reporting of Exploration Results, Mineral Resources and Mineral Reserves.
SME (2011). Mining Engineering Handbook.
AusIMM (2020). Monograph 30 - Mineral Resource and Ore Reserve Estimation.
JORC Code (2012). Australasian Code for Reporting of Exploration Results, Mineral Resources and Ore Reserves.
David Drumond - Engenheiro de Minas/ Doutor em Engenharia de Minas, Metalurgia e Materiais
In mining, success depends not just on what we extract but on how well we do that. And to optimize the mining process, we need to understand the orebody. A.k.a Orebody knowledge.
Orebody knowledge is not just a buzzword. It encompasses a wide range of fields (geological, geotechnical, geochemical, and metallurgical) that described the characteristics of a deposit. It’s the backbone of informed decision making across the mine life cycle. Exploration to closure.
✅ Why it matters:
- Accurate resource estimation
- Safer and more efficient mine designs
- Optimized extraction and scheduling
- Reduced operational risk
- Improved processing and recovery
- Safer waste rock and tailings disposal
Geotechnical characterization and domaining is just one part aspect of "Orebody Knowledge" but it is a key contributor to optimize the mine design/extraction sequence and execute it safely. The image (Sala & Santos 2022, modified from Read & Stacey, 2009) below is a great illustration of the typical inputs to a geotechnical domain model.
Deposits and mining methods differ, and the geotechnical characterization is adjusted accordingly. As it should be.
But here’s the question I’d love to hear your thoughts on: Which aspect of geotechnical characterization and orebody knowledge do you think is most overlooked?
As an example: microdefects/veining is not explicitly shown in the figure while it has a material impact on porphyry deposits.
Which aspects should we pay more attention too?
The JORC Code and NI 43-101 are two prominent reporting standards used in the mining industry for resource estimation. Here is a comparison between the two:
1. **JORC Code (Australasian Code for Reporting of Exploration Results, Mineral Resources and Ore Reserves)**:
- **Region**: Primarily used in Australasia (Australia and parts of Asia).
- **Main Principles**:
- It focuses on providing clear guidelines for the reporting of exploration results, mineral resources, and ore reserves.
- JORC requires transparent reporting and compliance with defined standards.
- **Compliance**: Mandatory for companies listed on Australian stock exchanges.
- **Categories**:
- Exploration Results, Mineral Resources, and Ore Reserves are classified based on their geological certainty and economic viability.
- **Competent Persons**: Reports must be prepared by a "Competent Person" who is a member of a recognized professional organization.
2. **NI 43-101 (National Instrument 43-101)**:
- **Region**: Mainly used in Canada.
- **Main Principles**:
- It aims to standardize reporting on mineral properties to provide investors with clear information.
- NI 43-101 ensures fair disclosure, accuracy, and transparency of mineral project information.
- **Compliance**: Required for all Canadian companies listed on Canadian stock exchanges.
- **Categories**:
- Like JORC, NI 43-101 distinguishes between Exploration Results, Mineral Resources, and Mineral Reserves based on confidence levels and economic considerations.
- **Qualified Persons**: Reports must be prepared by a "Qualified Person" who is required to be a professional geoscientist or engineer.
In summary, both the JORC Code and NI 43-101 are reporting standards that aim to ensure transparency, accuracy, and consistency in reporting exploration results, mineral resources, and ore reserves. While they have similarities in the classification of resources, the main difference lies in the terminology used and the specific requirements for reporting in each standard.
In mining, planned vs. actual reconciliation is much more than a monthly report: it is the “thermometer” of the operation.
👉 For the company, it means evaluating operational efficiency and adjusting costs.
👉 For the mine, it shows how closely planning adheres to real mining conditions.
👉 For investors, it is proof of transparency and predictability of results.
In general, the process consists of comparing:
What was planned (block models, mine sequencing, production targets);
With what was executed (moved volumes, actual grades, delivered production).
This analysis allows deviations to be identified, models to be corrected, sequencing to be improved, and resources to be optimized.
In coal mining, reconciliation becomes even more critical:
⚒️ Quality variations (ash, moisture, calorific value) can directly impact contracts and financial outcomes.
⚒️ Quick adjustments ensure that planning remains aligned with plant or market requirements.
In the end, reconciliation is not just a control measure but a continuous learning process that builds trust across the entire mining value chain. And this trust is only possible when the starting point — the block model — is properly validated. After all, there is no reliable reconciliation without a solid model, just as there is no efficient planning without reconciliation to test and feed it back.
Large diameter raise boring is commonly used for developing cylindrical vertical to inclined shafts in underground mines. The circular cross section is favourable from a geotechnical perspective, and a significant benefit of raise boring is an improvement in safety with the removal of personnel to work directly in the shaft during development. However, unlike conventional shaft sinking, if ground conditions are poor, there is no generally little or no opportunity to install support until the shaft is completed. As such, shaft conditions need to be well understood prior to commencing development to determine whether the shaft can remain stable throughout the back-reaming process, or stable with pre-support.
An alternative location needs to be sought if conditions in the selected location are not amenable to raise boring at the desired diameter, otherwise the shaft might collapse, and the expensive gear lost. Unsafe conditions could also arise if conditions are not amenable.
The geotechnical investigation requirements will vary depending on the shaft development method and geotechnical conditions at the shaft location. For the highest confidence in results, the investigation drillhole should be located as close as possible to the planned shaft axis (within 10 m) and hole deviations should be understood when assessing the confidence of results along the length of the shaft. However, there are circumstances where 10 m can be too large, such as the presence of sub-vertical adverse geological structures which might be intersected by the raise but not by a drillhole placed along the raise axis. There would be a residual risk that an unknown subvertical structure close to the raise can lead to significant failure or falloff. If there was a history of this at the site, there might be a case to drill inclined holes to confirm that there are no adverse dykes or structures near the proposed raise, at least in the weathered zone.
Although the investigation drillhole should be positioned as close as possible to the planned raise, it is important to consider that reaming cannot be conducted through drill rods if they become stuck in the hole. If that is considered to be a risk, the cover hole should be stepped off by about 5 m.
Other considerations for data confidence include core loss, whether from navigational drilling (which should be avoided) or from poor ground conditions. HQ triple tube drilling should be considered throughout any weathered or weak rock zones and in all cases, careful core handling and marking of drillers’ breaks should be diligently applied.
In some circumstances, the geotechnical investigation drillhole might not be required. For example, at a mine where there is already significant experience in raise drilling and the geological and geotechnical conditions are already well known (and consistent), investigation drillholes are not required for shorter and smaller diameter raises (such as escapeways). However, for any large diameter raises, the risks associated with low data confidence should be well understood if a shaft investigation drillhole is not undertaken.
Comprehensive practical guidance on raise bore and shaft geotechnical analysis is presented in Mine Mentor’s module on the topic.
To learn more, visit: https://mine-mentor.com/learning/
Lectura esencial para quienes miden, proyectan y construyen el territorio
Me permito recomendar una obra que ha marcado generaciones de ingenieros topógrafos, constructores y proyectistas: el “Tratado de Topografía” de Raymond E. Davis, acompañado por Francis S. Foote y Joe W. Kelly. Más que un simple libro, este compendio es un pilar académico y técnico que atraviesa con rigor los fundamentos, métodos modernos e históricos, instrumentos y aplicaciones de la topografía clásica y aplicada.
📚 En su quinta edición, cuidadosamente traducida por el Dr. José María Mantero, este tratado no solo sirve como texto para estudiantes, sino como una herramienta de consulta permanente para profesionales. Su enfoque exhaustivo abarca desde el uso del teodolito y la cinta hasta los levantamientos fotogramétricos, caminos, minas, obras civiles y medición de caudales. Con ejemplos, problemas de campo, fundamentos astronómicos y prácticas de gabinete, logra un equilibrio entre teoría y experiencia.
🌍 Como docente y profesional, valoro especialmente su énfasis en la precisión, trazabilidad y responsabilidad del topógrafo frente a la sociedad. Es un recordatorio de que cada plano, cada curva de nivel y cada punto georreferenciado tienen impacto en las decisiones territoriales, ambientales y técnicas.
📐 Si trabajas en diseño de infraestructura, catastros, obras civiles, hidráulicas o minería, este tratado sigue siendo una fuente confiable y profunda para revisar conceptos, resolver problemas y formar nuevas generaciones con base sólida.
🔗 La topografía no ha pasado de moda: se ha modernizado, se ha digitalizado, pero sigue siendo el arte y la ciencia de conocer la tierra con exactitud.
Authors:
R A Y M O N D E. D A V IS
F R A N C I S S . F O O T E y J O E W . K E L L Y
Profesores de Ingeniería en la Universidad de California
Versión española de
JO SE MARIA MANTERO
Dr. Ingeniero Geógrafo
I've been thinking about why innovation in mining moves at such a glacial pace compared to tech, and it comes down to a fundamental reality that many industry consultants miss: mining is a small market with unique constraints that require different innovation approaches.
When Apple first reached a $1 trillion valuation, every major mining company was about 1/8 its size. Fast forward to 2021, and BHP (the largest mining company in the world) had become 1/19th the size of Apple. Today in 2025, Apple sits at around $3 trillion while the largest mining companies have not grown in comparison.
When Apple allocates just 1% of its value to R&D, that's $30 billion, more than many mining companies' entire market capitalization. They can afford to have centralized innovation teams with thousands of specialists working on next-generation technologies. They can afford to fail repeatedly because the successes will more than pay for the failures.
Mining companies don't have that luxury. We can't use the same processes as Apple or Google or any tech giant because we don't have the same resources or market dynamics. For us to imagine that we can compete with Apple on a level playing field for innovation is ridiculous.
This reality creates several challenges that are unique to mining innovation:
First, we can't afford the same failure rates. When a technology company launches ten innovations and two succeed wildly, that's considered a massive win. In mining, we need eight or nine out of ten to succeed just to justify the investment.
Second, we can't afford specialized innovation teams at the same scale. While technology companies have thousands of people focused solely on innovation, mining companies might have a handful, if they have dedicated innovation staff at all.
Third, our innovation cycles are necessarily longer. We can't just push a software update to millions of users overnight. Implementing new technologies in mining involves physical infrastructure, regulatory approvals, and operational changes that take time.
Fourth, our market for any specific innovation is minuscule. A tech company can sell a successful product to billions of enthusiastic consumers or millions of businesses. A mass market innovation can also be funded completely by advertising allowing it to be “free”. A mining innovation might only have a few hundred potential customers distributed around the world.
It doesn't mean we should give up on innovation, quite the opposite.
Instead of imitating models from tech industries that operate under entirely different dynamics, mining needs frameworks tailored to our specific constraints. Rather than criticizing ourselves for not innovating like Apple or Google, we must embrace our industry’s realities. Mining innovation should serve clear value creation, not become an end in itself.
El Futuro de la Minería a Cielo Abierto: Inteligencia Artificial y Equipos Autónomos como Claves de la Eficiencia
La industria minera está atravesando una transformación impulsada por la inteligencia artificial (IA) y la automatización, tecnologías que están redefiniendo la forma en que operan las minas a cielo abierto. Estas innovaciones no solo buscan incrementar la productividad, sino también minimizar errores humanos, reducir costos operativos y mejorar las condiciones de seguridad.
1. Optimización de la Producción con Inteligencia Artificial
Los algoritmos de IA son capaces de analizar grandes volúmenes de datos geológicos, topográficos, operacionales y climáticos en tiempo real. Esta capacidad de procesamiento permite:
• Optimizar los planes de minado, ajustando los diseños según la ley del mineral, los costos de extracción y las condiciones del terreno.
• Predecir el comportamiento de los equipos, reduciendo paradas no programadas gracias al mantenimiento predictivo.
• Tomar decisiones automatizadas, priorizando zonas de mayor rentabilidad sin intervención humana directa.
Esto reduce los tiempos de respuesta ante cualquier cambio en el entorno operativo, haciendo más dinámico y eficiente el ciclo minero.
2. Camiones de acarreo autónomos
Los camiones sin conductor operan con precisión milimétrica, siguiendo rutas programadas que evitan accidentes, reducen el desgaste de las vías y maximizan la eficiencia del transporte. Entre los beneficios destacan:
• Disminución del error humano, especialmente en tareas repetitivas o de largas jornadas.
• Operación continua 24/7 sin fatiga.
• Consumo de combustible más eficiente debido a patrones de conducción optimizados.
3. Perforadoras autónomas
Las perforadoras automatizadas aseguran precisión en la ubicación, profundidad y orientación de cada barreno. Esto tiene efectos directos en:
• Mejor fragmentación del material, lo que reduce los costos de tronadura y acarreo.
• Mayor seguridad, ya que se evita la exposición del personal a zonas de alto riesgo.
• Estandarización del proceso, reduciendo las variaciones de calidad.
4. Drones para topografía y monitoreo
Los drones equipados con cámaras de alta resolución y sensores LIDAR o multiespectrales permiten realizar:
• Mapeos rápidos y actualizados de la mina, mejorando el control volumétrico y el seguimiento del avance.
• Inspecciones en zonas peligrosas o de difícil acceso sin exponer al personal.
• Monitoreo ambiental y de estabilidad de taludes, previniendo deslizamientos o eventos geotécnicos.
5. Beneficios generales para cualquier mina a cielo abierto
• Reducción de costos operativos y de capital al disminuir la necesidad de intervención humana y errores asociados.
• Mayor seguridad en todas las operaciones, especialmente en entornos remotos o extremos.
• Mejor control de los indicadores de producción, al tener datos en tiempo real.
• Menor huella ambiental, gracias a decisiones más precisas en la planificación y ejecución.
Definir correctamente tus Objetivos y KPIs en RRHH, es clave para impulsar los Objetivos de tu Negocio.
Pir lo general deberás superar, al menos estos 11 Obstáculos y Errores Comunes para Definir y Medir Objetivos y KPIs en RRHH.
1. Falta de alineación estratégica:
Dificultad para vincular los objetivos de RRHH con los objetivos del Negocio. Poco dominio de las palancas que generan ingresos y gastos en el Negocio
2. Falta de una metodología práctica y coherente:
Tanto para definir Objetivos y KPIs, como para medirlos y hacer análisis posteriores.
Te recomiendo mi Método JUANCA, que incluye 4 componentes: Preguntas Claves a Clientes Internos, Conversión de Quejas en Objetivos, Benchmarking y Menú Predeterminado con más de 600 Objetivos y KPIs en RRHH para que puedas escoger y adaptar a tu situación específica.
3. Datos insuficientes o poco fiables:
Escasez de información precisa para medir el desempeño o establecer KPIs relevantes.
4. Resistencia al cambio:
Empleados o líderes que se oponen a nuevos KPIs o procesos de evaluación.
5. Objetivos poco claros o ambiguos:
Definir metas vagas que no son medibles ni alcanzables.
6. Falta de tecnología adecuada:
Sistemas obsoletos que dificultan la recolección y análisis de datos.
Te recomiendo mi MetroKPI, un software simple, directo, práctico, económico, que te ayuda desde la definición de tus Objetivos y KPIs en RRHH, hasta medirlos, evaluarlos, diseñar Programas Estratégicos de Mejoras, a medir el ROI Esperado y Real de los mismos, a hacer Reportes Analíticos que muevan a la acción….
7. Prioridades cambiantes:
Cambios frecuentes en la estrategia organizacional que desactualizan los KPIs.
8. Escasez de habilidades analíticas:
Falta de personal capacitado en RRHH para diseñar e interpretar KPIs.
9. Cultura organizacional débil:
No se fomenta la rendición de cuentas o el seguimiento de objetivos.
10. Enfoque excesivo en métricas de procesos:
Ignoran KPIs financieros y de ROI.
11. Falta de comunicación interna:
Desconexión entre departamentos que impide establecer KPIs colaborativos.
Te puedo ayudar.
¿Qué obstáculo se te hace difícil superar?
¿Qué otros obstáculos estás enfrentando?
Kriging is a geostatistical technique used to predict unknown values at specific locations based on nearby observed data. It is widely used in fields like environmental science, mining, and machine learning for accurate spatial predictions. When applied correctly, kriging can significantly improve prediction accuracy.
✔️ Accurate Predictions: Kriging considers distance and direction of data points for precise estimates.
✔️ Error Minimization: Reduces prediction error by weighting observations based on spatial correlation.
✔️ Uncertainty Assessment: Provides confidence intervals to assess prediction reliability.
✔️ Flexible Methods: Supports ordinary, simple, and universal kriging for different data patterns.
❌ Computational Intensity: Can be demanding for large data sets due to matrix operations.
❌ Overfitting Risk: Complex models might capture noise instead of actual patterns.
❌ Assumption Sensitivity: Relies on assumptions about stationarity and data distribution.
❌ Edge Effects: Predictions near data set edges can be less reliable.
The visualization below illustrates simple kriging as the mean and envelope of Brownian random walks passing through the data points. Visualization adapted from Wikipedia: https://en.wikipedia.org/wiki/Kriging#
🔹 In R: The gstat and automap packages support variogram modeling and kriging, while geoR allows Bayesian kriging.
🔹 In Python: Use pykrige for kriging and scikit-learn for Gaussian process regression. geopandas handles spatial data, and dask manages large-scale computations efficiently.
https://www.linkedin.com/in/joachim-schork/
Since founding Objectivity I’ve discovered that resource drill planning is mostly being done with the assumption that more drilling will lead to more resource classification/definition. More drilling isn't always better in mining. Here is why.
Like many things in mining this is not quite correct and the current process leaves a lot of value on the table. Budget is often set before a full technical assessment (as these tend to evolve during budgeting), there are no clear KPIs, boards/management tend to reduce budgets (because drilling is often the first casualty of cost control) and there are a limited number of options reviewed when making plans. Someone presents a plan with X number of holes, and often the only question asked is “can you add a hole here and there?” or “what can you do with half the budget?”.
Resource development drilling and exploration drilling have very different value drivers. The former benefits from a QP/CP defined sampling criteria that will guide the resource drilling plan’s layout. Unfortunately spacing is a great criteria for a time when holes were planned in 2D on mylar.
But what if I told you that in most cases, you could achieve the same expected resource conversion with 30% fewer drill holes, while meeting QP/CP sampling requirements? You'd probably say: "That's not possible."
When we analyze resource conversion efficiency, we see a curve that looks like this: as you add more drill holes, the percentage of volume potentially converted increases, but not linearly. Drilling from 10,000 to 13,000 meters can improve resource conversion by 24%, but then adding another 3,000 meters yields only an additional 7% (data courtesy Adventus Zinc @Curipumba). The curve always flattens dramatically after a certain point, reducing incremental value.
This is the investment curve that highlights a critical point of diminishing returns that most drilling programs blow right past.
This is sensitivity analysis for your resource drilling - sensitivity analysis is always expected at the feasibility study stage yet seldom used for an activity that is on every mining/late stage exploration project’s critical path.
Would you make better decisions with multiple plans objectively assessed against key criteria, or with just a single plan? The answer seems obvious, yet most companies stick to the single-plan approach citing, “no time”, “no people”, “shifting criteria”.
Still skeptical? Good, skepticism is healthy. But why not put us to the test? We are confident that we can change how you think about resource drilling and the value that it produces. Increasing conversion efficiency, while respecting QP/CP requirements, will make our industry more financially efficient. Show us your data and we'll show you a range of solutions to help make objective based investment decisions.
Begin optimizing your investment here:
https://docs.google.com/forms/d/e/1FAIpQLSe8JdRWRB5MK9gnzJbk3FQZu17dFmWyUkre8S2yXo_k0l2HIw/viewform
Geotechnical engineering plays a vital role in mine design and safety.
It’s not just a support function — it ensures stability across both open pit and underground operations.
As part of a geotechnical study conducted at the Sukari Gold Mine in Egypt — and with guidance from experienced geotechnical engineers on-site — I worked on assessing the stability of crown pillars, which serve as the rock mass separating surface and underground mining levels.
The assessment involved:
Rock mass classification using the Q-system
Analysis of joint conditions, RQD, groundwater, and stress environment
Evaluation of safety using stability charts and Factor of Safety calculations
Poorly designed crown pillars can lead to hazards such as instability, overbreak, or ore dilution due to unplanned rock mass movement — directly impacting both safety and production efficiency.
This experience emphasized the importance of turning geological data into engineering decisions that protect people, equipment, and long-term operations.
Problem Statement:
A batch of parts was rejected due to an oversized hole diameter.
5-Why Analysis:
1.Why was the batch rejected?→ Because the hole diameter was larger than the specified tolerance.
2.Why was the hole diameter too large?→ Because the drilling machine was not properly adjusted.
3.Why was the machine not properly adjusted?→ Because the operator used an outdated setup sheet.
4.Why did the operator use an outdated setup sheet?→ Because the latest revision was not available at the machine.
5.Why was the latest revision not available at the machine?→ Because there is no system in place to ensure controlled document distribution.
Root Cause:
No document control system for distributing updated setup sheets.
Corrective Actions:
•Introduce a document control procedure to issue and display the latest revision only.
•Restrict access to outdated setup sheets by removing old versions from machines.
•Train machine operators and line leaders on verifying document revision before setup.
Preventive Measures:
•Digitize all setup sheets with access through a centralized network folder or MES (Manufacturing Execution System).
•Implement revision control logs with sign-off for updates and acknowledgments by operators.
•Conduct regular audits on setup documents at workstations.
•Establish standard work that includes a revision check step before every job setup.
•Integrate barcode or QR code scanning to verify correct document versions at machines.
OSHA provides a comprehensive framework of exposure limits, design standards, and operational guidelines to minimize risk in workplaces across industries.
From permissible noise levels (90 dB(A) over 8 hrs), to chemical exposure limits (e.g., Silica – 50 µg/m³ TWA), and safe oxygen ranges (19.5%–23.5%), these limits are non-negotiable foundations of workplace safety.
📊 Adhering to OSHA's safety parameters ensures:
✔️ Reduced occupational health risks
✔️ Legal compliance and audit readiness
✔️ Safer, more productive work environments
In the twenty-first century, there has been a growing awareness of the fundamental role global mineral resources play in driving technological advancement, especially within the context of the clean energy transition.
This transition involves gradually replacing traditional fossil fuel–based sources such as oil, natural gas, and coal with renewable and low- and zero-CO2 technologies such as electric vehicles, storage batteries, wind turbines, and solar panels. Mineral resources are essential for sustaining the production of materials needed for these technologies and energy storage systems. Thus, the conversion from fossil fuels to low-carbon energy sources will depend on minerals.
From a historical perspective, energy transitions require significant mineral resources and can vary greatly in speed, ranging from century-long transformations to shifts occurring within a few years.
As an example, three centuries ago the number of elements used in energy technology such as windmills was limited to less than five (Figure 1). The array of elements used in energy applications has grown significantly since the 1800s, first due to the invention of the steam engine during the industrial revolution and then by the development of the combustion engine and in the mid-twentieth century the initiation of the nuclear era. But it is since the 2000s that the number of elements used in technology has increased exponentially, with low-carbon energy technology materials requiring a great diversity of chemical elements (Figure 1). Today, the element diversity is prevalent across most products and applications. For instance, of the 83 stable elements in the periodic table, at least 70 of them can be found in smartphones, and a similar number can be found in electric vehicles.
Critical minerals—essential for modern economies and emerging technologies and often subject to supply constraints—emerge as a crucial component for sustainable development and supply chain stability. These resources, mainly metals, have become the backbone of various twenty-first-century industries including electronics, telecommunications, renewable energy, and transportation, making their consistent supply key for societal advancement. At the forefront of reducing carbon emissions and mitigating the effects of climate change are electric and hybrid vehicles, photovoltaic cells, wind turbines, batteries, and efficient lighting. These technologies are driving a growing global demand for energy-related critical minerals. This review centers on critical minerals. Due to the broadness of the topic, our focus is set on the energy-related metals copper, cobalt, nickel, lithium, and rare earth elements (REE). We focus on these elements because they are essential for renewable energy technologies and will drive exploration efforts during this century. We start by defining critical elements and minerals and their importance to the energy transition. We then describe their global occurrence, distribution, and ore deposit types, highlighting the role of economic geology and the minerals industry in sustaining a supply chain for the energy transition. This contribution complements other available reviews that further elaborate on various environmental, metallurgical, economic, and geopolitical aspects of critical minerals (see the sidebar titled Mineral Resources Sustain Infrastructure, Economy, and Life)
Source: https://www.annualreviews.org/content/journals/10.1146/annurev-earth-040523-023316
Artificial intelligence (AI), the capability of computational systems to perform tasks typically associated with human intelligence, is without question one of the most far-reaching and impactful technological developments of the 21st century. From chatbots, online shopping recommendations and financial risk assessment to analysis of customer data, artificial intelligence is a game-changer for industries large and small.
One industry rarely associated with artificial intelligence is mining; yet the nexus between AI and this industry—especially for Latin America—deserves increased attention, given its profound impact in both developed and emerging markets. For example, AI is capable of analyzing large amounts of data and providing digital solutions for businesses, with the technology helping to increase speed and safety in mining operations
Mining is the backbone of the natural resources sector in Latin America with Chile, Peru, Brazil and Mexico the dominant players. The mining sector produces revenue exceeding $110 billion, accounting for 21% of the global base metal mining market, with copper, iron ore, and gold leading the way.
The positive impacts of AI on the mining sector are threefold. First there is increased efficiency and cost reduction. AI-driven systems can predict when mining equipment will fail, reducing downtime and maintenance costs. For example, Rio Tinto, the British-Australian multinational, uses AI to monitor its fleet of autonomous haul trucks, reducing maintenance costs by up to 15%. Second is the factor of improved safety. AI can analyze environmental conditions to detect risks such as gas leaks, rockfalls, and structural failures. Take Newmont Goldcorp. The firm uses AI in underground mines to monitor for hazardous conditions. Finally, there is the impact of enhanced sustainability and compliance. AI improves ore detection and sorting, reducing waste and environmental impact. A good example is TOMRA’s AI-based ore sorting technology reduces water and energy usage in mines by 30%.
Recognizably, AI also produces negative impacts in mining. High costs and barriers to adoption immediately come to mind. AI systems require significant upfront investment in hardware, software, and training. For example, the estimated cost of AI-powered autonomous truck fleets is $5 million–$10 million per vehicle. Another downside is workforce displacement. AI-driven automation reduces the need for human labor, particularly in routine mining jobs. In the case of Fortescue Metals Group’s transition to autonomous trucks, the company eliminated over 1,000 jobs in Australia. Many of the remaining workers needed to be reskilled. In general, workers must be retrained to manage AI-based systems, but many companies lack training programs. Also, of increasing concern surrounding AI are data privacy and cybersecurity risks. AI systems in mining operations are potential targets for cyberattacks, which could disrupt production. Three years ago a cyberattack on a mining company in Canada temporarily shut down operations. Not to be overlooked are ethical concerns enveloping AI. AI-driven decision-making in resource allocation and environmental compliance can raise ethical issues if not properly regulated.
At a country level, Colombia provides an excellent case of AI applications. For example, wearable devices integrated with AI can monitor the health and safety of miners; and AI can be employed for the early prediction of potential methane explosions in underground coal mines. The 2021 explosion of the Tópaga mine, where 12 miners lost their lives, was reconstructed using AI with evidence revealing that the use of individual methane detectors could have displayed data alerting miners to potential risks.
An increasing number of mining companies in Colombia are embracing AI. Drummond, one of Colombia’s largest coal producers, is using AI to enhance operational efficiency and safety. The company has been incorporating AI in predictive maintenance for mining equipment and optimizing the coal extraction process. Cerrejón, a major coal mining company in Colombia, has been experimenting with AI technologies to improve resource extraction efficiency and sustainability. And EPM (Empresas Públicas de Medellín), a Colombian energy and mining company, has implemented AI solutions in their mining operations, particularly in their hydroelectric and mineral extraction projects. The widest use of AI is for predictive maintenance, equipment monitoring, and operational optimization.
What does the future hold for AI in the mining industry—for Latin America and beyond? As infrastructure improves, more mines in Africa, Latin America, and Asia will adopt AI to enhance efficiency and safety. Companies will use AI to discover new mineral deposits, reducing exploration costs by up to 50%. For example, GoldSpot Discoveries uses AI to identify gold deposits with high accuracy. We can also expect government to push AI-driven sustainability solutions to reduce mining’s environmental footprint; and more sophisticated AI-driven robots will handle complex mining tasks in hazardous environments.
In essence, AI will continue to revolutionize the mining industry, enhancing efficiency, safety, and sustainability by automating tasks, optimizing operations, and improving decision-making through data analysis and predictive analytics. By 2035, AI is expected to generate over $100 billion in efficiency gains for the mining sector, with developed markets leading in automation and emerging markets catching up through AI-driven exploration and ore processing innovations. In resource-rich regions like Latin America, mining firms like Glencore, Zijin Mining Group, BHP, and AngloGold Ashanti are well-positioned to harness AI to the benefit of their shareholders and the public at large.
___________________________________________________________________________________________________
Jerry Haar is a professor of international business at Florida International University. He is also a fellow of the Woodrow Wilson International Center for Scholars in Washington, D.C., and the Council on Competitiveness. Eva Cristina Manotas R. is dean of the School of Mines and Full Professor at Universidad Nacional de Colombia. (This article first appeared in Latin Trade on March 31, 2025).
Source: Credit to Jerry Haar and Eva Cristina Manotas R.
This comprehensive guide explores the complexities and innovations involved in designing and planning underground mining projects. With surface resources declining and environmental standards tightening, underground mining is becoming the preferred method—expected to surpass 55% of global production by 2025.
Key themes include:
Fundamentals of Underground Mining: Emphasizes tailored designs for each deposit, with a focus on maximizing mineral recovery and minimizing waste and environmental impact.
Modern Design Principles: Moves away from rigid, deterministic models to flexible, scenario-based planning using advanced 3D tools and sensitivity analysis, improving efficiency and profitability.
Challenges and Opportunities: Covers critical issues like geomechanical stability, access design, ventilation, dilution, and recovery. It highlights the growing role of backfilling and real-time data in managing risks and improving sustainability.
Software Integration: Critiques the fragmented nature of current tools and calls for fully integrated systems to support smarter decision-making and streamline operations.
Method Selection and Optimization: Offers frameworks (like the Nicholas and UBC methods) for choosing mining methods and optimizing stope design, production schedules, and infrastructure.
Access and Infrastructure: Details criteria for shafts, ramps, and galleries, and their role in supporting safe, efficient, and flexible mine development.
Sustainability and Closure: Emphasizes the need for early planning of mine closure, using proven technologies and designs that support long-term environmental and economic sustainability.
Overall, the document promotes a forward-thinking approach to underground mine design, combining technical rigor with strategic adaptability.
Ever wondered how smart investors pick winning stocks?
They use stock market ratios – simple calculations that reveal a company's health. Let's break down the most useful ones.
𝗘𝗮𝗿𝗻𝗶𝗻𝗴𝘀 𝗥𝗮𝘁𝗶𝗼𝘀
The Price-to-Earnings (P/E) ratio shows how much you're paying for each dollar of profit. A high P/E might mean investors expect growth, but it could also signal an overvalued stock.
The Earnings Per Share (EPS) tells you the profit allocated to each share. Rising EPS usually means the company is growing.
Why they matter: These ratios help you avoid overpaying for stocks. Think of them as the price tag checker of investing.
𝗟𝗲𝘃𝗲𝗿𝗮𝗴𝗲 𝗥𝗮𝘁𝗶𝗼𝘀
The Debt-to-Equity ratio reveals how much a company relies on borrowing versus owner funding. Lower is generally safer.
The Interest Coverage ratio shows how easily a company can pay its debt interest from its earnings.
Why they matter: They're like checking someone's credit score before lending them money. High debt can sink even profitable companies during tough times.
𝗥𝗲𝘁𝘂𝗿𝗻 𝗥𝗮𝘁𝗶𝗼𝘀
Return on Equity (ROE) measures profit generated from shareholder investment. A higher ROE means better use of investor money.
Return on Assets (ROA) shows how well a company uses its assets to make profit.
Why they matter: These ratios reveal management efficiency. Good managers create more value from the same resources.
𝗠𝗮𝗿𝗸𝗲𝘁 𝗥𝗮𝘁𝗶𝗼𝘀
The Price-to-Cash Flow (P/CF) ratio compares a stock's market price to its cash flow. A lower ratio might signal an undervalued company.
PEG ratio shows your value based on the P/E ratio and earnings growth rate.
Why they matter: They help you compare value across different companies and find income-generating investments.
𝗣𝘂𝘁𝘁𝗶𝗻𝗴 𝗜𝘁 𝗔𝗹𝗹 𝗧𝗼𝗴𝗲𝘁𝗵𝗲𝗿
No single ratio tells the whole story. Smart investors use combinations of ratios.
For example, a stock with low P/E, low debt, high ROE, and good dividend yield could be a hidden gem.
These ratios aren't crystal balls, but they are powerful tools.
They turn complex financial statements into simple numbers you can use to make better decisions. Start using them in your research, and you'll see the market in a whole new way.
Don’t just track savings if you want top procurement
I’d do this instead...
Track metrics that align with your business goals.
Group the KPIs for better decision-making:
➝ Quality KPIs – To assess supplier performance.
➡️ Compliance rate, Supplier defect rate, Purchase order accuracy
➝ Inventory KPIs – To assess effective order management
➡️ Inventory turnover ratio, Inventory carrying cost, Inventory aging
➝ Cost-Saving KPIs – Evaluate procurement's level of impact
➡️ Cost avoidance, Procurement ROI, Spend under management, Cost reduction
➝ Delivery KPIs – To assess a reliable supply chain
➡️ Vendor availability, Purchase order cycle time, Supplier lead times
Most Procurement teams only track two or three of these metrics and then struggle to improve YOY or even to justify their value
Doing a detailed review of underground stope drill and blast performance can easily identify the main factors behind stope performances against designs. It is critical to review both technical and operational drill & blast aspects, identify issues and provide recommendations however it's more better to implement the recommendations to see improvements in the stope recovery.
Below is a detailed stope drill and blast review I did and the summary and recommendations provided. Simple things that add up to an overall stope performance.
________________________________________________________________________
SUMMARY:
• From the reviews done so far there is minimal to no issues identified in the technical design perspective in terms of drill and blast design parameters.
• Void ratio was tight with 0.955 against site specific 0.95 after applying 30% swell factor.
• From the LPU data, 5 slot holes were significantly undercharged. Prep returns & Simba cleanout plods show that these holes were prepped. There is possibility of slot bridge or significant slot underbreak expected as we do not have a breakthrough void yet at this stage.
• Logger data and charge returns show that the correct number of dets were charged with correct delays assigned and correct number of primers charged as per the plan. There is no return to show that the primers were staggered as per the charge plan.
• Total of 15.7t emulsion used. 14.8t emulsion charged into blast holes against a design of 14.2t.
RECOMMENDATIONS:
1. D&B Engineers to check new void ratio using the CMS after undercuts taken to see if the downhole shot will be accommodated by the usable voids available.
2. D&B Engineers to notify slot location and the slot holes to the charge crews and stick to the approved charge plan.
3. Charge crews must be aware of how critical the slot is and notify engineers of any issues confronted during charging and assigning delays to the slot holes. This also includes other blast holes.
4. D&B Engineers to check LPU Data to make sure charging was done according to the charge plan issued.
5. LPU Operator to use LPU Hole ID same as Design Hole ID during charging to make it easier to compare ascharged LPU data against design data.
6. Shots greater than 20m height to be left for at least 3 hours (3hrs to confirm?) after charging to allow gasing of emulsion to the designed uncharged collars.
7. D&B Engineers to maintain reviewing of prep returns prior to finalizing charge plans.
Opening a new mine or expanding an existing operation can be a challenging and daunting task. Aside from assessing and evaluating social-environmental concerns and designing the mining and material movement approach, the first question often asked is, "how much will it cost us to mine?" This may need to be determined even before you decide that there is a potential project. Mine cost estimation may be done at many levels. At first it may be a simple “back of the envelope” estimation using similar operations to benchmark against. Later it may be decided to use an existing mine that the company owns and factor and compare costs against them. In the final stages a detailed bottom-up estimation based on first principles may be completed.
This paper will investigate common methodologies of estimating operating costs for mines and present examples from actual operations and why those methods were selected. It will highlight why some methods are superior to others. Finally, we will explore the potential pit falls in cost estimation that often occur and the opportunities that may exist to lower mine costs.
Source: Credit to: Gary Poxleitner - SRK Consulting
**Introduction**
Blasting is an essential operation in surface mining that impacts productivity, safety, and environmental factors. To improve the quality of blasting, it is important to focus on optimizing design, minimizing adverse effects, and ensuring safety. This report outlines key strategies for enhancing blasting efficiency and effectiveness in surface mines.
**Key Areas for Improvement**
1. **Blast Design Optimization**
- **Hole Layout and Spacing**: Properly spacing and designing blast holes ensures optimal fragmentation and avoids inefficient or dangerous outcomes. This can be achieved by tailoring the blast design to the rock type and the mining objectives.
- **Explosive Type and Quantity**: Using the right type of explosives and correct charge amounts helps to achieve the desired rock breakage while controlling costs and minimizing environmental impact.
- **Timing and Detonation**: Employing advanced delay and electronic detonators can control the blast energy distribution, improving fragmentation and reducing unwanted side effects like excessive vibration.
2. **Fragmentation Control**
- **Achieving Optimal Fragment Size**: Ensuring that the fragmentation is neither too fine nor too coarse enhances downstream processing, like crushing, and reduces operational costs.
- **Real-time Monitoring**: Using tools like drones or laser scanners to measure blast outcomes helps fine-tune future designs and achieve better fragmentation consistency.
3. **Vibration and Environmental Control**
- **Vibration Monitoring**: Installing seismographs to monitor ground vibrations ensures that they remain within safe limits, preventing damage to infrastructure and minimizing disturbances.
- **Dust and Flyrock Mitigation**: Using dust suppressants, blast mats, or other containment measures helps to minimize environmental and safety risks associated with flyrock and airborne particles.
4. **Safety and Training**
- **Employee Training**: Continuous training on safety protocols, proper blast design, and the use of new technologies ensures a safer and more efficient operation.
- **Clear Communication and PPE**: Ensuring workers are equipped with the proper protective equipment and have clear communication regarding blast schedules is crucial for minimizing accidents.
**Conclusion**
Improving blasting quality in surface mines requires optimizing blast design, using advanced technologies, and focusing on safety and environmental considerations. By integrating better blast design practices, real-time monitoring, and effective mitigation techniques, mines can enhance productivity, reduce costs, and ensure a safer working environment. Regular training and feedback loops are key to ongoing improvements in blasting operations.
Before we move on to 2D estimation, one important step is to understand the behavior of thickness, grade, and accumulation. Do they exhibit spatial correlation? One way to assess this is by comparing them using a swath plot.
Below is a swath plot we generated using Spyder (Python), which I’ll be sharing in my class this August.
Looking at this figure — what are your thoughts?
Do you see a correlation between the variables?
Do you think applying 2D estimation is necessary?
Hoy quiero hablar de un concepto fundamental que impacta directamente en la planificación, costes y ejecución de nuestros proyectos: los Volúmenes Aparentes.
Sabemos que 1 m³ de material in situ (en su estado natural) rara vez ocupa el mismo volumen una vez excavado, transportado o compactado. ¡Comprender estas variaciones es crucial!
Tomando como base 1.0 el volumen del material in situ:
1️⃣ EXCAVACIÓN / VOLADURA:
Tierras: Al excavar, el suelo se suelta y sufre un esponjamiento. Su volumen aumenta, pasando de 1.0 a aproximadamente 1.20 - 1.30.
Roca (Canteras): Tras la voladura, la fragmentación es mayor. El volumen puede incrementarse significativamente, ¡llegando a 2.0 respecto al banco original!
2️⃣ CARGA Y TRANSPORTE:
El material mantiene o incluso ajusta ligeramente su volumen esponjado.
Tierras cargadas/transportadas: Se mantienen en el rango de 1.20 - 1.30.
Roca volada cargada/transportada: El volumen puede ser de 1.25 - 1.50 (ya algo asentada respecto al momento justo post-voladura).
3️⃣ PROCESOS FINALES:
RELLENOS Y COMPACTACIÓN (Tierras):
Vertida (Rellenos sin compactar): Al descargar, el material se asienta un poco, situándose en 1.10 - 1.20.
Pisada/Pre-compactada: Un primer paso de compactación lo lleva a 1.0 - 1.10.
Compactada: Con la maquinaria adecuada, buscamos reducir vacíos y aumentar la densidad. El volumen final puede ser 0.95 - 1.0, ¡incluso ligeramente inferior al original si la compactación es muy eficiente!
CHANCADO/TRITURACIÓN (Rocas):
Chancado Primario: La roca procesada aún presenta un volumen superior al original en banco, alrededor de 1.30 - 1.40.
Trituración (Fina): El producto final triturado sigue teniendo un volumen aparente mayor al in-situ, típicamente 1.20 - 1.30.
¿Por qué es vital este conocimiento?
📊 Cálculo de volúmenes: Para saber cuántos viajes de camión se necesitan.
💰 Estimación de costes: Afecta directamente los costes de excavación, transporte y disposición.
🛠️ Selección de maquinaria: El volumen real a manejar influye en la capacidad de los equipos.
📈 Planificación de obra: Optimiza los espacios de acopio y la secuencia de trabajos.
Conocer y aplicar correctamente los factores de esponjamiento y compactación es un pilar para el éxito y la rentabilidad de nuestros proyectos.
Love this Periodic Table of Mining Careers - shows the diverse opportunities available to those that pursue a career in mining.
Once again, we are proud to have our Next Generation Student program at Resourcing Tomorrow. If you are a student and would like to attend on a complimentary basis, or are a lecturer on course that has a relationship to mining (earth sciences, engineering, physical sciences, computer sciences, health & safety, finance, environment, social impact etc etc) please drop me a message or see the link below for more details
https://resourcingtomorrow.com/nextgen
More and more people are discussing what constitutes a deep mine. Logically, many focus on depth below ground surface. But depth is just one aspect to consider and, as a surprise to many, not the dominant factor. Two of the more important aspects to consider are:
(1) in situ stress state which varies globally ranging from conditions where the major principal stress is vertical to where the major principal stress is horizontal and multiples in magnitude of the vertical stress. For example, stresses in and around Pennsylvania can have horizontal to vertical stress ratios >4.
a. Example 4000m depth where the major principal stress is vertical (e.g., deepest UG mine in South Africa is ~4000m) would have a Sigma 1 ~108MPa.
b. Example 2000m depth where the major principal stress is horizontal and 2 times the vertical would also have a Sigma 1 ~108MPa. Both cases assuming 0.027MPa/m for vertical stress gradient.
(2) If you couple the in situ stress state (for which depth is a variable) with intact rock strength, you have the makings of a parameter (the Stress Level Index, e.g., Kaiser et al 2000) that is valuable for defining deep mining conditions.
The stress Level Index (SLI) relates the induced maximum stress (σmax) around an equivalent circular excavation in elastic rock to the rock’s intact compressive strength (σc), where σmax = 3σ1 – σ3 (with σ1 and σ3 representing the major and minor principal stress in the vicinity of the tunnel in the plane perpendicular to the tunnel axis). By benchmarking the SLI to real conditions (from these and more…Wilson 1971, Barton et al. 1974, Wiseman 1978; 1979, Hoek and Brown 1980a, Stacey and Page 1984, Jager et al. 1990, Kaiser et al. 1996, Board and Brummer 1997, Brummer 1998, and Martin et al. 1999, amongst others) you find:
- Spalling initiates at σmax/σc= 0.3-0.5 (which corresponds with the unconfined rock mass strength near the excavation wall)
- Notch formation with deep spalling (>20% of tunnel radius) and potentially minor strainbursting (spitting and popping) is to be expected for σmax/σc>0.5 to 0.6
- Moderate strainbursting and-or deep spalling at σmax/σc>0.6 to 0.8
- Major strainbursting and-or deep spalling at σmax/σc>0.8
This allows for a meaningful relative assessment of stressed ground challenges. In Figure 1, I have plotted my operating mine and project experience for cases available in the public domain to show the value of looking at SLI vs depth. One can quickly see that depth is not the driving factor and that it is a combination of in situ stress and intact rock strength. These plots are for the in situ stress before mining but induced stress at different times of mining can be used to assess SLI as well and see how it changes over a mine’s life.
Furthermore, in the past, Sigma 1 / UCS was used as a stressed ground indicator. I argue that SLI is more valuable. When the same data is plotted with S1/UCS (Figure 2), there is limited range in the results reducing decision making potential. One of the reasons for this is the importance of the other principal stresses in assessing when deep mining challenges could be expected.
Blasting isn’t just a science—it’s an art that tests you in the field.
Even with perfect calculations, things go wrong. But a skilled engineer? He plans for those moments.
Here are 5 of the most common blasting issues—and how to solve them smartly and safely:
⸻
🔹 1️⃣ Misfires – The Silent Threat
A hole fails to detonate.
It’s not just a delay—it’s a danger.
🚩 Causes: Faulty connections, wet explosives, poor initiation
✅ Fix:
• Always double-check connections
• Use reliable detonators
• Respect re-entry wait times
• Conduct post-blast inspections, every time
⸻
🔹 2️⃣ Flyrock – The Uninvited Guest
Rock fragments flying beyond control. One of the most hazardous outcomes.
🚩 Causes: Shallow holes, weak stemming, poor burden
✅ Fix:
• Use proper stemming materials
• Increase burden & spacing
• Always apply blast mats near infrastructure
⸻
🔹 3️⃣ Poor Fragmentation – Big Boulders or Fine Dust
Bad fragmentation = high costs, unsafe loading, more secondary blasting.
🚩 Causes: Wrong charge, bad pattern design, uneven explosive loading
✅ Fix:
• Optimize burden and spacing
• Match explosive energy to rock strength
• Ensure uniform loading and good stemming
⸻
🔹 4️⃣ Excessive Ground Vibration – The Hidden Risk
It can shake buildings, crack structures, and ruin your reputation.
🚩 Causes: High MIC, tight delays, sensitive ground
✅ Fix:
• Reduce Maximum Instantaneous Charge
• Increase delay timing
• Move the blast farther from structures
⸻
🔹 5️⃣ Overbreak / Backbreak – Losing Control at the Edges
Fracturing beyond your final walls or benches? That’s wasted effort and safety compromised.
🚩 Causes: High edge charge, poor delays, no buffer holes
✅ Fix:
• Use pre-split or buffer rows
• Reduce charge near final walls
• Apply proper timing between holes
⸻
📌 Pro Engineer Mindset:
Real improvement starts with analyzing every blast, learning from the field—not just the theory.
🔍 Drone imaging, blast software, vibration monitoring—it’s not luxury anymore, it’s smart engineering.
⸻
💡 Field Pro Tip:
If you’re near villages, roads, or weak geology—triple-check your plan.
A small mistake here can cost your whole project.
⸻
🔜 Next Up in the Series:
✅ Lesson 8: Real Blast Pattern Breakdown – A Full Case Study
✅ Lesson 9: Drilling & Loading – Best Practices from the Field
As a Mine Plan Engineer in the nickel mining, especially in mining contractor, one of my core responsibilities is ensuring that all operational activities to run efficiently, safely, and sustainably.
In this discussion session, I collaborated with production team to analyze our fuel ratio. While it may seem like a purely technical metric, this number serves as a key indicator of our equipment's performance and operational efficiency in the pit.
To reduce fuel ratio and improve hauling performance, we focused on several measurable indicators, including:
✅ Grade Optimization – Reducing grade of road where possible to minimize engine load.
✅ Rolling Resistance Management – Ensuring regular road maintenance (watering, grading, compacting) to reduce energy loss.
✅ Cycle Time Analysis – Evaluating loading, travel, and dumping times to minimize idle time and improve cycle efficiency.
✅ Payload Management – Monitoring truck loading to avoid underloading or overloading, which both negatively affect fuel usage.
✅ Speed & Gear Utilization – Ensuring proper driving behavior to match road profiles with the most fuel-efficient gear and speed settings.
✅ Refueling & Staging Strategy – Reducing unproductive travel by strategically locating fuel stations and optimizing standby areas.
Fuel ratio optimization is not only about cost control, it's also a part of our strategy to support energy sustainability and reduce the carbon footprint of our mining operations. We reviewed historical data, current field conditions, and identified potential areas for improvement. Such as route optimization, cycle time efficiency, and equipment utilization strategies.
Cross functional discussions like these are essential. Challenges in the field are rarely solved alone. They require team collaboration, open communication, and a shared understanding of the company’s long term goals.
💡 Mining smarter, not just harder.
Source: Credit to Muhammad Dwitri Candika Indrawan
To ensure continuous excavator operation with no idle time, the required number of dump trucks must be calculated using:
Rule of thumb
Number of Trucks = Truck Cycle Time ÷ Excavator Loading Time
Example:
Truck cycle time = 8 minutes
Excavator loading time = 2 minutes
→ 8 ÷ 2 = 4 trucks (theoretical)
However, real-world operations involve delays:
-Dumping queue
-Road conditions
-Minor inefficiencies
That's why we always add a buffer truck to avoid excavator downtime.
So in this case: 5 trucks would be required in practice.
Proper fleet balance ensures higher productivity and reduces fuel waste and idle time.
The Real Risk for Resource-Rich Nations Isn’t a Lack of Minerals It’s a Lack of Vision
In mining, the greatest threat isn’t depletion.
It’s moral erosion.
Across many resource-rich nations, the same pattern repeats:
A few powerful actors prioritize personal gain, signing unfavorable deals that benefit their circle while the broader population is left behind.
Let’s be clear: international companies aren’t the villains.
They pursue profit that’s business.
The failure lies in governments that undervalue and mismanage their own wealth.
Mineral abundance is only an advantage with the right governance.
Otherwise, it turns into a liability.
Natural wealth isn’t just underground.
It lives in contracts, institutions, and decision-maker integrity.
Small Deposits Are Not Small Opportunities
Global investors chase mega-projects while overlooking smaller, more agile deposits full of untapped value.
Many smaller asset holders can’t reach real investors.
They end up with intermediaries who take control, while the original owners lose value and voice.
This isn’t just a Mongolian issue it’s common in many developing nations, where policy ignores mid-tier assets despite their potential.
A Forecast: The Era of Small Deposits Is Coming
Large deposits bring regulatory delays and political risks.
Smaller ones offer faster timelines, lower complexity, and local upside if linked to the right investment frameworks.
By 2040, mineral development will likely shift toward distributed value:
many small, connected projects, not just one big mine.
Mongolia Is Well Positioned
Mongolia has more than large reserves.
Its geology is rich in high-grade, small to mid-sized deposits.
What’s missing is a platform that connects them to serious investment.
=> Conclusion
Small deposits are not small opportunities.
Only small thinking makes them so.
The value of a resource depends not on its volume but on how, by whom, and under what terms it’s managed.
=> Call to Action
To governments: Support mid-sized deposits not just the giants.
To investors: Don’t ignore smaller assets.
To owners: Know your value. Don’t trade it for short-term deals.
Mining victory comes not from what’s underground but from how wisely it’s brought to the surface.
https://www.linkedin.com/in/temuujin-gankhuyag-9a0369360/
In mining projects, determining the value of ore is based not only on what is extractable, but also on what is economically worth extracting. At this point, two basic concepts come into play: Grade and Cut-Off Grade.
🟢 Grade: It is the proportion of precious metal contained in an ore. This rate; In ore analysis, it is specified in grams per ton (g/t) or percentage (%).
Examples:
• 4 grams of gold → 4 g/t Au in 1 ton of ore
• 1.8% copper → 1.8% Cu in 1 ton of ore
🟠 Cut-Off Grade: It is the minimum metal ratio that the ore must have in order to be put into operation. This value; Metal prices are calculated based on production costs, enrichment yield, and even future economic projections.
🖊️ Simply:
• Grade = How much precious metal is in the ore?
• Cut-Off Grade = Is that ratio valuable enough to operate?
When grade and cut-off grade are evaluated together, it reveals whether the mining operation will be economically sustainable. Therefore, it is imperative that engineers who are responsible for strategic decision-making in mining systematically evaluate laboratory data together with economic parameters.
In this series, I not only define technical concepts, but also cover them in plain language, along with their place in the industry. We hope to make small but solid contributions to both students and engineers working in the field...
90% of companies stall before they scale.
Not because the market shifted.
Not because the team isn’t capable.
And definitely not because of a lack of vision.
They stall because their operations can’t keep up with their growth.
I’ve seen it over and over.
The CEO is still making too many decisions.
Processes live in people’s heads.
Everyone’s working hard, but execution is inconsistent.
So the team starts spinning.
Firefighting replaces focus.
And big goals turn into reactive checklists.
When that happens, the fix isn’t more hustle.
It’s operational discipline.
But here’s the part most people miss:
Operational excellence isn’t one big change.
It’s a layered process. Built step by step.
You start with standardization.
Create one clear way to do the work. No more “everyone has their own method.”
Then you move to automation.
Eliminate repetitive tasks. Free up time for deeper work.
Next comes measurement.
Track the right numbers. Make them visible. Let the data guide your decisions.
Then, layer in continuous improvement.
Small weekly fixes. Fast iterations. Constant learning.
Only then are you ready for real innovation.
Not chaos disguised as creativity. Bold ideas that stick, scale, and move the business forward.
This isn’t a theory.
It’s how strong, sustainable companies actually scale.
From startups to 8-figure teams, the pattern is the same.
Build the layers in order.
Tighten the engine before you step on the gas.
📊 When designing the Final Pit for a Narrow Vein Gold Deposit during PFS, precision is crucial—especially when balancing ore recovery and waste management. The results from our comparison of the Final Pit Design versus Optimized Pitshell show how the AutoPit Design tool ensures optimal outcomes. Here’s what we found:
💪 Complete Recovery of High-Grade Ore:
In that example, comparing the Optimised shell evaluation the APD allowed us to recover 100% of the high-grade ore, ensuring maximum profitability from the richest parts of the deposit.
📈 Increased Total Ore by 2%:
Thanks to AutoPit’s optimized design process, we captured an additional 2% total ore, enhancing the overall project economics. The increase came at a slight marginal ore grade decrease of 0.02 g/t, a trade-off well worth the gain in ore volume!
🛠️ 5% Incremental Waste Added:
While achieving better ore recovery, we also managed an additional 5% waste—a small price to pay for the significant boost in ore and complete high-grade extraction.
🚀 Why Choose AutoPit for Your Gold Projects?
Efficiency: AutoPit eliminates the guesswork and manual effort, delivering optimized designs that help maximize ore recovery while managing waste effectively.
Accuracy: Tailored designs for even the most complex narrow vein deposits, ensuring precision every step of the way.
Profitability: With optimized pit designs, you ensure the highest return on investment by recovering more ore and mitigating waste.
In the context of mining value chain optimization, specifically Mine-to-Mill (M2M), an expensive day in blasting can translate into a highly profitable day for the entire value chain. Now, lets "assume", we do a great job at the operational level and manage to sustain it over the Life-of-Mine (LOM).
QUESTION: What impact can poor Strategic (Long-Term) Mine Planning, or 'SMP,' have on an operation's profitability over the Life-of-Mine (LOM)?
A poorly developed SMP featuring sub-optimal pit limit, COGs, mining direction, pushbacks and production schedules can result in hundreds of millions of dollars lost over the LOM. This means that decisions about what to mine, how to mine it, and when to mine each block are far more critical to overall value realization than downstream performance in blasting, loading and hauling, milling, or flotation alone.
If we fail at the Strategic Mine Planning stage, no matter how much is invested in metallurgical characterization, how well we do Drill & Blast, how intensively Mine-to-Mill optimization campaigns are conducted, or what new technologies are applied to enhance process plant KPIs; it won’t be enough. That is, the value loss resulting from poor upstream strategic decisions can rarely, IF EVER, be fully recovered. That is, an operation can’t optimize its way out of a flawed Strategic Mine Plan and unfortunately all the hard work and downstream investments can be completely undermined by poor LOM decisions.
So, we should get the big decisions right first; a flawed mine plan ruins everything downstream.
Source: Credit to Farhad FARAMARZI, Technical Lead at GEOVIA
In 2019, Benchmark’s Simon Moores told the US Senate, “we are in the midst of a global battery arms race.”
Critical mineral mining and refining was emphasised as a key battleground in this race, with Moores saying “those that control these supply chains will hold the balance of industrial power for the 21st century in the auto and energy industries.”
Especially in critical mineral refining, this balance of power is heavily skewed towards China due to the scale of investment at this critical point in the supply chain.
How has China’s dominance evolved since Moores’ speech? Are other countries gaining market share in the upstream? And, is the US still a “bystander” as Moores said in 2019?
China gains ground domestically and internationally
Critical mineral supply chains are highly-concentrated within China. This trend has only continued since 2018, with China gaining ground in several minerals.
For example, China accounted for 12% of global lithium mining in 2019, rising to 21% in 2025 thanks to the development of mica mines. Its share of lithium refining, too, has increased.
One area in which domestic production has lost significant market share is nickel refining, in which the country dropped 16 percentage points between 2019 and 2025, partly due to Indonesia banning nickel ore exports.
In response, China invested heavily in Indonesia’s nickel sector.
In 2018, Indonesia accounted for 13% of refined nickel production.
As of 2025, this has risen to 62%, of which 80% is Chinese-owned.
China has also invested heavily in cobalt mines in the Democratic Republic of the Congo.
Chinese-owned cobalt mines in the DRC account for 50% of global cobalt supply in 2025.
Is the US still a bystander?
Across battery raw material markets, the US accounts for just 0–2% of global mined and refined supply.
However, a US success story can be found in rare earths, a key family of elements for electric vehicle motors and defence applications.
In 2018, the US had no mined or refined production of these minerals. However, as of 2025 the US now has an 11% market share in their mining and a 6% share in their refining on a total rare earth oxide basis.
UC, and its better-looking friend Local UC, provide estimation of G-T curves by SMU into larger panels for recoverable resources at several CoGs. LUC assigns local values based on OK ranking to get spatial quality within a panel. Advantages include probability and mean local grade in areas of wide spaced data (assuming spatial continuity of course). This non-linear method works well for large, continuous and consistent geology such as broad stratigraphic deposits (i.e. iron ore, bauxite, coal, brine, etc.) with wide-spaced data.
Pitfalls of UC is that it does not provide local estimates. It will return a G-T but if you don’t know where the good stuff (> CoG) is within that panel, what’s the point? LUC helps but the estimator must be careful because Mother Nature does not like consistency like geostatisticians may assume. One pesky fault, a change in weathering/alteration, or something else will negate the assumptions of stationarity along with poor variography. In early days projects, LUC is fantastic but check for cooperative geology/domains before simply applying this method. Happy Friday!
The request for information (RFI) or request for quotation (RFQ) process is an essential part of procurement management in order to make informed decisions about potential suppliers. An RFI is used to gather information about potential suppliers and their capabilities, while an RFQ is a concrete request for quotation (a solution proposal and a price).
The first step of the RFI is to identify the company's internal requirements. This includes clarifying the required information, such as specific characteristics, quantities and delivery times. An RFI document is then created that clearly defines the background, specific questions and desired response formats. This is followed by the selection of potential suppliers who are able to provide the required products or services. The RFI is sent to the selected suppliers, who then submit their responses. These are carefully analysed to assess suitability and potential for future collaboration. If necessary, further questions are asked or additional information obtained. Based on the responses received, a shortlist is drawn up with the most relevant suppliers who are eligible for further steps. The suppliers are informed of the result of the RFI and receive feedback or an invitation to the next phase.
In the case of an RFQ, the company specifies its requirements and documents in detail the desired goods or services, the conditions, delivery deadlines and evaluation criteria for the selection of offers. The RFQ document is then sent to the previously identified potential suppliers, who are invited to submit a quotation. The bids received are evaluated based on the specified criteria. The supplier that best fulfils the requirements is then selected. If necessary, contract terms, prices or delivery details are negotiated. After the final selection, the contract is awarded to the supplier, formalising the business relationship. Finally, an official purchase order or contract is drawn up, setting out all the relevant terms and conditions. This structured and transparent process enables companies to make informed decisions, minimise risks and ensure efficient collaboration with suppliers.
https://www.linkedin.com/in/mariobuesch/
Understanding Geological Structure: The key to drilling efficiency and cost reduction in grade control operations
In a surface mine environment, field experimentation makes sure that we understand the geological structure accurately – from dip and strike – completely change the results.
At Pansudan Mineral Resources, we integrated geological structure analysis into grade control processes, and saw the difference:
🔍 Precise targeting of ore
With the right drilling guidance, we reduced waste and increased extraction efficiency.
♻️ More accurate separation between ore and waste
Accurately define structural boundaries and reduce sample interference and increase data quality.
📐 Improved drilling pattern
Steering the RC drill perpendicular to the direction of inclination resulted in good coverage with as few pits as possible.
⚠️ Early detection of structural problems
Like faults and pleats help us adjust our digging plan early and avoid surprises.
🧭 Reliable geological model
Contribute to the connection of every process - from drilling and blasting to production.
The bottom line:
Every precise structural information with an intelligent production decision = lower cost + better results.
It wasn’t too long ago when you used to be able to walk into a mine survey office, go over to a plan cabinet, and inspect the mine plans (drawings) which showed excavations of the mine and the parts of the ore body mined out. These plans and sections depicted some of the hazards and proximity of mine workings.
Surveyors used to spend are large portion of their time preparing these, with many adding their personal touch of artistry to an ornate North arrow.
Computer systems with the various mining software or CAD packages have now taken over from the hand drawing of plans.
Go to a survey office today though, and too often you will not be able to see a mine plan of the excavations. Instead, it is more likely the data will be brought up on a screen display, and then be presented with a screen dump or plan depicting a specific area. However, this can only occur if you know where all the relevant data is stored on the computer system and be able to drive the software or, wait until a person such as the Mine Surveyor is available to do this for you.
Having plans readily available is not only useful for planning purposes but is especially important for use in emergency situations.
Deficiencies in mine plans have also been reported as factors in some mining disasters of the past. For example, Gretley Colliery in NSW in 1996.
Even when there is legislation in place, still too often mine plans are not compiled.
Is this from a conscious decision to ignore the requirements or a misinterpretation of them?
A case in point is the West Australian legislation: The ‘Mines Safety and Inspection Regulations 1995’ stipulate the particulars required in mine plans and when they are to be submitted. However, many fail to read the Regulations in conjunction with the ‘Mines Safety and Inspection Act 1994’ which states that accurate plans of the mine are to be kept up to date. It is worth noting that the onus of procuring and keeping mine plans falls on the manager of the mine.
The cost of having in-house or an outsourced compilation of mine plans is not a huge add on to costs already incurred in survey staffing and equipment.
So why is it that so many times I see a site that doesn’t have accurate and up to date mine plans?
I encourage all Mining Inspectors, Managers and Surveyors to audit this fundamental safety item and act on the proper compilation of mine plans.
For helpful reference links regarding this, please see http://www.handebook.com.au/publications/Act%20on%20Mine%20Plans.pdf
25 Aug. 2014
You have the same 24 hours as a Fortune 500 CEO.
So why does it feel like they’re building empires while you’re just clearing your inbox?
Because high performers don’t manage time.
They defend it.
Relentlessly.
Executives who run billion-dollar companies.
Don't rush.
They don’t multitask.
They're not constantly checking email.
Their calendar?
Locked down like Fort Knox.
Every hour has a purpose.
Here’s what top CEOs do differently:
1. They start with clarity.
Every decision flows from priorities.
Not preferences.
Not emotions.
Not other people’s chaos.
They wake up knowing what moves the needle.
And what just makes noise.
2. They schedule thinking time.
Yes, they block space just to think.
No meetings. No screens. No fires to put out.
Because big problems don’t get solved in reactive mode.
They need margin.
3. They make fewer decisions.
The more trivial choices you make,
the less energy you have for meaningful ones.
That’s why they simplify:
Same clothes. Same meals. Same routines.
Not because they’re boring.
Because they’re focused.
4. They don’t do everything.
They delegate, automate, or delete anything
that doesn’t require them.
Because time spent on what only you can do
isn’t efficiency, it’s leadership.
5. They protect the 1st hour.
Before the world demands their attention,
they claim it for themselves.
No Slack.
No email.
No news.
Just strategy. Stillness. Or a run at 5 AM.
6. They treat meetings like money.
Is it essential?
Is it clear?
Is it the best use of everyone’s time?
If not, cancel it. Or make it an email.
Or make it 15 minutes instead of 60.
7. They say no (a lot).
Because every yes is a no to something else.
Often, something more important.
Here’s the truth:
Top CEOs aren’t superhuman.
They just stop giving their best hours to the wrong things.
You don’t need their title.
But you can steal their time habits.
Try this:
• Block time for your most strategic work.
• Trim meetings down to half the length.
• Say no to things you’d never say yes to if your calendar were empty.
You’ll feel uncomfortable at first.
But you’ll also feel clarity.
And eventually, control.
Because time isn’t just what you spend.
It’s what you become in the hours you protect.
En esta oportunidad quiero compartir un capítulo importante del libro Open Pit Mine Planning and Design de W. Hustrulid, M. Kuchta y R. Martin.
Los límites del pit definen la extensión máxima económicamente viable de un tajo abierto, considerando el material explotable como los bloques dentro del pit con valor económico positivo (mineral), las restricciones físicas y técnicas que involucran el balance entre costos y beneficios. Para determinar estos límites se utilizan métodos que evalúan la rentabilidad y factibilidad geotécnica de la extracción.
El método del cono flotante es una técnica geométrica aplicada en secciones bidimensionales para definir un pit mínimo rentable. Consiste en una figura en forma de cono que “flota” o se desplaza sobre las filas de bloques del modelo, identificando y removiendo bloques con valor positivo que pueden ser minados sin comprometer la rentabilidad. Este proceso se realiza de manera iterativa, recorriendo filas y eliminando bloques hasta que no se pueda extraer más material rentable dentro de la geometría definida. El cono flotante es útil para delimitar un pit inicial y estimar el stripping ratio y la rentabilidad local. Sin embargo, este método tiene limitaciones en cuanto a la optimización global, pues puede perder combinaciones rentables o extender el tajo más allá de su límite óptimo.
Para superar las limitaciones del cono flotante, se utiliza el algoritmo de Lerchs & Grossmann (LG), basado en programación dinámica para encontrar el pit abierto óptimo considerando todas las combinaciones de bloques. Este método tiene sus variaciones 2D, 2.5D o 3D, y evalúa un conjunto de bloques con sus valores económicos y restricciones geotécnicas (como ángulos de pendiente y acceso).
El algoritmo LG 3D construye un grafo dirigido donde los nodos representan bloques y las aristas las relaciones de extracción, es decir, que un bloque superior debe extraerse antes que uno inferior. Así, se busca el cierre máximo o el conjunto de bloques que maximiza el valor neto total, respetando las condiciones de accesibilidad y estabilidad del pit. Este cierre óptimo representa el límite económico y físico del tajo abierto, garantizando el máximo beneficio neto para la explotación minera.
Actualmente, el algoritmo Lerchs & Grossmann en su versión 3D es el método estándar y el que utilizan la mayoría de los softwares mineros comerciales para el diseño y optimización de límites de pit abiertos, gracias a su capacidad para manejar grandes modelos de bloques y aplicar restricciones complejas de forma eficiente.
For so many drill and blast professionals, its not the "Drill & Blast" department but rather the "Drill & Blame" department. Where "no news is good news".
If there is poor dig or other issues you have half the minesite pointing fingers and making noise. When the blast works well its crickets, while patting the production team on the back for nailing dig productivity.
A shoutout for the career professionals that stick with it, that are passionate about D&B and know how much goes into getting it right. And praise to the managers who recognise the importance of good D&B; ensuring their D&B professionals are enabled to success, while being recognised for the good blasts and learning from those that need improvement.
What have you seen work well to fix the blame culture, to retain our good people and achieve great D&B ?
Mining Needs Cultures where Truth Survives
In mining, data is everywhere - from fleet telemetry and drill logs to processing plant outputs and tailings dam monitoring. Yet as digital or analytics projects progress, the tipping point often is reached when insights from data do not match with expectations or even prove former decisions wrong. The blame then often falls on the data: "It's incomplete", "It's not ready", "It's biased!". While those critiques may carry some weight - especially at the beginning, when iteration is a mandatory part of the process - the real problem often runs deeper: A culture that rewards comfort over confrontation and hierarchy over honesty.
Mines accumulate data at industrial scale, but need to master the challenge to achieve a coherent framework to interpret or act on it - across all organisational levels. This framework or governance should be purely mining driven. It is about mining correlations, process dependencies and business rules. To a large extent findings will confirm assumptions and established practices, but there will be also uncomfortable truths. However, dealing with those truths with comfort (and without filtering them out) is neither a data nor a mining problem. It is about an inclusive and hands-on environment - in short, it is about culture and what creates culture: the people.
Beyond the need for mining experts to interpret and connect data, it is essential to involve those directly impacted by the digitalization initiative. Their input is valuable not only for interpreting data related to their specific process steps, but also for engaging them in the journey and fostering transparency about how digitalization might affect their individual roles. Without clear communication and context, many people understandably worry about worst-case scenarios - chief among them, the fear that digitalization will eliminate their jobs. While job displacement may occur in isolated cases, the broader reality is that digitalization often enhances roles: it supports better decision-making, reduces the burden of documentation and enables employees to focus more on meaningful aspects of their work, sometimes even allowing roles to evolve in positive new directions.
The significant part of successful digitalization is people-centric (culture!): Actively involving employees in the process and clarifying the range of possible outcomes! Core of this journey is basic groundwork through one-on-one conversations, regular discussions and ongoing engagement beyond. This is not a trivial task, nor is it realistic to expect already fully loaded lead engineers or managers to take it on in addition to their existing responsibilities. These discussions require substance to be meaningful (and not to turn into being counter-productive), with a clear and thoughtful preparation. Typically, this calls for dedicated resources - individuals who can bridge the worlds of mining, IT and human factors - to ensure digitalization in mining is both effective and embraced by all stakeholders.
Mining is complex and unforgiving. To thrive, mining companies need more than numbers - they need cultures that can confront reality. That means engagement and empowering technical teams to ask hard questions. It means rewarding those who challenge assumptions with evidence from data. And it means building processes where inconvenient truths aren’t buried but investigated. Only then digitalization and analytics can serve what they’re meant to: clarity, not consensus.
Stefan Ebert, Digital Mining Technologist
✅️ How to create Geological
✅️ Database in surpac
✅️ Create Section and Digitize
✅️ Orebody Solid Modeling
✅️ Geostatistics and Variogram
✅️ Block Modeling and Resource Estimation
✅️ Pit Design and Waste Dump Design operations using advanced tools.
Te invito a revisar el apunte técnico “Gestión en la Construcción”, una guía clara, estructurada y profundamente útil para quienes buscan fortalecer sus conocimientos en administración de obras y procesos constructivos.
📘 Este documento abarca desde conceptos fundamentales como productividad, costos y plazos, hasta herramientas prácticas como cartas Gantt, curvas “S” y control de avances físicos y financieros.
Se destacan temas como:
- Planificación estratégica en construcción
- Control de gestión y cumplimiento de metas
- Identificación de restricciones y toma de decisiones
- Comunicación efectiva y liderazgo en terreno
👷♂️ Dirigido a estudiantes, profesionales del rubro, este material no solo entrega contenidos técnicos, sino que promueve una visión integral para enfrentar los desafíos de la industria de la construcción actual.
💡 Si estás involucrado en la planificación, supervisión o administración de obras civiles o de edificación, este apunte será una herramienta clave para mejorar tus capacidades y resultados.
The first 90 days are critical for any CPO, Head or Senior Procurement manager to make an impact
(It's also the most commonly asked interview question)
I've created this cheat sheet for you. 🎁
The part most people miss in planning for the first 90 days is the importance of splitting into three distinct sections:
30 days: Understand the Business
60 days: Understand the spend landscape
90 days: Deliver an aligned vision
The way you do this should be broken down further.
The first 30 days
- Engage Stakeholders
- Establish Requirements
- Understand the Business
- Learn through internal review
Days 30 to 60
- Meet key suppliers
- Understand the spend
- Learn through External Review
- Understand the change opportunity
Days 60 to 90
- Align your plan with the business
- Deliver a roadmap for success
- Create a vision to achieve
- Drive a dynamic Procurement plan
The end point of this first 90 days has to be an exec sign off session to ensure
a.) alignment to the strategy and
b.) full top down endorsement
If you don't have a plan like this for the first 90 days, you're unlikely to deliver strategic impact in a business.
It's the very difference between taking on a tactical Procurement role versus a leadership role.
Many struggle to make that step up because they don't have a plan for the delivering impact
And because they misunderstand the importance of building the foundations.
In the cheat sheet below, I've also included the key tasks that need to be delivered in 30/60 and 90 days.
A checklist if you like.
Has this helped?
____________________
📌 Do you want a hi-res PDF of this cheat sheet and all the other ones I release straight to your inbox?
I’m Tom Mills Procurement Protagonist®️
I simplify Procucurement.
Simply sign up to my free newsletter here:
https://procurebites.com/
You’ll get this cheat sheet and other valuable gems for free, released every Monday via the newsletter.
Yes, the basic knowledge of the interface alone does not suffice . Remember a software is a set of algorithms henceforth garbage in is garbage out . One must possess intricate understanding of the subject matter principles before modeling in software . In my experience as a Mine Planning Engineer i have come across projects that demand a solid knowledge base to tailor a solution otherwise you can make an engineering blunder.
A practical example is open pit optimization using Whittle software. There is a common oversight of defining a cut-off grade before running optimisation. Using this approach one would be optimizing ore blocks only . Whereas the optimizer (Lerchs Algorithm) will define for you the economic cut-off grade once you set physical and economical constrains.
You must have real-time subject matter understanding coupled with cutting edge software application for effective solutions.
=> Key Takeaways
- Extracting one ton of gold requires 20,000 MWh of energy, compared to just 250 MWh for silver.
- Each ton of gold produces 9,000 tons of CO₂, while silver mining produces only 125 tons.
- Mining an ounce of gold costs approximately $1,388, compared to $27 per ounce of silver.
At first glance, gold’s higher price per ounce makes it seem like the obvious choice for miners. However, a closer look at production costs and environmental impact reveals why silver remains such an attractive metal to extract.
This graphic, sponsored by Vizsla Silver Corp., uses data from Thunder Said Energy, AG Metals, and Metals Focus Gold Mine Cost Service to compare the costs of mining silver vs. gold.
----
=> The Energy and Emissions Footprint
Gold mining is not only significantly more energy-intensive than silver mining but also produces many more emissions because of the increased energy intensity.
Mining Metric Silver Gold
Energy Intensity (MWh/ton of metal) 250 20,000
Emissions Intensity (tons of CO2/ton of metal) 125 9,000
Production Cost ($/ounce of metal) 27 1,388
Extracting one ton of gold requires 20,000 MWh of energy, compared to just 250 MWh for silver—an 80-fold difference. This vast energy demand translates into emissions: each ton of gold produces 9,000 tons of CO₂, while silver mining produces only 125 tons.
This stark contrast in energy and emissions highlights a key challenge in the gold industry. Despite its high market value, the environmental cost of gold extraction is dramatically higher than that of silver.
----
=> Production Costs: Bang for the Buck
The financial aspect further supports silver’s appeal. Mining an ounce of gold costs approximately $1,388, compared to $27 per ounce of silver. This means gold is 51 times more expensive to extract than silver when using the all-in-sustaining costs metric.
While gold prices are significantly higher, silver’s lower production costs indicate a more efficient return on investment.
Silver is a compelling alternative to gold when considering both environmental and financial factors. While gold is valued much higher, silver offers a more sustainable and cost-effective approach to mining.
By: Ryan Bellefontaine
Graphics & Design: Athul Alexander
Source: Credit to Ryan Bellefontaine, Visual Capitalist
A Mineral Resource Estimate (MRE) isn’t just a number—it’s a technically disciplined, auditable process that transforms geological data into an asset recognized by global reporting codes.
🔷 1.Geological Interpretation
Understanding lithology, structure, alteration, & mineralization controls is the first step.
🛠️ It defines domain boundaries & underpins the entire modeling strategy
🔷 2.Data Quantity & Quality Review
Drill density, spatial coverage & continuity
Sampling recovery, accuracy & QA/QC
📌 Only verified data qualifies for use in compliant models
🔷 3.Data Validation
Database cleanup: fix survey errors, depth overlaps, duplicates
✅ A validated dataset is a non-negotiable input for geological modeling
🔷 4.Geological & Grade Domaining
3D modeling of lithological units, oxidation fronts & mineralised envelopes
Length-weighted compositing ensures uniform sample support
🔷 5.Grade Capping & Statistical Analysis
Remove influence of extreme outliers
Analyze grade distributions, CV & normality
🎯 Critical in high-variance or nuggety systems.
🔷 6.Geostatistical Modeling
Build variograms per domain
Quantify nugget, sill, range & anisotropy
📈 Forms the basis of robust kriging estimates.
🔷 7.QKNA – Quantitative Kriging Neighbourhood Analysis
Optimize:
Search radius and ellipsoid geometry
Block discretization & sample limits
🔍 Ensures estimation precision & conditional bias minimization
🔷 8.Grade Estimation
Select method aligned with domain geometry and data behavior:
Ordinary Kriging (OK)
Inverse Distance Weighting (IDW)
Multiple Indicator Kriging (MIK)
⚙️ Methodology must respect domain boundaries and spatial continuity.
🔷 9.Model Validation
Swath plots and local/global comparisons
Composite vs block validation
✅ Reinforces geological consistency and statistical reliability.
🔷 10.Resource Classification
Apply code-compliant criteria (JORC / NI 43-101):
Measured – dense data, robust variograms
Indicated – moderate support
Inferred – wider spaced, lower confidence
📊 Classification underpins project risk, valuation, and disclosure.
🔷 11. Economic Assessment & Cut-Off Application
Evaluate Reasonable Prospects for Eventual Economic Extraction (RPEEE):
Use recovery, operating cost, and price assumptions
Apply block-level cut-off grade logic
📉 Ensures the resource has economic relevance, not just geological presence.
🔷 12. Compliant Mineral Resource Statement
Report tonnage, grade, metal content by category.
📝 Signed by a Competent Person (JORC) or Qualified Person (NI 43-101).
Transparent. Defensible. Compliant
An MRE is where geological confidence, statistical rigor, and economic logic converge. It forms the technical backbone of any mine development strategy, investor decision, or feasibility study.
In the mining industry, the terms "Digitalization" and "Automation" are often used interchangeably, but at their core they represent fundamentally different concepts. Digitalization is about transforming mining processes into data: by collecting, quantifying and intepreting every aspect of operations in numercial form. This approach enables a mathematical and visual understanding of how processes function as it provides critical insights into operational dynamics. The focus is on gaining a deeper, data-driven comprehension of the system. In contrast, Automation to a large extent is about substituting human operators with machines or software, reproducing the actions previously performed by them. This can progress towards fully autonomous operations, where systems function without any human intervention or oversight.
Thus, in a nutshell, automation - and in its advanced form, autonomy - usually relies on rule-based configurations. These systems are programmed with predefined instructions and parameters, ensuring that processes are executed consistently and predictably. The key value here is the ability to plan and rely on the process outcomes. Automation is ideal for repetitive, well-understood tasks where the primary goal is to remove variability and enhance safety, gain productivity within clearly defined boundarys and achieve cost efficiency. For example, haul trucks following predefined routes. As mining operations become more autonomous, the reliance on human intervention diminishes, but the underlying logic remains rule-based.
Digitalization, on the other hand, is about unlocking new levels of understanding. By collecting vast amounts of process data, mining companies can identify inefficiencies, bottlenecks or previously hidden weaknesses. Advanced analytics, artificial intelligence (AI) and machine learning (ML) can then be applied to simulate a large amount of scenarios, predict outcomes and optimize operations - not just replicate existing ones. This continuous feedback loop enables dynamic improvement, rather than static execution. As a result, Digitalization is targeting for a predictive view into the future and improvement. However, usually a human interpretation on the insights provided and active actions on those findings accordingly is a precondition to generate value.
While there are significant interdependencies, in particular, how Digitalization and Automation complement each other in modern mining, each one serves a fundamentally different purpose: Digitalization delivers data-driven insights, while automation focuses on replacing human tasks. For this reason, it is important to consider each approach individually, carefully assessing operational needs and addressing their unique challenges. Both are essential to the future of mining. By clearly understanding their distinct roles and benefits to defined mining problems, unlocking the full potential of digital mining transformation can be highly accelerated.
Lorsqu’un collaborateur quitte une organisation, son départ est bien plus qu’un simple changement d’effectif. C’est une opportunité unique de recueillir des retours précieux pour améliorer l’environnement de travail, renforcer l’engagement des équipes et optimiser les pratiques managériales.
🔹 Pourquoi l’Entretien de Départ est-il essentiel ?
Comprendre les motifs de départ : Identifier les raisons (rémunération, management, évolution professionnelle, etc.) permet d’agir sur les axes d’amélioration prioritaires.
Valoriser l’expérience collaborateur : Montrer que chaque voix compte, même à la fin du parcours, renforce la marque employeur.
Anticiper les tendances : Analyser les feedbacks aide à prévenir les départs futurs et à adapter la stratégie RH.
🔹 Comment en faire un levier efficace ?
✅ Confidentialité et bienveillance : Créer un climat de confiance pour des retours authentiques.
✅ Questions ciblées : Combiner des questions fermées (évaluations) et ouvertes (commentaires libres) pour une analyse complète.
✅ Plan d’action concret : Transformer les insights en mesures tangibles (formation des managers, ajustement des avantages, etc.).
📢 À tous les professionnels RH et managers : Ne sous-estimez pas la richesse de ces échanges. Un entretien de départ bien mené est un pas de plus vers une organisation plus agile, inclusive et performante !
Leadership is a combination of hard and soft skills. Hard skills focus on the specific tasks of leadership, such as finances, strategic planning, project management, and sermon preparation. These technical skills help you fulfill responsibilities that are unique to the role.
But leadership also encompasses soft skills. The soft skills of leadership focus on people, teams, and the qualities that build enduring influence. Soft skills are transferrable from one job to the next and are essential regardless of the context.
This edition of Make it Count explores 10 soft skills of leadership and considers ways to master each.
If you can’t track it—
You can’t lead it:
Leadership isn’t about being busy.
It’s about being effective.
But without the right numbers,
you’re managing in the dark.
Here’s what happens when you don’t measure:
• Goals get misaligned
• Progress slows down
• Talent gets overlooked
• Problems go unnoticed
• Decisions lose direction
Strong leadership isn’t reactive.
It’s informed.
It’s deliberate.
It’s based on what the data tells you—
not what you hope is true.
It's using the right metrics to answer hard questions:
→ Are people engaged—or pulling back?
→ Are we learning—or just repeating?
→ Are we working on the right things?
→ Are we growing—or just surviving?
→ Are we moving fast enough?
Great leaders don’t wait until the end of the quarter
to find out something went wrong.
They see the signals early,
Because the numbers show them where to look.
Leaders who measure what matters—
Lead what matters.
We continue with the series:
💎 "Foundations of a Reliable Geological Database"
📍 Post 3: The Critical Connection Between Files – Structure, Errors, and Control.
In mineral exploration, we talk about grades, models, and estimations… but all of that begins with a well-structured geological database.
A reliable database is not just a tidy spreadsheet — it's a system of interconnected files, where each part contributes essential geological context.
📁 The 4 Essential Files
°Collar: 🔍 Possible errors: coordinates outside the grid, incorrect elevations, out-of-range values.
✅ Control: topographic validation, standard formatting.
°Survey: 🔍 Common errors: reversed paths, dips >90° incorrectly recorded, paths not starting from the collar.
✅ Control: logical and geometric consistency, dip/azimuth range, review with 3D viewers.
🧪Assays: Chemical analysis data by interval (from/to and grades).
🔍 Frequent errors: overlapping intervals, gaps, duplicate grades, incorrect units.
✅ Control: continuity checks, positive limits, duplicates, unit conversions.
°Lithology: 🔍 Typical errors: inconsistent names, intervals not closing properly, overlapping data.
✅ Control: use of a code dictionary, geologist review, QA/QC validation.
➡️ What connects them?
🔏 Hole_ID is the primary relational key—the unique identifier that links each file.
🗝️ Without this clear relationship, data integrity is lost and the model becomes unreliable.
💣 Common error: records with Hole_IDs not found in the collar, duplicates, or inconsistencies across tables.
🚦 How to maintain integrity?
✔️ Implement automatic cross-table validations
✔️ Standardize nomenclature (e.g., “LIT01” ≠ “LITO01”)
✔️ Use scripts to detect overlaps and structural issues
✔️ Ensure traceability with formal QA/QC (change logs, approvals, versioning)
✔️ Educate the team on each file’s role and associated risks
📌 In Summary
📂 Each file is like a layer of information that, when properly aligned, builds the full geological story.
❕ But if just one layer is misplaced or misclassified, the entire model can fail.
🛠️ Inter-file integrity isn’t just a technical issue—it’s a critical practice to avoid multi-million-dollar mistakes.
The recent resilience in mining stocks has been remarkable.
Keep in mind that the mining sector still represents just a small share of the global economy, but that’s probably about to change.
Both investors and policymakers are beginning to recognize the strategic importance of these companies in a world where hard assets are more essential than ever.
It’s time to revitalize a legacy industry.
Las situaciones que pueden comprometer la integridad física de las personas, pueden suceder en cualquier momento y en cualquier lugar. La primera intervención realizada para atender estas situaciones, pueden influir de manera decisiva en mejorar la situación de la persona o personas afectadas
Los primeros auxilios son un conjunto de medidas iniciales que se aplican ante una enfermedad o lesión, antes de la llegada de servicios médicos profesionales. La Organización Mundial de la Salud (OMS) subraya que la formación en primeros auxilios no solo salva vidas, sino que también contribuye a reducir el número de incapacidades y discapacidades permanentes en el lugar de trabajo
Por esto es necesario que la ciudadanía en general y las empresas conozcan cómo actuar en las situaciones de urgencias más frecuentes y además sepa contactar con los servicios de emergencias
Por lo que la correcta aplicación de primeros auxilios puede ser crucial en situaciones de emergencia, sin embargo muchas empresas no se encuentran preparadas para responder adecuadamente. Esta falta de preparación no solo pone en riesgo la salud de los empleados, sino que también puede acarrear implicaciones legales para la empresa.
Al respecto adjunto la “Guía de Primeros Auxilios” de Empresas Públicas de Emergencias Sanitarias de España 🇪🇸
Con el objetivo de trasladar conocimientos, de una manera sencilla, haciendo una descripción de las situaciones más frecuentes que se puede encontrar cualquier persona y destacando qué
medidas se deben realizar y cuáles no deben hacerse, ya que podrían
empeorar la situación.
Incluye cómo se debe actuar en situaciones en las que nos podemos ver inmersos como las que ocurren en un entorno inseguro, provocadas por grupos violentos activos.
Por lo que la importancia de los primeros auxilios en las empresas es indiscutible. La formación en esta área no solo salva vidas, sino que también reduce los costos asociados a accidentes, promueve una cultura de seguridad y asegura el cumplimiento de la legislación vigente. A medida que las empresas continúan enfrentando desafíos en materia de seguridad y salud, invertir en la capacitación en primeros auxilios debe ser una prioridad estratégica. Al hacerlo, no solo están protegiendo a sus empleados, sino que también están invirtiendo en su propio futuro.
Buena lectura !!!
Source : Percy Raul Mesias Urday
Source: Credits to Empresa Pública de Emergencias Sanitarias ES & Percy Raul Mesias Urday
How We Protect Tunnels and Mines
1-Rock Bolts
Steel rods inserted into the rock to bind layers together and prevent separation.
2-Wire Mesh
Used with rock bolts to hold small rock fragments and prevent falls.
3-Shotcrete
A thin layer of sprayed concrete applied to tunnel walls to strengthen and stabilize them.
4-Steel Sets / Arches
Used in areas with weak rock or high stresses to provide strong support.
5-Hydraulic Props
Adjustable columns used to temporarily support the roof during operations
🛡️ Why Ground Support Matters:
- Protects workers and equipment
- Prevents tunnel collapses and production stoppages
- Reduces accidents and repair costs
Choosing the right support type depends on careful assessment of rock conditions, stress levels, and mine environment.
Proper ground support design is essential for the success and sustainability of underground mining.
We were advancing a feasibility with a vision for a full BEV underground fleet, a true "mine of the future".
90 pieces of gear designed to deliver on ESG, innovation, and long-term value.
It was a model case of progressive mine design - but that commitment came with a trade-off.
BEVs cost 20-30% more upfront than diesel, and capital was tight - so we took a step back:
Trucks and LHDs? High utilization, clear productivity gains - BEVs made sense
Drills and support vehicles? Often stationary. Low engine hours. Easy access to power - the business case wasn't there.
We proposed a hybrid fleet - BEV where it moved the needle, diesel where it didn't.
The result? It saved $25M in upfront capital.
The takeaway: Sometimes the future is built in phases, not leaps.
Effective fleet strategy balances ambition with practicality - aligning with the levers that matter most.
We didn't abandon the future. We made it achievable.
How are you approaching major tech shifts in your mine plans?
It's not just luck or concrete — it's rock mass classification, and the Q-System is one of the most trusted tools for it in mining and tunneling.
Developed in 1974, the Q-System helps engineers evaluate the quality of rock masses using 6 key parameters:
1️⃣ RQD – Rock Quality Designation
2️⃣ Jn – Joint set number
3️⃣ Jr – Joint roughness
4️⃣ Ja – Joint alteration
5️⃣ Jw – Water inflow
6️⃣ SRF – Stress reduction factor
The result? A numerical Q-value that tells you exactly how strong or weak your ground is — and what support it needs.
🔩 Based on this, you can determine:
Type of rock support (e.g., bolts, mesh, shotcrete)
Support spacing
Tunnel stability
Q-System = turning geology into engineering decisions.
They’re every job seeker's biggest worry—because you never really know what’s coming.
And some of them? Brutal.
– “What’s your biggest weakness?”
– “Why should we hire you?”
– “Tell me about a time you failed.”
These aren’t just questions. They’re tests—of how you think, communicate, and stay calm under pressure.
Here’s how to handle them:
👉🏻 Be real and strategic. Show growth, not perfection.
👉🏻 Use the STAR method to structure your answers.
👉🏻 Practice out loud—confidence builds with repetition.
👉🏻 Research the role so your answers are tailored.
👉🏻 Ask smart questions too. Interviews go both ways.
Don’t memorize. Prepare with purpose.
Want all 60 tough questions with smart answers?
That’s dropping next.
Follow Surabhi Reddy Reddy for more.
In tunneling and blasting, safety is non-negotiable, and ventilation plays a crucial role in keeping workers safe and operations efficient.
Here’s why effective ventilation is essential for underground projects:
💨 Air Quality
Blasting releases harmful gases like CO and NOx. Proper ventilation dilutes these dangerous gases and ensures workers have clean, breathable air.
🌡️ Temperature Control
Underground operations can get HOT. Ventilation helps regulate the tunnel's temperature, reducing heat stress and ensuring a comfortable environment for workers.
⚙️ Pressure Management
Controlled airflow reduces pressure buildup, maintaining structural integrity and minimizing safety risks during operations.
👁️ Improved Visibility
Blasting produces a lot of dust. Effective ventilation clears the air quickly, improving visibility and allowing teams to work more efficiently.
✅ Safety & Compliance
Proper ventilation aligns with safety regulations, ensuring compliance while boosting productivity. Regular monitoring of airflow can prevent accidents and enhance operational safety.
💡 As tunneling projects grow in complexity, investing in advanced ventilation systems isn’t just smart—it’s essential for safety and success.
Mine geologists play a pivotal role in the success of mining projects. Their expertise is not only critical in identifying economically viable mineral deposits, but also in driving sustainable mining practices that ensure long-term resource utilization.
The contributions of geologists stretch from the early exploration phase to the development and expansion of mine sites, influencing decisions that affect the financial viability and environmental impact of mining operations.
Optimizing rock fragmentation depends on understanding how joint fracture systems interact with blasting parameters. Key factors such as joint spacing, dips and orientation play a crucial role in determining fragment size distribution and target optimum powder factor.
𝙅𝙤𝙞𝙣𝙩 𝙎𝙥𝙖𝙘𝙞𝙣𝙜:
Closely spaced joints → Smaller, more manageable fragments.
Widely spaced joints → Larger blocks, often requiring secondary breakage.
J𝐨i𝐧t O𝐫i𝐞n𝐭a𝐭i𝐨n: Influences fracture propagation and overall blast efficiency.
𝐕o𝐥u𝐦e𝐭r𝐢c J𝐨i𝐧t C𝐨u𝐧t (𝐉v): Measures the number of joints per cubic meter.
→ High Jv : More fractures, easier breakage, finer fragmentation.
→ Low Jv : Intact rock, larger fragment sizes post-blasting.
𝐑o𝐜k Q𝐮a𝐥i𝐭y D𝐞s𝐢g𝐧a𝐭i𝐨n (𝐑Q𝐃): Evaluates rock integrity and is inversely related to Jv.
→ Low RQD : Highly fractured rock.
→ High RQD : More intact, resistant rock mass.
𝑯𝒐𝒘 𝑱𝒗 𝒂𝒏𝒅 𝑹𝑸𝑫 𝑰𝒏𝒇𝒍𝒖𝒆𝒏𝒄𝒆 𝑷𝒐𝒘𝒅𝒆𝒓 𝑭𝒂𝒄𝒕𝒐𝒓
Powder Factor targets are directly affected by jointing characteristics:
• 𝐇𝐢𝐠𝐡 𝐉𝐯 / 𝐋𝐨𝐰 𝐑𝐐𝐃: Rock is naturally fragmented, Requiring lower Powder Factor to avoid excessive fines and overbreak.
• 𝐋𝐨𝐰 𝐉𝐯 / 𝐇𝐢𝐠𝐡 𝐑𝐐𝐃 : Rock is more intact and resistant, Requing higher Powder Factor to achieve effective fragmentation.
Ignoring joint characteristics in blast design can lead to:
- Inefficient fragmentation.
- Excessive fines or oversized blocks.
- Increased costs due to secondary breakage.
By integrating Jv, RQD into blast planning, better results can be achieved with optimized costs and improved efficiency.
Daily Management System (DMS) or in Japanese Asakai is a structured approach to managing day-to-day operations that focuses on continuous improvement and loss (muda) reduction.
Definition of DMS/Asakai :
A Daily Management System is a set of practices and tools that enable companies to:
1️⃣ Monitor performance daily
2️⃣ Identify areas for improvement
3️⃣ Take corrective actions quickly
4️⃣ Align KPI’s w/ operational execution
5️⃣ Standardize management processes
6️⃣ Establish standard work
7️⃣ Foster a culture of continuous improvement
DMS/Asakai is typically executed through a tiered structure:
➡️ Tier 1 (Team Level):
- Daily huddles (5-15 minutes) at the start of each shift
- Review of key performance indicators (KPIs)
- Discussion of issues and quick problem-solving
➡️ Tier 2 (Supervisory Level):
- Daily meetings (15-30 minutes) with team leaders
- Review of escalated issues from Tier 1
- Coordination of cross-functional problem-solving
➡️ Tier 3 (Management Level):
- Daily meetings (30-45 minutes) with supervisors and managers
- Review overall performance and strategic alignment
- DMS/Asakai Actions follow up
- Review and decision making for escalated issues from Tier 1-2
- Resource allocation and improvement initiatives follow up
Key components
✅ Visual management boards displaying KPIs and action items
✅ Standard work for leaders at each level
✅ Gemba walks to observe processes and identify improvement opportunities
✅ Problem-solving methodologies (Root Cause Analysis)
✅ Escalation processes for unresolved issues
How DMS/Asakai helps
☑️ Enhances equipment reliability by quickly identifying and addressing maintenance issues
☑️ Improves overall equipment effectiveness (OEE) through daily monitoring and rapid problem-solving
☑️ Reduces unplanned downtime by promoting proactive maintenance
☑️ Increases employee engagement and ownership in continuous improvement efforts
☑️ Aligns daily activities with strategic goals, ensuring focus on critical areas
☑️ Facilitates knowledge sharing and best practice adoption across the organization
☑️ Promotes a culture of accountability and data-driven decision-making
By implementing a robust Daily Management System, companies can sustain their performance, driving operational excellence and continuous improvement throughout the enterprise.
*Below dash is just an example, details/content may vary based on company metrics/strategic priorities.
La importancia de un regadío segmentado en las rampas. Nos permite tener control para el frenado de los caex y a la vez nos ayuda a controlar la polución.
Desde la instrucción de nuestros operadores hasta la ejecución en terreno, necesitamos ser consistentes en lo que hablamos y en lo que hacemos, siempre enfocados en generar las mejores condiciones en seguridad para operar y lograr nuestras metas.
Confirmar nuestros procesos es clave para generar una cultura de mejoramiento continuo, vamos por más, siempre más.
Neural artificial intelligence, particularly neural networks, can have significant implications in resource estimation. These AI models can analyze large datasets and recognize complex patterns that might not be apparent to human analysts. In the context of resource estimation, neural AI can help in:
1. **Data Analysis**: Neural networks can process geological data, such as drill hole data, geophysical data, and geochemical data, to identify valuable patterns and correlations that can improve resource estimation accuracy.
2. **Predictive Modeling**: By training neural networks on historical data, they can predict mineral deposits' locations and characteristics more accurately, helping in estimating resources with higher precision.
3. **Risk Assessment**: Neural AI can assess uncertainties and risks associated with resource estimation by considering various factors and scenarios, providing a more comprehensive understanding of the resource potential.
4. **Efficiency**: Automating resource estimation processes using neural AI can significantly reduce the time and effort required for manual calculations, allowing geologists and engineers to focus on higher-level analyses and decision-making.
5. **Continuous Learning**: Neural networks can continuously learn and adapt to new data, improving their accuracy over time and helping in updating resource estimates based on real-time information.
Overall, integrating neural artificial intelligence into resource estimation processes can lead to more accurate, efficient, and data-driven decision-making in the mining and geological industries.Barrick BHP Newmont Corporation Datamine Seequent Artificial Intelligence AngloGold Ashanti GOLD FIELDS
Yedidia Mgema MAusIMM
Exploration Geologist consultant
machine learning enthusiast
Smart Mining Resources
email;yedidiamgema@outlook.com
contact;+255694238804 (WhatsApp)
1st, May, 2025
The document presents the Turkish and English equivalents of technical terms employed in resource and reserve classification systems, as well as in mineral exploration and mineral resource and reserve reporting processes. It is intended to promote uniformity and clarity of terminology among professionals within the industry.
📢 Classification of Resources and Reserves & Technical Terms Document Released
A document titled “Classification of Resources and Reserves & Technical Terms” has been published to provide detailed information on the classification system and technical terminology incorporated in the UMREK Code, the second edition of which was issued in 2023. The document presents the Turkish and English equivalents of technical terms employed in resource and reserve classification systems, as well as in mineral exploration and mineral resource and reserve reporting processes. It is intended to promote uniformity and clarity of terminology among professionals within the industry.
📢 Kaynak-Rezerv Sınıflandırması ve Teknik Terimler Dokümanı Yayınlandı
2023 yılında ikinci versiyonu yayımlanan UMREK Kodunda yer alan sınıflandırma sistemi ve kullanılan teknik terimler hakkında “Kaynak-Rezerv Sınıflandırması ve Teknik Terimler” dokümanı yayımlanmıştır. Bu doküman, kaynak ve rezerv sınıflandırma sisteminin ve maden arama, maden kaynak ve rezerv raporlama süreçlerinde kullanılan teknik terimlerin Türkçe ve İngilizce karşılıklarını içermekte olup sektör profesyonelleri arasında terminoloji birliği sağlamayı amaçlamaktadır.
UMREK Websitesi Link:
https://umrek.com.tr/Custom/CustomPage/e4dfa148-1ae8-4bf2-9827-6a5330730a46
A Total Station is a surveying instrument that combines an electronic theodolite (for measuring horizontal and vertical angles) and an Electronic Distance Measurement (EDM) device. It measures angles and distances and converts them into coordinates using geometric equations.
1. Conversion from Polar to Cartesian Coordinates (XYZ)
When the instrument measures:
Horizontal angle (θ),
Vertical angle or elevation angle (α),
Slope distance (S),
It calculates the coordinates of the unknown point using the following equations:
X = X₀ + S × cos(α) × sin(θ)
Y = Y₀ + S × cos(α) × cos(θ)
Z = Z₀ + S × sin(α)
Where:
(X₀, Y₀, Z₀) are the coordinates of the instrument (station),
θ is the horizontal angle (from a reference direction),
α is the vertical angle (from the horizontal plane),
S is the slope distance to the point.
2. Horizontal Distance and Vertical Difference
Horizontal distance (H) = S × cos(α)
Vertical difference (ΔZ) = S × sin(α)
3. Angle Calculation Using the Cosine Rule
To find angles in a triangle between three points:
cos(θ) = (a² + b² - c²) / (2ab)
4. 3D Distance Between Two Points
To calculate the spatial distance between two points:
D = √[(X₂ - X₁)² + (Y₂ - Y₁)² + (Z₂ - Z₁)²]
Hey all, my latest article is ready.
Lifting the curtain on some of my takes on truck and shovel queue visualisation.
Please share with your network if you like this one! It really helps me.
Thanks Information Alignment for the data capability.
👇
The Levels of Queue Visualization
Level 0: Not tracking queue time? Yikes!
Level 1: The Numbers Speak
Level 2: The Picket Fence
Level 3: Downtimes Added
Level 4: Bring in the Distro's
Level 5: Go nuts lol
BOSS LEVEL: Real-time baby!
Animated Queue:
https://youtu.be/9KWZVW0pDEI?si=TBBbhAJBrQzsUTgT
La OIT destaca la importancia del manejo adecuado de los explosivos o detonadores en las minas a cielo abierto, requiriendo la autorización de la autoridad competente para cualquier actividad. Esto incluye el transporte, fabricación, procesamiento, posesión, uso, preparación, tratamiento, despacho, almacenamiento, embalaje, venta, suministro, neutralización, abandono, destrucción y eliminación de explosivos.
En una mina a cielo abierto, sólo se deben utilizar explosivos o detonadores aprobados, y la legislación nacional define el término "explosivo" y especifica sus condiciones. El almacenamiento de explosivos debe construirse de acuerdo con las normas impuestas por la autoridad competente, quien será la responsable de la construcción. No se debe permitir que se almacenen artículos en el mismo polvorín que otros explosivos.
El área que rodea el polvorín debe estar limpia, seca y ventilada, con paredes y pisos que mantengan buenas condiciones y seguridad. Los explosivos deteriorados deben aislarse y destruirse de acuerdo con las instrucciones del fabricante. Cuando se interrumpan o suspendan las operaciones, todos los explosivos deben transportarse a un lugar seguro o destruirse de manera aprobada.
La empresa es responsable de preparar los procedimientos para el transporte regular de todos los explosivos y detonadores. Los vehículos utilizados para el transporte de explosivos deben cumplir con ciertos requisitos, como tener una construcción robusta, aberturas adecuadas, sistemas de extintores y un conmutador para aislarlos.
Se debe especificar la zona de peligro en las minas a cielo abierto y los procedimientos para la protección de las personas y bienes afectados por explosiones, proyecciones de fragmentos, contaminación y humos.
Las sustancias inhalables pueden verse afectadas por la exposición a agentes tóxicos, como el daño al tejido pulmonar, la dispersión de neutrones y los gases que agotan el oxígeno. Las altas concentraciones de ciertos asfixiantes pueden causar cáncer de pulmón, mientras que los altos niveles de contaminación en los puntos de carga, los puntos de transferencia de materiales y los sitios de eliminación de desechos pueden reducir la visibilidad de los trabajadores.
La evaluación de riesgos debe comenzar con una evaluación de riesgos exhaustiva, considerando factores como la naturaleza de la operación, los peligros potenciales y las consecuencias potenciales de la operación.
There’s nothing prouder for a planner than watching the result come together after months of designing, planning, and coordination.
During my time as a Mine Planning Engineer at an open-pit gold mine in Indonesia, I was responsible for planning and coordinating operations in an extremely challenging environment, where geothermal activity caused hot groundwater to emerge from the pit floor and walls, with temperatures reaching up to 95°C. My role involved not only short-term mine planning but also daily collaboration with multiple departments, including Geotechnical, Drill & Blast, Mine Geology, Dewatering, and Operations, to ensure the safe and effective execution of the plan. Close supervision and coordination were essential, especially during pre-start meetings where we reviewed safety concerns, progress updates, and real-time adjustments based on site conditions.
One critical factor in open-pit mine planning is the sump sequence, especially in high-rainfall areas like Indonesia. With wet season rainfall reaching up to 400 mm/month and geothermal inflows adding as much as 3,800 m³/hour of hot water, a poor sump plan can quickly turn into operational chaos. Limited space at the pit bottom and ramp constraints mean sump locations must align with long-term mine designs, not just weekly production plans. Misaligned sump sequencing doesn’t just pose safety risks, it can also directly reduce ore recovery below target.
These challenges highlight why mine planners must think both strategically and tactically. Strategic thinking helps define the long-term direction, such as production goals, infrastructure layout, and overall pit design. At the same time, tactical decisions, like interim design, sump positioning, digging direction, ramp access, and day-to-day coordination, ensure those long-term plans stay on track under real-world conditions. We must understand “Where are we going?” while also knowing “How do we get there today?” At the end of the day, Strategic and Tactical are not separate mindsets in Mine Planning, they are inseparable.
I’m truly grateful for the experience, the chance to be mentored by senior engineers and to work alongside a skilled, professional team. Every project teaches something new, and I’m looking forward to the next challenge.
Blank samples comprise reference material with a grade less than the detection limit or should be close to zero, blanks are usually composed of material such as quartz, limestone, granites or basalt or any materials which ensured have grades lower than detection limit.
Blanks are very useful in testing samples laboratory preparation and controlling contamination effect, usually it's inserted into sample batch after mineralised samples or main mineralised zones.
There are most common two scenarios:
* if it was inserted after the meniralised zones and its results recording assays, it should be reviewed the laboratory preparation and the cleanliness.
* When it was inserted into expected low grade samples and its results recording high assays, it has been swapped during samples preparation and we can ensure that from our geological logging.
It's common that blanks have some assays but it must be very close to the detection limits or until (10) times of it will be acceptable.
El mantenimiento reactivo y el mantenimiento proactivo, no son tipos de mantenimiento.
Entonces ¿Que son?
En el siguiente artículo podrás encontrar la respuesta.
El artículo es tomado de mi libro "PLANIFICACIÓN, PROGRAMACIÓN Y COSTOS DEL MANTENIMIENTO" que podrás adquirir en:
https://www.bookdelivery.com/fr-en/books/search?q=Jos%C3%A9+Contreras+M%C3%A1rquez
When dealing with post-blast scenarios, it's crucial to be aware of the potential dangers from the blast fumes generate. Here's a breakdown of the key components:
- **Carbon Monoxide (CO):** A silent threat, this colorless, odorless gas can lead to severe symptoms like headaches, dizziness, and in extreme cases, unconsciousness or even death. Particularly hazardous in underground settings.
- **Nitrous Oxides (NOX):** Sporting a reddish-brown hue, these compounds can trigger irritation and discomfort. Even small doses inhaled amidst blasting activities can prove fatal.
- **Carbon Dioxide (CO2):** This odorless byproduct arises from burning carbon and organic substances, as well as respiration. Explosives inevitably generate CO and CO2, especially those containing organic carbon.
- **Ammonia (NH3):** With its pungent smell, ammonia has the potential to irritate the skin, eyes, nose, throat, and lungs upon exposure.
- The explosive's "oxygen balance" plays a pivotal role in determining the nature and volume of fumes produced. While an oxygen surplus typically yields nitrogen oxides, an oxygen deficit can result in the formation of toxic carbon monoxide.
- Improperly primed explosives, water-damaged charges, or those below the critical diameter threshold can also give rise to toxic fumes.
- Post-blast safety tip: Always allow ample time for fumes to dissipate before inspecting the area after blasting.
Remember, each kilogram of explosives translates to a staggering 1000 liters of potentially hazardous fumes. Stay vigilant and prioritize safety in every blasting operation. 👍
Pic: Example Post Blast fumes in Underground and Open Pit Mining
Are you letting a few degrees bias your resource estimate?
You already know that even a slight misalignment of your search ellipsoid can cause a block to be classified either above or below the cut-off grade, exceeding the confidence band.
The search ellipsoid is like our invisible Midas hand that determines which samples influence each block's grade. Its properties fundamentally shape our resource models, yet their optimization often doesn't receive the attention it deserves.
To determine its parameters, we primarily use variogram analysis and our geological understanding of the deposit.
Let's break down the main critical search ellipsoid properties:
➔ Ellipsoid Radii: These define how far we search for samples in each direction. Ideally, they should align with variogram ranges that capture the spatial continuity of mineralization.
➔ Axis Orientation: The major axis should follow the direction of maximum continuity (typically along strike), with semi-major and minor axes oriented along dip and across the structure.
➔ Sector Division: Dividing the ellipsoid into sectors (octants or quadrants) ensures spatial representativity of samples.
➔ Min/Max Points Per Sector: These parameters balance between having enough data for statistical strength while preventing clustering bias.
Using a globally-oriented search ellipsoid when estimating a folded and complex structure almost guarantees error. Instead, consider Dynamic anisotropy to locally adjust your ellipsoid orientation block by block, ensuring it follows the mineralization's true path.
As we can adjust the dynamism of our search ellipsoid block by block, I think we should also able to adjust the it's dimension lengths according to the geological zones of our deposit. For instance; in some cases 25 m radii can give the same trust with 50 m radii according to the different zones in our deposit.
Common errors I've encountered in projects
➔ Search ellipsoids that ignore geological controls
➔ Over-reliance on default software parameters
➔ Not testing multiple ellipsoid configurations
➔ Using the same ellipsoid dimensions across different domains
Dear Colleagues,
What search ellipsoid challenges have you faced? Have you tried dynamic Anisotropy ? What parameter selection approaches work best in your experience ?
Perhaps, instead of the traditional block modelling approach where we deterministically assign a grade value at the centre of each block, a different methodology could be developed instead of block modelling ?
ML algorithms have already started to be applied to block modelling. Even if we continue to use the block modelling concept, could we consider replacing the conventional search ellipsoid which serves as our resource estimation tool with dynamically shaped volumetric shapes that adapt the geometry of data ?
Tunc Ozbek, MSc Mining Engineer.
https://www.linkedin.com/in/tunc-ozbek-123603128/
El KPI olvidado que podría transformar la estrategia de mantenimiento: IM (Índice de Intensidad de Mantenimiento)
Dentro de mis años de experiencia sólo una vez escuché sobre este indicador y no precisamente estaba dentro de las métricas de medición de la compañía. En la industria hablamos constantemente de MTBF, MTTR, backlog o disponibilidad. Son indicadores esenciales en mantenimiento, sin duda. Pero hay uno que suele quedar en la sombra y que, bien interpretado, puede revelar verdades profundas sobre nuestra gestión: el Índice de Intensidad de Mantenimiento (IM).
¿Qué es el IM?
El IM se calcula como:
IM = Horas de mantenimiento / Horas de operación
Este indicador refleja cuánto esfuerzo real en mantenimiento (en horas-hombre o de máquina) requiere un activo para mantenerse operativo. Es decir, cuánta "intensidad" debemos aplicar para que el sistema funcione.
¿Por qué es tan valioso?
Hace visible lo invisible: Muchos equipos parecen confiables porque no fallan, pero requieren constantes ajustes, limpiezas, calibraciones o intervenciones menores. El IM captura ese esfuerzo que no siempre se refleja en las fallas.
Detecta desgaste encubierto: Si un activo aumenta su IM sin fallar más, probablemente está envejeciendo o está siendo sobrecargado silenciosamente.
Permite comparaciones más justas: No basta con saber si algo falla o no. Dos líneas de producción pueden tener el mismo MTBF, pero una requiere el doble de horas de mantenimiento. ¿Cuál es más eficiente realmente?
¿Por qué casi nadie lo usa?
Porque exige registros detallados y sistemáticos de horas de mantenimiento, algo que no todas las empresas hacen bien.
Porque no es glamoroso ni fácil de interpretar si no se contextualiza.
Porque aún priorizamos la reacción por sobre la comprensión estructural de los activos.
A lo que quiero llegar es que el IM no reemplaza a los grandes KPIs, pero los puede complementar con una mirada crítica y estructural. En un entorno donde buscamos eficiencia, sostenibilidad y optimización, no podemos darnos el lujo de ignorar cuánta intensidad estamos aplicando para mantener nuestro sistema en marcha.
Quizás es hora de poner este KPI olvidado en el centro de la conversación. Los escucho.
O uso de explosivos em operações de desmonte de rocha é essencial para diversos setores, como mineração, construção civil e obras de infraestrutura. No entanto, essa prática envolve riscos elevados e exige rigor absoluto na aplicação das normas de segurança.
🔒 Segurança não é opcional — é prioridade.
Acidentes envolvendo explosivos podem resultar em perdas humanas, danos ao meio ambiente e grandes prejuízos financeiros. Por isso, investir em boas práticas de manuseio, armazenamento e aplicação é indispensável.
💡 Boas Práticas para Aumentar a Segurança nas operações de Desmonte com Explosivos:
1. Planejamento e Projeto do Desmonte
Elaborar um plano de fogo detalhado, considerando a geologia, geometria da bancada e proximidade de estruturas.
Realizar estudos prévios de vibração e confinamento, especialmente em áreas sensíveis ou próximas a comunidades.
Dimensionar adequadamente os furos, a carga máxima por espera e os espaçamentos, para evitar sobre pressões e projeções perigosas.
2. Transporte e Armazenamento de Explosivos
Seguir as normas do Exército Brasileiro (DFPC) para o transporte (escolta, veículos adequados, documentação).
Armazenar os explosivos em paiol autorizado, com controle de temperatura, ventilação e segurança física.
Manter inventário rigoroso e registros atualizados de entrada, saída e uso dos explosivos.
3. Preparação dos Furos
Evitar contaminação com água, verificando o tipo de explosivo adequado (ex: emulsões resistentes à água).
Inspecionar furos antes do carregamento, verificando obstruções, colapsos ou instabilidades.
Carregar os explosivos com pessoal qualificado, usando ferramentas antiestáticas e EPI adequados.
4. Iniciação e Detonação
Estabelecer zonas de segurança e evacuação, com sinalização e barreiras físicas.
Fazer testes de continuidade e resistência elétrica dos sistemas de iniciação antes da detonação.
Garantir comunicação clara e comando único durante o processo de iniciação.
Utilizar sistemas de iniciação confiáveis, como detonadores eletrônicos em desmontes sensíveis.
5. Pós-desmonte
Realizar varredura completa para detecção de explosivos não detonados.
Avaliar os resultados do desmonte (fragmentação, projeções, vibração) para ajustar planos futuros.
Registrar e analisar ocorrências e quase-acidentes, promovendo a melhoria contínua.
6. Capacitação e Cultura de Segurança
Capacitar periodicamente os trabalhadores conforme NR-19 e regulamentações do Exército.
Reforçar a cultura de segurança e comunicação proativa, incentivando o relato de riscos e falhas.
Simular situações de emergência regularmente, garantindo preparo em caso de incidentes.
📌 Conclusão:
Promover a cultura da segurança nas operações de desmonte com explosivos não é apenas uma exigência legal, é uma responsabilidade coletiva. O cuidado com cada etapa do processo, desde o planejamento até a execução, é o que garante a proteção das pessoas, do patrimônio e do meio ambiente.
Our third post in the Management of Change in drilling and blasting looks specifically at changes in explosives product selection. We offer four case studies to demonstrate how we can affect these changes to achieve a desired outcome, and provide some tips for implementation.
When was the last time you re-evaluated your explosive product selection — and what results did you see?
We'd like to hear your experiences or challenges with changing products — what worked (or didn’t) at your site?
The world’s top 20 mining OEMs generated over $66 billion in mining and metals sales in 2024 — but with geopolitical uncertainty, shifting commodity demand, and the slow roll of electrification, the future looks anything but predictable.
From Komatsu, Caterpillar Inc. and Epiroc to rising Chinese players like SANY Group and XCMG Group these companies are facing the biggest industry reset in history — and the race to electrification is on.
While Sandvik and Liebherr Group are making strides in battery-electric tech, even leaders like Metso and Hitachi CM admit tariff turbulence and global decoupling could reshape market activity.
📉 With copper demand expected to rise 70% by 2050, but new projects facing delays, OEMs will play a pivotal role in keeping the supply chain moving.
View the full article in the comments. A must-read for anyone watching where mining equipment, innovation, and strategy are headed next.
Source: Credit to International Mining and Resources Conference (IMARC)
In mining, a Resource/Reserve model is more than just a technical deliverable—it’s a strategic asset.
From the boardroom to the pit, decisions hinge on the accuracy, clarity, and defensibility of that model. A robust geological model underpins resource confidence, guides mine planning, de-risks investment decisions, and, ultimately, protects shareholder value.
It's crucial to acknowledge that geological models are built on geostatistical estimation—not certainties. There will always be an element of uncertainty. That’s why transparency in the modelling process and deep technical understanding from geoscientists are critical. When technical professionals articulate assumptions, communicate limitations, and work collaboratively, the model becomes a reliable foundation for informed decision-making.
Dr Harry McDougal Parker, a pioneer in geostatistics, emphasised the importance of incorporating local geological controls and mining selectivity into resource models. He developed the use of conditional probability distributions to forecast recoverable resources—an approach still in use today . His work reminds us that embracing uncertainty through rigorous methods leads to better-informed decisions.
From a corporate perspective, we look for models that:
Clearly communicate uncertainty, not just tonnes and grade
Integrate across disciplines, aligning geology with mining, processing, and finance
Remain agile and auditable, adapting as new data comes in
Tell a story, one that both technical teams and executives can trust and act on
A great geological model doesn’t just inform—it empowers. It builds confidence, drives capital decisions, and helps deliver on strategy.
FYI- This is a common question I am asked by clients. What is the difference between a Resource and Reserve Model?
Resource Model: Represents the estimated quantity and quality of mineralisation in the ground, based on geological evidence and limited sampling. It includes Inferred, Indicated, and Measured categories, reflecting increasing levels of confidence—but it doesn’t yet consider economic viability or mine planning.
Reserve Model: A subset of the Resource model that has been assessed as economically mineable, incorporating modifying factors such as mining method, processing, costs, and environmental and legal considerations. Reserves are classified as Probable or Proved, reflecting higher confidence and a clear business case for extraction.
Source: Credit to Stephanie Bream, AMC Consultants
Drill and blast performance was always hot topic in decades past at underground mines. Today it feels like it has gone out of fashion somewhat, with efficiency KPI’s becoming the focus, especially in BI circles. Are we forgetting just how impactful 1% of overbreak can be in an underground stoping mine?
I get it… why chase 1% less overbreak when an improvement consultant has dangled promises of 10% efficiency gains in front of your face? I’ll save the discussion about these slated efficiency gains for another article, but lets really look at what 1% overbreak or underbreak means for a typical stoping operation in 2025.
While very hard to define an “average size UG operation” we’ll use for simplicity’s sake one with a yearly revenue of $500M. It’s pretty obvious that for every 1% underbreak, $5M is potentially lost, assuming it is never recovered (sterilised). It’s not that simple of course, but lets leave it there as a bit of a yard stick. 10-15% underbreak would not be considered an uncommon result for an operation mining stopes in the 10kt-100kt range, so we are talking about a lot of lost opportunity here, considering everything has already been spent to access and break the dirt.
Overbreak is far more complex to work out the cost of, though it can lead to far worse results than underbreak which has a more direct correlation to loss. For example, over breaking into ore of a comparable quality results a gain right? Well, maybe… Your average grade will be maintained in this instance, as long as you can restrict overbreak to the stope walls with ore contacts, a rarity. The flip side is overbreaking into waste, which can hit doubly hard. The old mantra of “Ore + Waste = More Ore” has some holes when we look at the costs associated.
In a mine which is production constrained (constrained by fleet capacity) every tonne of waste overbreak you bring up displaces a tonne of ore. This waste tonne then incurs the cost of haulage, grinding, separation and then takes up space in your tailings dam. In addition, as overbreak starts to artificially increase the amount of tonnes removed from the stope, delays to the sequence start to incur, which can range from un-impactful right through to a real pain in the date! Finally, overbreak leads to larger spans (Hydraulic Radii), and in some cases stope failure. Rarely will this be without impact and in the worst cases, this can destroy the value of a mining front.
What could this potential overbreak cost be? We lets say you are operating at a 20% (EBITDA) margin and your overbreak goes from a well controlled 10% to a slightly less controlled 15%. At 10% overbreak, your entire margin comes from the last 18% of the ore you mine. Once you add an additional 5% waste overbreak to this number and displace that metal from your year, margins drops disproportionately to 14.4%. This means you have effectively given up 27% of your free cashflow! Remember, total material mined for the year stays the same in this example, you have simply diluted the year's average grade by mining extra waste instead of panned ore. While this is a simplified example using the basic accounting skills of a mining engineer, it illustrates the point...
I’m preaching to the choir here if you are a professional underground drill and blast engineer. The issue in 2025 is that less and less of us are. Instead, engineers take a faster track to a senior role, with great tools making up for lack of learnt expertise (a common theme in my articles). The blame in my opinion does not sit with them however.
Engineers will take an interest in whatever the industry holds in high regard. Our senior leadership in the mining space sets the standard, not the engineer in the seat. If D&B KPI’s are rarely discussed, the team is under-resourced, the reward is comparatively low and there is a lack of great coaching, then it makes sense the role will be seen as a stepping onto “more important things”.
I believe great D&B expertise is the foundation of every great planning engineer. Furthermore, having the D&B nous to solve stoping challenges and unlock opportunities in a mine schedule, will take a scheduler from good to great. Thankfully, drill and blast is a well understood art, and there are many amazing engineers out there who can coach our newer generation on the fundamentals. We just need tech services and mining managers/superintendents to set a higher standard and provide the resources to coach our newer generations.
There are some fantastic companies and resources out there who do exactly this, and you can add Strategic Mine Planning Services to that list. If you would like help to elevate the game of your D&B team quickly and sustainably, please reach out. We love coaching our newer generation and seeing the fast results that come with it for the operations that invest in their people.
FREE OFFER! If you would like me to walk you through a case study where average overbreak and underbreak were reduced by almost 5% each, message me and lets line up a chat. It'll cost you nothing and you might get some real value from it.
Source: Credit to Joel Gray - Director, StrategicMPS
Navigating Precision in Drone Mapping 🌐✈️
Embarking on a mapping mission? 🗺️ Let's explore the pros and cons of three pivotal technologies: Ground Control Points (GCP), Real-Time Kinematics (RTK), and Post-Processed Kinematics (PPK). 🛰️💡
Ground Control Points (GCP):
Pros:
1-Absolute Accuracy: GCPs provide a benchmark for absolute accuracy, ensuring reliable georeferencing.
2-Versatility: Suitable for various mapping applications and projects of different scales.
3-Cost-Effective: Initial setup costs might be lower compared to some RTK/PPK solutions.
Cons:
1-Time-Consuming: Manual placement and surveying of GCPs can be time-intensive.
2-Logistical Challenges: Accessibility to GCP locations may pose logistical challenges in remote or rugged terrains.
3-Dependency on Surveyor Expertise: Accuracy heavily depends on the surveyor's expertise in placing GCPs.
Real-Time Kinematics (RTK):
Pros:
1-Real-Time Corrections: Provides real-time, centimeter-level accuracy during drone flights.
2-Reduced Ground Control Needs: Decreases the dependency on a dense network of GCPs.
3-Time Efficiency: Accelerates data collection with instant corrections.
Cons:
1-Limited Range: RTK requires a continuous connection to a base station, limiting operational range.
2-Signal Interference: Can be susceptible to signal interruptions in urban canyons or areas with dense vegetation.
3-Cost: RTK-enabled equipment tends to be more expensive than traditional setups.
Post-Processed Kinematics (PPK):
Pros:
1-Flexibility: Eliminates the need for real-time communication, allowing more flexibility in mission planning.
2-Centimeter-Level Accuracy: Achieves high accuracy through post-processing, comparable to RTK.
3-Reduced Dependency on GCPs: Minimizes the necessity for an extensive GCP network.
Cons:
1-Post-Processing Time: Requires additional time for post-processing, impacting real-time decision-making.
2-Equipment Cost: PPK-enabled drones and software may have a higher upfront cost.
3-Learning Curve: Mastery of post-processing workflows may be needed for optimal results.
Image credit: ageagle.com
You can explore more about world wide RTK services at: RTKdata.com
In the dynamic landscape of drone mapping, each technology has its role. Choose wisely based on project requirements, terrain, and budget. Let's elevate our mapping game! 🌐✨
¿𝗖𝗢́𝗠𝗢 𝗘𝗦𝗧𝗔́𝗦 𝗘𝗦𝗧𝗥𝗨𝗖𝗧𝗨𝗥𝗔𝗡𝗗𝗢 𝗟𝗔 𝗘𝗗𝗧 𝗗𝗘 𝗧𝗨 𝗣𝗥𝗢𝗬𝗘𝗖𝗧𝗢?
Una EDT (Estructura Desagregada del Trabajo) mal organizada puede complicar todo: la planificación, el control, los reportes y hasta los reclamos.
Pero si eliges correctamente su estructura, puedes facilitar la gestión del alcance, los costos y los entregables desde el inicio.
En esta infografía te muestro 5 formas efectivas de estructurar la EDT según el tipo de proyecto de construcción:
✔️ Por fases del proyecto (EPC)
✔️ Por áreas físicas
✔️ Por fases específicas
✔️ Por disciplinas técnicas
✔️ Por sistemas constructivos
📌 Cada una tiene su aplicación ideal. La clave está en adaptar la EDT a la lógica real del proyecto, no al revés.
Copper demand is projected to surge 70% by 2050, reaching 50 million tonnes annually. Meeting this demand will require significant investments in mining operations worldwide. Here's an updated look at the world's top copper mines and their recent developments:
1. Escondida (Chile) – 1.28Mt – BHP, Rio Tinto, Mitsubishi/JX
BHP just greenlit a $2B optimization project as part of a $10.8B plan.
2. Grasberg (Indonesia) – 816Kt – Freeport McMoRan, PT Mineral Industri Production is back on track after major weather setbacks last year.
3. Collahuasi (Chile) – 559Kt – Glencore, Anglo American, Mitsui
Slight dip in output, but solid long-term growth plans are in place.
4. Kamoa-Kakula (DRC) – 437Kt – Ivanhoe, Zijin, DRC gov, Crystal River
Achieved near-record output in March, powered by stable energy supply.
5. Buenavista (Mexico) – 433Kt – Southern Copper
Expanded forecast for 2024, backed by new projects and upgrades.
6. Cerro Verde (Peru) – 430Kt – Freeport, Buenaventura, Sumitomo
Freeport increased its ownership stake mid-2024.
7. Antamina (Peru) – 413Kt – Glencore, BHP, Teck, Mitsubishi
Undergoing a $2B extension project to keep production going through 2036.
8. Tenke Fungurume (DRC) – 400Kt – CMOC, Gécamines
Capacity now up to 450Kt copper and 37Kt cobalt after 2023 expansion.
9. KGHM Polska Miedź (Poland) – 395Kt – KGHM
Delivered 3% YoY production growth and strong financials.
10. Polar Division (Russia) – 345Kt – Norilsk Nickel
Output up 6.3% in 2024 with stable operations across key metals.
With supply risks and geopolitical pressure building, this list is only getting more relevant.
Source: https://www.mining.com/featured-article/ranked-worlds-biggest-copper-mines/
When Neil Armstrong took that first step on the Moon in 1969, over 600 million people watched. It wasn’t just a technological breakthrough but a masterclass in human storytelling. NASA didn’t simply launch astronauts into space. They launched a narrative of courage, innovation, and shared vision. And the world listened.
Today I ask myself: Why hasn’t mining, an industry that powers nearly every modern advancement, received the same recognition, curiosity, or admiration?
Mining makes the modern world possible: electric vehicles, solar panels, wind turbines, mobile phones, and medical technology. They all rely on mined materials. Yet, the public conversation around mining still lacks inspiration, context, and connection.
=> We’ve focused on operations, not on storytelling.
-------
=> A new opportunity for mining engineers: sharing stories grounded in truth
For years, mining has been discussed by voices outside the industry, journalists, politicians, marketers, and even lawyers and investors who’ve never stepped onto a site. Some have done well, and others have completely missed the mark.
As mining professionals, we know what it’s like to walk into a decline at 4 a.m., lead a crew in 40-degree heat, and juggle safety, performance, and sustainability at the coalface. We’ve seen breakthroughs and breakdowns, the impact on communities, and the transformation in and beyond the mine.
That lived experience is powerful – and it’s time we share it.
A new space is opening for technical professionals to move into mining marketing and communications, not by abandoning our expertise, but by amplifying it through honest, technical storytelling.
=> Because people aren’t inspired by data alone – they’re moved by connection.
-----
=> Mining marketing isn’t a luxury. It’s a strategic priority.
Let’s be honest: our industry is facing a trust gap. Community resistance, ESG scrutiny, and a talent shortage are symptoms of a deeper issue: People don’t understand what we do, and we haven’t taken the time to explain it properly.
A 2023 report by McKinsey & Co. found that industries with stronger storytelling and public engagement attract more investment and talent. EY’s 2021 findings were clear: mining is still seen as traditional, slow to change, and disconnected from purpose – even as we lead some of the planet's most complex innovation and transformation efforts.
And this isn’t just about the general public. Lawyers, regulators, and investors also need stories that help them understand our challenges, vision, values, and risk profiles with greater clarity and trust.
We can no longer afford to let others define our narrative. It’s time to invest in mining marketing with the same seriousness as in safety, ESG, and production.
----
=> Engineers must lead this change
Who better to explain the complexity of decarbonising a fleet, or the strategic importance of critical minerals, than the people doing the work?
We need mining engineers who speak both geology and humanity. Who can translate a mine plan into a purpose? Who can explain what’s inside the orebody, but also what’s inside the hearts of the people driving our industry forward?
This isn’t about oversimplifying. It’s about building a bridge between the mining world and diverse audiences – communities, students, policymakers, journalists, lawyers, and investors.
As someone who’s worked in underground and open-pit mines across Australia and Latin America, I’ve seen the shift that happens when we take ownership of our story, not just the technical version but the human one.
----
=> What if mining had its own “Apollo moment”?
The Apollo mission united people through science and hope. What if we could do the same for mining? What if our mission was not only to power the energy transition, but also to inspire the next generation, and build trust with those who fund, regulate and advocate for the future of mining?
We can, but only if we step out from behind our spreadsheets and start sharing what we do with purpose, clarity, and heart.
Let’s talk about the dust. The long swings. The pride of a safe blast. The women changing the face of our industry. The innovation behind block caving. The community now has access to power because of a nearby mine. Let’s talk about what mining truly is.
----
=> The road ahead
This isn’t a communications trend. It’s a shift in leadership. Mining needs more authentic, technical, relatable voices – people who can speak from lived experience and bring the real story of mining to life.
We’re not here to sugarcoat. We’re here to reshape the narrative with strategy, humanity, and truth.
So the next time a student, journalist, lawyer or investor asks: “What do miners do?” Let’s make sure they don’t have to guess or Google it. Let’s make sure they hear it directly from us.
Just like the moon landing, mining is full of stories worth telling.
And maybe–just maybe-the world is ready to listen.
📬 Thanks for reading this edition of Mining Insights. Please share it with someone who needs to hear the real story of mining.
________________________________________
✧ References:
• McKinsey & Company (2023). "Winning in the era of ESG: How mining can build trust."
• EY (2021). "Top 10 business risks and opportunities for mining and metals."
• NASA Archives (1969). Apollo 11 Mission Report.
• Harvard Business Review (2020). "The Science of Storytelling: Why Stories Make Us Human and How to Tell Them Better."
• International Council on Mining and Metals (ICMM). Responsible Mining Framework (2022)
At the mine, we used to think in minutes even bigger like hour, shift, daily. Then we learned to think in seconds after Fleet Management System been implemented.
When the FMS breakdown of a 24-minute haul cycle was first seen:
🎯 Waiting = Queuing: 90s
🎯 Spotting: 30s
🎯 Loading: 120s
🎯 Hauling: 675s
🎯 More waiting = Queuing: 15s
🎯 Maneuvering: 15s
🎯 Dumping: 15s
🎯 Returning: 491s
Those 15-90 second loss that everyone accepted as normal were almost missed.
Each "just 15-90 seconds":
🔻 Cost 1.5 cycles per truck daily
🔻Meant 63 m³ left unmoved every shift
🔻Added up to 37,800 m³ annually per truck
Suddenly, seconds weren't so small anymore.
We can optimize that using Fleet Management System:
45s saved by optimizing haul routes
15s saved through better spotting
30s reclaimed by eliminating unnecessary stops
The Lesson Learned
Productivity isn't about heroic efforts - it's about:
🔼Seeing what's invisible (until measured)
🔼Fixing what's "too small to matter" (until it does)
The difference between good and great operations isn't measured in hours or minutes - it's counted in seconds that nobody notices... until someone starts counting.
cr picture :Chaowasakoo, Patarawan & Seppälä, Heikki & Koivo, Heikki & Zhou, Quan. (2017). Digitalization of mine operations: Scenarios to benefit in real-time truck dispatching. International Journal of Mining Science and Technology. 27. 10.1016/j.ijmst.2017.01.007.
An integrated strategic plan for mine technical services should encompass several key components to ensure efficient and sustainable operations. Here are some essential elements:
1. Resource and Reserve Management:
Accurate geological modelling and resource estimation.
Regular updates to the mineral resource and reserve statements.
2. Mine Planning and Design:
Long-term and short-term mine planning.
Optimisation of mine design to maximise resource extraction and minimise costs.
Incorporation of environmental and safety considerations.
3. Operational Efficiency:
Implementation of best practices in drilling, blasting, loading and hauling.
Use of technology and automation to improve productivity and reduce operational costs.
4. Risk Management:
Identification and mitigation of technical risks.
Development of contingency plans for potential operational disruptions.
5. Sustainability and Compliance:
Adherence to environmental regulations and standards.
Implementation of sustainable mining practices to minimise environmental impact.
6. Stakeholder Engagement:
Regular communication with stakeholders, including local communities, government agencies and investors.
Transparent reporting on operational performance and sustainability initiatives.
7. Continuous Improvement:
Regular review and improvement of processes and practices.
Investment in research and development to stay ahead of industry trends and innovations.
By integrating these components, mine technical services can align their operations with strategic goals, ensuring long-term success and sustainability.
References
1. The role of mine planning in high performance - AusIMM ausimm.com
2. Strategic Mine Planning minemax.com
3. Integrated Strategic Planning for Mining - Whittle Consulting whittleconsulting.com.au
El cargador frontal CAT 966 es una herramienta esencial en la minería a cielo abierto, desempeñando un papel clave en la carga, transporte y manipulación de materiales pesados. Para garantizar su uso seguro y eficiente, aquí te comparto sus principales funciones, medidas de seguridad y recomendaciones:
💼 **Funciones principales**
✅ **Carga y transporte:** Retira material del frente de carga y lo deposita en camiones o tolvas.
✅ **Excavación y nivelación:** Ideal para mover tierra y nivelar superficies.
✅ **Manipulación de materiales pesados:** Su cuchara robusta permite manejar grandes volúmenes de material de forma eficiente.
🛡️ **Medidas de seguridad imprescindibles**
✔️ **Inspección previa:** Asegúrate de que el equipo esté en óptimas condiciones antes de operar.
✔️ **Visibilidad y iluminación:** Verifica las luces de trabajo y la iluminación del área.
✔️ **Acceso seguro:** Utiliza siempre la técnica de tres puntos de apoyo al subir y bajar del equipo.
✔️ **Evaluación del entorno:** Considera el terreno y las condiciones climáticas antes de iniciar la operación.
✔️ **Mantenimiento preventivo:** Mantén un registro estricto de mantenimiento y detén la operación ante fallas críticas.
📌 **Recomendaciones para una operación eficiente**
🔹 **Capacitación:** Solo personal habilitado debe operar el equipo.
🔹 **Distancias de seguridad:** Respeta los espacios adecuados para prevenir accidentes.
🔹 **Control de fatiga:** Implementa relevos y monitorea el estado físico del operador.
🔹 **Carga adecuada:** No excedas la capacidad máxima y verifica el tamaño del material antes de cargar.
💡 **Consejos clave para operadores**
🔧 Realiza inspecciones previas: Revisa neumáticos, niveles de aceite, frenos y luces antes de comenzar.
🪑 Ajusta el asiento: Mantén una postura cómoda y segura durante la operación.
📦 Evita sobrecargas: Protege el equipo y reduce riesgos.
⚙️ Usa técnicas eficientes: Carga el material de forma uniforme para mejorar la estabilidad.
🚦 Respeta las normas de seguridad: Usa cinturón, controla la velocidad y evita maniobras bruscas.
📚 Capacitación continua: Actualízate con las mejores prácticas y tecnologías aplicadas.
👀 Monitorea el entorno: Mantén una visión clara del área de trabajo y comunica tus movimientos.
El cargador frontal CAT 966 no solo es una herramienta de gran capacidad, sino también una pieza que requiere habilidad, conocimiento y compromiso con la seguridad. ¿Qué otras prácticas agregarías para optimizar su operación?
1. Con Puntos de Control en Tierra (GCPs).
Precisión: Alta precisión absoluta (centimétrica).
Uso de GPS RTK/PPK: Complementa o refuerza la precisión.
Aplicaciones: Topografía, Catastros, Obras Civiles, Ingeniería.
Ventajas: Mayor confianza en la georreferenciación y mejores resultados.
Desventajas: Requiere más tiempo en campo y equipo GNSS.
2. Sin Puntos de control en Tierra (Solo GPS del dron)
Precisión: Relativa aceptable, pero baja precisión absoluta.
Uso del GPS del dron: Dependencia total del GPS embarcado, es decir sin correcciones.
Aplicaciones: Agricultura, monitoreo visual, inspecciones rápidas.
Ventajas: Más rápido menos equipamiento en campo.
Desventajas: Error absoluto puede ser de varios metros depende del GPS del dron.
¿ Por qué es importante esta diferencia?
* Proyectos de ingeniería necesitan precisión absoluta para posicionar estructuras con exactitud.
* En monitoreo periódico si no hay GPS, los modelos pueden no coincidir espacialmente entre campañas.
* El uso del GCPs reduce el error en el procesamiento fotogramétrico (RMS), especialmente en zonas con más señal GNSS.
"Veni, vidi, vici." in english: "I came, I saw, I conquered." - Julius Caesar.
Carefully observing your blast is an important action you can take to understand what really happened in the ground. Without this critical step you might not ever know what went wrong or how to fix it in your next blast.
𝐈𝐦𝐩𝐨𝐫𝐭𝐚𝐧𝐜𝐞 𝐨𝐟 𝐂𝐮𝐭-𝐨𝐟𝐟 𝐆𝐫𝐚𝐝𝐞 𝐭𝐨 𝐌𝐚𝐱𝐢𝐦𝐢𝐬𝐞 𝐌𝐢𝐧𝐢𝐧𝐠 𝐏𝐫𝐨𝐟𝐢𝐭𝐬 & 𝐒𝐮𝐬𝐭𝐚𝐢𝐧𝐚𝐛𝐢𝐥𝐢𝐭𝐲 – 𝐇𝐨𝐰 𝐈𝐧𝐝𝐢𝐚𝐧 & 𝐆𝐥𝐨𝐛𝐚𝐥 𝐌𝐢𝐧𝐢𝐧𝐠 𝐢𝐧𝐝𝐮𝐬𝐭𝐫𝐲 𝐨𝐩𝐭𝐢𝐦𝐢𝐬𝐢𝐧𝐠 𝐢𝐭??
Cut-off Grade is the key to balancing profitability, resource utilization, and sustainability in mining. From Coal India’s opencast mines to NMDC’s iron ore strategy, setting the right cut-off grade ensures long-term success. Adjusting cut-off grades can impact NPV by ±5-16%, depending on production scale and ore type. Smart cut-off strategies mean higher revenues, lower costs, and sustainable operations.
Global giants like BHP, Rio Tinto, and Newmont are using AI-driven cut-off grade optimization. Artificial Intelligence & Machine Learning are revolutionizing mining; Real-time grade control, predictive analytics, and automation can boost mine efficiency by 25% and reduce dilution losses by 18%. In Indian Mining scenario, from Hindustan Zinc Limited (HZL) to JSW Steel, mining giants are using dynamic cut-off grade adjustments to stay competitive.
This presentation covers various factors impacting development cost estimation, including the impact of assumptions on unit rates and strategies for cost reduction using innovative technologies.
Source: https://www.srk.com/en/publications/development-cost-for-miners-understanding-managing-mine-costs
In the March issue of North American Mining magazine, I asked how underground mines can achieve the best in mine ventilation. Key takeaways 👇
Maintaining consistent airflow and climate is an ever-moving target. As mines advance and work deeper, the system resistance increases, reducing volumetric flow if all other things remain equal.
Hazardous gases require continuous monitoring and adjustment of ventilation systems to ensure safe levels and allow prompt re-entry after blasting to minimize downtime.
Heat generated by mining equipment and mine depth significantly impact the climate. If a hot mine also struggles to maintain airflow, maintaining proper temperatures will be an uphill battle.
Mining operations often do not implement a big enough fan to handle growing requirements as the mine advances. When designing a ventilation system, the design should meet maximum needs - and add some.
Other factors to consider in ventilation design include mine size and layout, mining method and machinery, worker safety regulations, and the size and placement of ventilation shafts.
Technologies like VFDs and geofencing allow mines to tailor the ventilation system for real-time conditions, cutting operating costs, ensuring a safe and comfortable working environment, and reducing a mine’s carbon footprint.
Thanks to all my experts for guiding me through this topic:
Jonathan Griffith, PE, and Tomas Otterberg at Epiroc
Jose Pinedo at Howden, A Chart Industries Company
Todd Elswick at Paul's Fan Company
Kim Trapani at Stantec
Are you interested in reading more like this? The APRIL issue of North American Mining is out now. Check out a link to the magazine in the first comment.
Source: Credit to Jonathan Rowland, North American Mining
In open pit mines there is often a substantial difference between what is finally produced compared to what was originally planned. This difference is real and expected because our knowledge about the orebody is not complete until it is fully mined.
The quality of reconciliation reports depends on the quality (and quantity) of measurements we take throughout the value chain. A good practice is to build numerous measurement points throughout the line of production so that the information can be tracked with confidence. Many numbers used in reconciliation reporting are estimates that come with an associated margin of error.
It is important to minimize that margin of error through multiple measurements. Remember the only real number is the money in our bank account. While there are some general publications about reconciliation guidelines, there is no generic guideline for the mining industry.
In the author’s opinion, every mine must develop its own site-specific guideline that addresses the complexity of its orebody and the measurement capabilities installed on the site. And remember the reconciliation reporting in a mine is a process that needs time to mature.
Source: https://www.srk.com/en/publications/reconciliation-explained-and-solutions-recommended
Many leaders struggle with coaching their people “in the moment” fearing their team members will perceive that they’re being micromanaged, hovered over, or their boss is trying to catch them doing something wrong.
Leaders don't always see the fine line that exists between "micromanaging" a team member or "working with and helping" one.
The ability of a leader to coach their people "in the moment" is not only a desirable trait; today more than ever, it's an essential way to effectively lead a team.
What we've learned is that newer generations, now populating the workforce, prefer being coached in real time, rather than having to wait for a one-on-one session or a once-a-year, staged performance review with their manager.
Coaching in the moment involves providing immediate feedback, guidance, and support to team members as situations arise. The importance of this real-time coaching can’t be overstated, as it builds on continuous learning and improvement, enhances productivity, and works to develop stronger relationships.
Immediate intervention prevents small issues from growing or escalating and helps individuals course-correct before problems becomes larger or bad individual habits form.
As a result, teams "coached in the moment" operate more efficiently, meet deadlines and achieve goals with greater ease.
In-the-moment coaching shows that their leader cares and is committed to each team member’s success. By taking the time to engage with people in real-time, leaders show they are invested in their people's growth and well-being, a proactive approach that builds trust and opens up communications.
From a leader’s perspective, in-the-moment coaching enables them to tailor their guidance to the specific needs and work circumstances of each team member. Coaching of this nature provides contextually relevant feedback where leaders can offer their personal experiences as examples of what they have done in similar situations.
These interactions also demonstrate authenticity, letting team members know that challenges and issues are a part of growing on-the-job, experienced by the best of all team members.
By consistently providing feedback and recognition in real-time, leaders help team members make habits of the right behaviors and make decisions in line with company values and performance standards.
Over time, this ongoing reinforcement encourages a leadership and teamwork mindset, where individuals are inspired to put the organization first and to achieve more as an individual.
Coaching-in-the-moment is not about “fixing people” or lurking over people in “search of a crime.” It's practical leadership that appeals to generational workers who will be critical to our success over the next several decades.
Do you coach in the moment? Do you do it in ways that make it a consistent part of how you manage and lead others?
The VOD concept is one of the key energy-saving principles in underground mine ventilation systems, and it can be applied across all mining commodities. VOD refers to the ability to deliver airflow specifically to the underground areas that require it. In other words, airflow is supplied only to the areas in need, while areas that do not require ventilation receive reduced airflow—or none at all. By implementing this principle, energy consumption from auxiliary fans can be significantly reduced.
VOD consists of several levels of control strategies:
User Control or Manual Control
All ventilation devices—such as main fans, auxiliary fans, dampers, regulators, etc.—are operated manually.
Time-Based Scheduling
The second control strategy is time-based scheduling, which refers to the concept of triggering different setpoints for fans, regulators, and doors based on time inputs in accordance with a predefined schedule.
Activity-Based Control
The third strategy is activity-based control, as described by Tran-Valade and Allen (2013). This strategy is defined as the "automatic triggering of pre-defined actions in response to configured events." It can be summarized as an event-triggered function based on alternative inputs other than timers or environmental variables, each of which forms its own category. Similar to time-based scheduling, this control strategy applies the same event-triggering principle but is based on any available variable that can be integrated into the software.
Tagging and Tracking
This strategy requires the implementation of tag-and-tracking systems, with communication components integrated into the ventilation software. Airflow distribution in the mine is determined based on the location of personnel and equipment, as well as predefined rules for calculating the required airflow for each.
Environmental-Based Control
The fifth strategy is environmental-based control, which involves automated ventilation system adjustments based on real-time environmental data. This may include various sensor inputs such as gas, dust, diesel particulate matter (DPM), temperature (heat stress), etc., assuming that such sensors can operate underground and provide real-time data.
Several components are needed to implement this principle effectively.
🚀 The cut-off grade is a key parameter in mining, defining the minimum concentration of a valuable mineral or metal required for material to be processed profitably. It separates Ore (economically viable material) from waste (non-viable material). Here’s why it’s so important:
1️⃣ Economic Viability
🔹 Ensures only profitable material is processed.
🔹 Balances mining, processing, and refining costs against revenue from selling the extracted commodity.
2️⃣ Resource Optimization
🔹 Maximizes the value of extracted resources by focusing on higher-grade material.
🔹 Reduces unnecessary extraction and processing of low-grade material, saving costs and resources.
3️⃣ Mine Planning & Design
🔹 Influences pit design, production scheduling, and reserve estimation.
🔹 Determines the mine’s life and total economically viable ore tonnage.
4️⃣ Profit Maximization
🔹 Adjusts based on market conditions (e.g., metal prices, processing costs).
🔹 Lower cut-off grades during high prices allow processing of lower-grade material; higher cut-off grades during low prices focus on high-grade material.
5️⃣ Environmental Impact
🔹 Minimizes waste material, reducing storage and handling needs.
🔹 Lowers energy consumption and greenhouse gas emissions by avoiding low-grade material processing.
6️⃣ Financial Reporting & Valuation
🔹 Classifies mineral resources and reserves, critical for investor and regulatory assessments.
7️⃣ Risk Management
🔹 Mitigates risks from fluctuating commodity prices, cost changes, and ore quality uncertainties.
🚀 Factors Influencing Cut-Off Grade:
🔸Commodity prices: Higher prices justify lower cut-off grades.
🔸 Processing costs: Higher costs require higher cut-off grades.
🔸 Mining costs: Deeper or complex deposits may raise cut-off grades.
🔸 Recovery rates: Efficient processing lowers cut-off grades.
🔸 Market demand: Changes in demand impact economic viability.
✅ In summary, the cut-off grade is a dynamic, essential tool in mining, balancing economic, technical, and environmental factors to ensure profitability and sustainability.
A great blast starts long before the first hole is drilled. Proper blast design ensures efficient rock breakage, cost control, and—most importantly—safety.
Let’s break down the core elements every engineer should master.
⸻
🔹 Key Elements of Blast Design (with Formulas)
1️⃣ Burden & Spacing
• Burden (B): Distance from blast hole to free face.
• Spacing (S): Distance between adjacent holes.
Formulas:
• B = K × D
• S = (1.2 to 1.5) × B
Where:
• K is a rock constant (typically 25–35)
• D is hole diameter (in mm)
✅ Example: For a 100 mm hole and medium hardness rock → B = 3 m, S ≈ 3.6 to 4.5 m
2️⃣ Hole Diameter & Depth
• Depth = Bench Height + Subdrilling
More depth = better floor control and fragmentation.
3️⃣ Stemming Length
• Inert material (like crushed stone) used to confine explosive energy.
Formula:
• Stemming = (20 to 30) × D
✅ For 100 mm holes, stemming length = 2 to 3 m
4️⃣ Subdrilling
• Additional drilling below bench floor to avoid toe problems.
Formula:
• Subdrilling = (0.2 to 0.3) × Bench Height
5️⃣ Initiation Timing
• Delays between holes and rows improve fragmentation and reduce vibration.
✅ Typical values:
• 25–50 ms between holes
• 50–100 ms between rows
⸻
📌 Why It Matters
✔ Prevents overbreak and flyrock
✔ Increases safety and control
✔ Optimizes loading and hauling
✔ Reduces total blasting cost per ton
⸻
Pro Tip from the Field:
Always adjust your design based on geological structure, rock hardness, moisture, and proximity to structures.
⸻
Coming Up Next:
✅ Lesson 6: Environmental & Safety Considerations
✅ Lesson 7: Common Issues & Solutions
✅ Lesson 8: Case Study – Real blast pattern breakdown
Explosives play a crucial role in mining operations, breaking solid rock formations to facilitate mineral extraction. Choosing the right type directly impacts efficiency, safety, and cost.
⸻
🔹 Types of Explosives Used in Mining
1️⃣ Dynamite
🔹 Composition: Contains nitroglycerin and absorbent materials.
🔹 Usage: Used for hard rock and tunneling operations.
🔹 Advantages: High detonation power.
✅ Example: Underground blasting and tunnel excavation.
⸻
2️⃣ ANFO (Ammonium Nitrate Fuel Oil)
🔹 Composition: A mix of ammonium nitrate and diesel fuel.
🔹 Usage: Commonly used for large-scale surface blasting.
🔹 Advantages: Low cost, easy to handle, and efficient.
✅ Example: Open-pit mining operations.
⸻
3️⃣ Emulsion Explosives
🔹 Composition: A blend of water, oil, and oxidizers.
🔹 Usage: Suitable for wet conditions and underwater blasting.
🔹 Advantages: Safe to handle and can be pumped into blast holes.
✅ Example: Blasting in wet or underwater environments.
⸻
4️⃣ Slurry Explosives (Water Gels)
🔹 Composition: A gel-like mixture with oxidizers and fuel.
🔹 Usage: Used in deep mining and water-saturated areas.
🔹 Advantages: Flexible application with adjustable strength.
✅ Example: Deep well drilling and underground mining.
⸻
📌 Key Factors in Explosive Selection
✔ Velocity of Detonation (VOD): Determines energy transfer within the rock.
✔ Density: Affects explosive power and rock fragmentation.
✔ Water Resistance: Critical for wet environments.
✔ Fume Characteristics: Important for safety, especially in tunnels.
⸻
🔹 Summary: Choosing the right explosive depends on rock type, site conditions, and safety requirements to ensure effective and controlled blasting.
Through engaging workbook activities and videos, this Presentation Skills session aims to walk students through the process of how to plan, prepare, practice, and present powerful presentations; students will utilize the information in this workbook every time they need to create a presentation.
Source: Credit to Johns Hopkins, Carey Business Shool
1. Optimiser l’exploitation minière
• La planification permet de définir la séquence optimale d’extraction (ordre dans lequel on extrait les différentes zones du gisement).
• Avec les outils numériques, les ingénieurs peuvent simuler plusieurs scénarios pour maximiser la rentabilité tout en tenant compte des contraintes géotechniques, environnementales et logistiques.
• Outils utilisés : logiciels d’optimisation minière et les algorithmes d’optimisation.
2. Planification en temps réel grâce aux données IoT
• Grâce aux capteurs déployés partout dans la mine (camions, foreuses, convoyeurs), la planification peut être ajustée en temps réel.
• Par exemple, si une machine tombe en panne ou si une zone devient instable, le système propose une replanification dynamique pour éviter les arrêts de production ou les incidents.
3. Réduire les coûts et les temps d’arrêt
• Une bonne planification permet de limiter les déplacements inutiles des machines, d’optimiser le transport du minerai, et de réduire l’utilisation d’énergie.
• Exemple : la planification 4.0 ajuste les horaires des camions autonomes pour éviter les embouteillages sur les pistes d’accès à la mine.
4. Intégration des contraintes de durabilité
• Dans le Mining 4.0, la planification prend aussi en compte des critères environnementaux : réduction de l’empreinte carbone, gestion des déchets, minimisation des impacts sur l’écosystème.
• Cela permet de répondre aux exigences de plus en plus fortes en matière de responsabilité sociétale (RSE).
5. Planification multi-échelles (court, moyen et long terme)
• Long terme : prévoir la durée de vie de la mine (Life of Mine Planning), les investissements et la stratégie globale d’extraction.
• Moyen terme : organiser l’exploitation par phase sur plusieurs mois ou années.
• Court terme : ajuster au quotidien les opérations en fonction des conditions du terrain, des performances des machines et des objectifs de production.
6. Simulation et prévision avec l’IA
• Grâce à l’intelligence artificielle et au machine learning, les systèmes peuvent simuler l’évolution de la mine et prévoir :
• L’évolution des coûts.
• La disponibilité des équipements.
• Les risques de non-respect des délais.
• L’impact d’événements imprévus (panne, météo, conditions géotechniques).
7. Collaboration entre départements
• Dans le Mining 4.0, la planification devient un outil centralisé et partagé entre tous les départements : production, sécurité, logistique, environnement.
• Les plateformes cloud permettent à chaque service d’accéder aux données en temps réel et de contribuer aux décisions.
In the annual publication "WORLD MINING DATA" production figures of 65 mineral commodities from 168 countries are summarized and statistically evaluated. This information is available in tabular form. Production of mineral commodities is listed in detail by continents, country groups, development status, per capita income, economic blocks, political stability of producing countries, largest producers and others. Production of mineral commodities is also listed by producer countries.
World Mining Data thereby provide an indispensable basis for commodity forecasts and activities in minerals policy at national and European level.
Source: https://www.world-mining-data.info/
Source: Credit to the Austrian Federal Ministry of Finance (BMF)
Mine Surveying Notes are crucial for maintaining accurate records of mine workings, essential for safety, efficiency, and profitability, encompassing measurements, calculations, and mapping of the mine's layout
Here's a breakdown of what mine survey notes entail:
=>Purpose of Mine Survey Notes:
Safety:
Identifying potential hazards, ensuring safe passage and ventilation, and supporting emergency planning.
Efficiency:
Optimizing mining operations, planning new workings, and ensuring efficient ore extraction.
Profitability:
Accurate mapping and resource estimation contribute to better planning and resource utilization, ultimately increasing profitability.
Legal Compliance:
Providing documentation for regulatory bodies and demonstrating adherence to safety standards.
Technical Support:
Providing data for mine planning, design, and production(mining), as well as for monitoring and maintenance.
=>Key Elements of Mine Survey Notes:
- Measurements: Recording distances, elevations, and angles within the mine workings.
- Calculations: Determining coordinates, areas, and volumes based on measurements.
- Mapping: Creating detailed plans and maps of the mine layout, both underground and surface.
- Reporting: Compiling and presenting survey data in a clear and organized manner.
- Documentation: Maintaining a comprehensive record of all survey activities, including dates, personnel, and methods used.
=> Specific Example of Mine Survey Notes:
Tunnel Survey: Measuring the length, width, and height of tunnels, as well as their alignment and position.
Sources:
Merrete surveys
ResearchGate
Implicit geological modeling is here to stay. But it’s not the only thing geologists need.
Collecting comprehensive sampling and geoscience data from the field is the first step in an exploration or mining company’s quest to define the location, shape, and grade of an orebody.
After that, the operation must transform their geoscience information into reliable geological models of the subsurface. Traditional explicit modeling methods do a great job of this, by providing geologists with the tools to visualize and build their unique interpretation of the deposits’ geology down to the smallest detail.
Over recent years, implicit geological modeling methods and solutions have spread through the industry and proved they are here to stay, largely in part due to ease of use, speed and intelligence.
Whether implicit modeling techniques generate better results than explicit methods remain a topic of discussion. Ultimately, both modeling methods are tools, and like any tool, in the wrong hands, they can be misused. The ability of a geologist to make a model that accurately reflects and represents in-ground conditions is still determined by the skill, knowledge, and due diligence of the individual geologist, combined with adequate field observations and data support, as it should be.
For several years now, implicit geological modeling has been gaining ground on the highly trusted and widely used explicit geological modeling methods. There are good reasons for that. The below list outlines some of the clear benefits from implicit modeling. In the below example, the comparison is made between GEOVIA’s Surpac (explicit) and Geology Modeler (implicit) solutions.
- Speed – generate complex geological models in minutes.
- Automation – build models in an automated way, saving time and making the process auditable and repeatable.
- Accessibility – geology model generation is not dependent on a single individual user, anyone within a team can update a setting, or add new data, and update the model.
- Traceability – geology model revisions capture and retain modifications over time. This provides geologists with the capability to capture settings, input data, and decisions made for each model generated, which in turn allows for excellent traceability and auditability. This provides geologists with confidence the geology model has been generated using the right data.
- Integration – Modern implicit modelling tools can integrate with other platforms used across the business, which improves data security, management, and accessibility within other business processes (such as revision and lifecycle management, task management, issue management, risk management, or project management). In this example, GEOVIA Surpac and the Geology Modeler integrate with Dassault’s 3DEXPERIENCE platform.
Explicit models are accurate and reliable. But they are often created using repetitive manual processes; as such they can be difficult to update when new data is supplied. This makes them time-consuming and difficult to work with when responding to changing business objectives or operational demands. It can take hours and sometimes days for a geologist to digitise all their wireframes, create the meshes, make sure those meshes are valid, and then use them in block modeling processes.
An implicit geological modeler helps geologists automate that process, which in turn makes the process much faster, as well as fully traceable and repeatable. By reducing the amount of manual work geologists are now doing, an implicit solution gives them more time to spend in the field interpreting the geology or reviewing their data to better understand the genesis and evolution of a deposit.
=> The benefits of implicit modelling in more detail
Radial Basis Function (RBF)
Implicit modelling is a process where a continuous mathematical representation of an attribute is determined across a volume. This approach requires minimal interaction from the geologist and the computational calculations drastically reduce the amount of time it takes to perform the modelling. This approach means model generation can typically be completed in seconds or minutes. This is an improvement across orders of magnitude when compared to explicit modeling methods applied to identical data.
The Radial Basis Function algorithm (RBF) is well known throughout the mining industry today for its use and adoption in implicit modelling. It has quickly become the go-to algorithm for building implicit geology models. This algorithm defines how each point in 3D space is interpolated based on the cloud of input data points. It is well-known that RBF is well suited to multivariate interpolation with scattered data. It allows us to fit all input source points, and generate a smooth surface, it also works well with a non-uniform set of data points and provides good extrapolation results. There are many implicit geological modelling solutions available based on this approach; however, at GEOVIA we have developed our own algorithms to improve RBF and make it even faster.
Data management
An accurate and representative geology model is only as good as the data that feeds into it. This reminds me of the phrase ‘rubbish in, rubbish out’, and it’s certainly no different with geology models. Diligent and robust data management and validation practices are essential in ensuring accurate, reliable, and representative geology models.
Geologists must manage the mass of geoscience data collected by geoscientists, engineers, consultants, and contractors. This includes drillhole records, geological, and geophysical field observations, geochemical, lithological, and remote sensing data, assays, etc.
Many exploration and mining companies today work with explicit modelling software that often uses a file-based approach, where data and files are stored in folders locally on the user’s machine or file servers. This traditional data management tends to be slow, subject to human error, and as a result often causes rework or delays.
A business enterprise platform, leveraging a unified data model, either on-cloud or on-premises, provides a secure central data repository where geologists can store geoscience and mining data in any format, structured or unstructured. From there, all geoscience data, along with all other data, such as parametric mine designs, pit optimizations, infrastructure, simulations, land use, etc. – will become part of a unified data model where one data source will always speak to another, and all data is interconnected and relational. Whenever a new piece of data arrives in the repository, it is updated across the platform.
The best of both worlds – gaining greater control through harnessing the power of explicit and implicit modelling
Implicit modelling methods can also leverage data and benefit from pre-existing explicit geology models to give geologists a better representation of the sub-surface environment.
For example, the GEOVIA Geology Modeler can give control back to geologists in the following ways:
- Constraint lines – associate or digitise polylines to support the available borehole data and realise desired outcrop patterns or cross-sectional interpretations within an implicit geology model.
- Explicit intrusions/orebodies – associate explicit solids to gain explicit control over high-priority domains while still implicitly modeling surrounding geology and structures.
- Pinch-outs – globally control the taper of a pinch-outs.
- Structural measurements – utilise downhole structural measurements to better model faults or folded deposits.
- Dynamic isotropy and trend surfaces – quickly model the changeable geomorphology of orebodies and/or intrusions.
These features and more, make for a comprehensive implicit geology modeling approach, which makes it possible for geologists to revise and refine models until they generate the exact model that they need, within an automated and repeatable process. This allows geologists to spend time getting the geological interpretation right, giving them confidence in the resulting implicit model.
Australia and Canada Lead
Australia tops the list, with its major mining companies totaling $353 billion in market capitalization. The country is home to two of the biggest miners in the world, BHP and Rio Tinto.
Rank Country Company Market Cap (USD)
1 🇦🇺 Australia BHP Group 125B
2 🇨🇳 China China Shenhua Energy 103B
3 🇦🇺 Australia Rio Tinto 97B
4 🇺🇸 U.S. Southern Copper 77B
5 🇺🇸 U.S. Freeport-McMoRan 58B
6 🇨🇭 Switzerland Glencore 55B
7 🇸🇦 Saudi Arabia Maaden 49B
8 🇺🇸 U.S. Newmont 48B
9 🇨🇦 Canada Agnico Eagle Mines 43B
10 🇮🇩 Indonesia Bayan Resources 42B
11 🇲🇽 Mexico Grupo México 39B
12 🇦🇺 Australia Fortescue 36B
13 🇬🇧 UK Anglo American 37B
14 🇧🇷 Brazil Vale 37B
15 🇨🇳 China Zijin Mining 57B
16 🇮🇳 India Coal India 27B
17 🇨🇦 Canada Barrick Gold 28B
18 🇨🇦 Canada Wheaton Precious Metals 27B
19 🇨🇦 Canada Nutrien 26B
20 🇨🇦 Canada Franco-Nevada 24B
21 🇨🇦 Canada Teck Resources 22B
22 🇨🇦 Canada Cameco 22B
23 🇬🇧 UK Antofagasta 21B
24 🇮🇳 India Vedanta 20B
25 🇷🇺 Russia Nornickel 18B
26 🇨🇦 Canada Ivanhoe Mines 15B
27 🇨🇳 China Yanzhou Coal Mining 15B
28 🇨🇦 Canada Kinross Gold 13B
29 🇦🇺 Australia Northern Star 12B
30 🇷🇺 Russia Severstal 11B
31 🇨🇦 Canada First Quantum Minerals 11B
32 🇰🇿 Kazakhstan Kazatomprom 10B
33 🇦🇺 Australia South32 10B
34 🇺🇸 U.S. Royal Gold 9B
35 🇨🇳 China Ganfeng Lithium 9B
36 🇸🇪 Sweden Boliden 8B
37 🇨🇦 Canada Alamos Gold 8B
38 🇨🇦 Canada Pan American Silver 8B
39 🇨🇳 China Tianqi Lithium 7B
40 🇦🇺 Australia Evolution Mining 7B
41 🇨🇦 Canada Lundin Mining 7B
42 🇮🇳 Indonesia NMDC 7B
43 🇨🇦 Canada Lundin Gold 6B
44 🇮🇩 India United Tractors 6B
45 🇯🇵 Japan Sumitomo Metal Mining 6B
46 🇲🇽 Mexico Fresnillo 6B
47 🇵🇱 Poland KGHM 6B
48 🇿🇦 South Africa Harmony Gold 6B
49 🇬🇧 UK Endeavour Mining 5B
50 🇿🇦 South Africa Impala Platinum 5B
🌍 Global Total All Companies Combined 1.4T
Rich in minerals, Australia is the world’s largest producer of iron ore, essential for steel production, and lithium, a key component in batteries.
While Canada’s economy has struggled to keep pace with its southern neighbor, its mining industry remains formidable.
The country’s mining sector has a combined market capitalization of $344 billion, making it the second-largest globally.
Canada, the world’s second-largest country by area after Russia, has vast natural resource wealth. It is particularly rich in gold, copper, nickel, and potash.
United States with miners totaling $228 billion and China with companies totaling $206 billion come in third and forth, respectively.
It's simple. (But not easy):
Just do the obvious things right.
Here are 12 small habits that make a huge difference:
1/ You respond quickly
↳ Set a "24-hour response" rule for all messages
2/ You write clearly
↳ Start every long email with a one-line summary
3/ You keep your promises
↳ Create a "promises tracker" in your notes and review it daily
4/ You admit mistakes
↳ Practice saying "I made a mistake, here's how I'm fixing it"
5/ You show up prepared
↳ Review the agenda and prepare 2 talking points before every meeting
6/ You finish what you start
↳ Break every project into visible milestones and track progress
7/ You warn about problems early
↳ Send a "heads up" email the moment you spot potential issues
8/ You remember what others tell you
↳ Keep a dedicated "people notes" section in your work journal
9/ You share useful information
↳ Share one useful resource weekly with a relevant teammate
10/ You stay calm under pressure
↳ Practice the 3-breath rule before responding to tense situations
11/ You give clear updates
↳ Send progress updates before being asked
12/ You make time for others
↳ Block 30-minutes of weekly "open office" time for teammates
Small habits, practiced daily, create exceptional careers.
Which habit will you start with today?
This comprehensive map, built from decades of lunar mission data (Apollo-era, LRO, SELENE), provides a standardized view of the Moon’s geology. For mining and geotechnical engineers, it’s an essential tool for quarry site planning and evaluating material availability.
Key Insights for Quarry Site Planning
𝗜𝗱𝗲𝗻𝘁𝗶𝗳𝘆𝗶𝗻𝗴 𝗢𝗽𝘁𝗶𝗺𝗮𝗹 𝗤𝘂𝗮𝗿𝗿𝘆 𝗦𝗶𝘁𝗲𝘀
🔸The map highlights geological units like impact melt deposits (Ip) and highland materials (Nc), essential for extracting durable aggregates similar to basalt and granite quarries on Earth.
🔸Areas marked with Ec (ejecta) are typically fragmented and unstable, akin to loose alluvial deposits on Earth—making them less favorable for quarrying.
🔸The map also identifies crater interiors, some of which have solidified melt floors (like Ic2) that could serve as quarry basins with stable material.
𝗤𝘂𝗮𝗿𝗿𝘆𝗶𝗻𝗴 𝗳𝗼𝗿 𝗜𝗻𝗳𝗿𝗮𝘀𝘁𝗿𝘂𝗰𝘁𝘂𝗿𝗲 𝗮𝗻𝗱 𝗥𝗼𝗮𝗱 𝗠𝗮𝘁𝗲𝗿𝗶𝗮𝗹𝘀
🔸On Earth, borrow pits provide materials for roads and embankments. On the Moon, basalt-rich impact melts (Ip) and anorthosite highlands (Nc) can serve a similar purpose, offering crushed stone for road bases, embankments, and structural foundations.
🔸The Geologic Map allows us to identify these resource-rich areas, minimizing excavation efforts and ensuring material consistency.
𝗦𝗶𝘁𝗲 𝗦𝘁𝗮𝗯𝗶𝗹𝗶𝘁𝘆 𝗮𝗻𝗱 𝗦𝗮𝗳𝗲𝘁𝘆 𝗔𝘀𝘀𝗲𝘀𝘀𝗺𝗲𝗻𝘁
🔸 The South Pole region shows numerous craters >20 km in diameter, marked with orange circles. Some of these large craters feature stable, flat floors that are ideal for quarrying, while overlapping or concentric craters indicate weaker, disrupted terrain.
🔸 Evaluating crater stability is crucial, much like assessing the risk of sinkholes or subsidence in terrestrial quarries. The map helps pinpoint areas where multi-impact events may have compromised the ground integrity.
𝗢𝗽𝘁𝗶𝗺𝗶𝘇𝗶𝗻𝗴 𝗔𝗰𝗰𝗲𝘀𝘀 𝗮𝗻𝗱 𝗧𝗿𝗮𝗻𝘀𝗽𝗼𝗿𝘁𝗮𝘁𝗶𝗼𝗻
🔸 Just as on Earth, reducing haul distances is vital for efficiency. The map’s data helps us plan material transport corridors between quarry sites and construction zones, minimizing energy consumption.
🔸 Identifying gentle slopes and low-elevation pathways helps in planning lunar roads and infrastructure, similar to selecting haul roads in terrestrial quarries.
Given the vast experience and well-established practices within the extensive mining industry, adapting these proven methods to the Moon is not only feasible but also manageable.
Sources:
1. Lunar/LROC - QuickMap // Orange circles represent craters>20km // Unified Geologic Map labels
2. https://https://lnkd.in/gHbHMbzc
3. Quarry Design Handbook by David Jarvis Associates
🔍 La inversión minera sigue siendo la base de la economía peruana, alcanzando en diciembre de 2024 una cifra superior a los US$ 769 millones.
A nivel de titulares mineros, los que registraron mayor monto de inversión ejecutado al cierre del 2024 fueron:
🏆 1. Compañía Minera Antamina S.A.
📌 Inversión: US$ 689 millones (13.9% del total)
📌 Clave del éxito: Fuerte inversión en la Unidad Económica Administrativa “Yanacancha 1” y su Planta de Beneficio “Huincush”.
🥈 2. Minera Las Bambas S.A.
📌 Inversión: US$ 385 millones (7.8% del total)
🥉 3. Sociedad Minera Cerro Verde S.A.A.
📌 Inversión: US$ 355 millones (7.2% del total)
🏅 4. Anglo American Quellaveco S.A.
📌 Inversión: US$ 346 millones (7.0% del total)
💡 Dato clave: Estas cuatro empresas en conjunto concentraron el 35.8% de la inversión minera ejecutada a nivel nacional.
En este listado, exploramos a las 5 principales empresas según cada rubro de inversión. Conoce su impacto en la industria.
📌 Fuente: Boletín Estadístico Minero – Diciembre 2024 (Ministerio de Energía y Minas
Absolutely! In blasting operations, the sequence of detonating explosives is crucial for achieving optimal fragmentation and displacement of rock. A well-planned blasting sequence can lead to several significant benefits:
1. **Controlled Fragmentation**: By carefully timing the detonation of charges, operators can control the size and distribution of rock fragments. This precision is essential for efficient material handling and processing, ultimately enhancing the overall productivity of the mining operation.
2. **Minimized Ground Vibration**: Employing a sequential blast can significantly reduce the amplitude of ground vibrations. Managing these vibrations is vital for protecting surrounding structures, infrastructure, and ecosystems from potential damage, ensuring compliance with safety regulations.
3. **Improved Displacement**: A thoughtfully executed blasting sequence can optimize the movement of rock. This improvement in displacement not only aids in effective rock removal but also minimizes the risk of fly rock—pieces of rock that are propelled away from the blast site—which can pose hazards to personnel and equipment.
4. **Enhanced Safety**: A meticulously planned sequence enhances safety for workers and machinery by lowering the risk of premature detonations. It ensures that the blast area is secure and that all personnel are at a safe distance during the detonation.
5. **Optimized Loading and Hauling**: Effective fragmentation achieved through a proper sequence facilitates easier loading and hauling of materials. This efficiency leads to smoother operations, reduced downtime, and ultimately contributes to better resource management and cost-effectiveness.
In summary, the sequence in the blasting process is a critical factor that influences the effectiveness and safety of the operation. It requires careful planning and execution to maximize productivity while ensuring a secure working environment. By prioritizing the sequence of blasts, mining operations can achieve superior outcomes that benefit both the project and the surrounding community.
When procurement is done right, it leads to:
✅ Smarter spending
✅ Stronger supplier relationships
✅ Seamless operations
✅ Better results
But often, inefficiencies creep in:
❌ Delayed approvals
❌ Missed cost-saving opportunities
❌ Supplier conflicts
❌ Repeated errors
Here’s how to master procurement:
1️⃣ Need Identification
Understand what your organization needs and define clear specifications.
KPIs: Percentage of accurately identified needs, number of specification revisions.
2️⃣ Purchase Requisition
Formalize internal requests and streamline approvals.
KPIs: Requisition approval cycle time, percentage of requisitions approved without revisions.
3️⃣ Supplier Identification
Research and shortlist suppliers based on capacity, reliability, and quality.
KPIs: Number of qualified suppliers identified, supplier qualification lead time.
Etc
Website: https://stan.store/Kingslys/p/cargocheatsheets-membership
Uranium Resources, Production and Demand, also familiarly known as the "Red Book", is a biennial publication produced jointly by the NEA and the IAEA under the auspices of the joint NEA/IAEA Uranium Group. The first edition was published in 1965. Thirty editions have since been published. As the only government-sponsored publication tracking world trends and developments in uranium resources, production and demand, the Red Book is an authoritative source of information on the subject.
Source: Credit to International Atomic Energy Agency (IAEA)
Este apunte es una guía concisa y práctica que cubre desde los principios de operación y el análisis geotécnico de macizos rocosos, hasta el diseño estructural de revestimientos y las innovaciones más recientes. Ideal para ingenieros y estudiantes que buscan información precisa, ejemplos claros y recomendaciones de campo.
🔥 𝐓𝐇𝐄 𝐓𝐄𝐌𝐏𝐓𝐀𝐓𝐈𝐎𝐍
Big muckpile. Big pride. It’s the dopamine hit of blast day.
But here’s the uncomfortable truth:🔍 𝗪𝗵𝗮𝘁 𝘄𝗲 𝗴𝗮𝗶𝗻 𝗶𝗻 𝘃𝗼𝗹𝘂𝗺𝗲, 𝘄𝗲 𝗼𝗳𝘁𝗲𝗻 𝗹𝗼𝘀𝗲 𝗶𝗻 𝘃𝗮𝗹𝘂𝗲.
🧠 𝐖𝐇𝐘 𝐃𝐎 𝐒𝐎𝐌𝐄 𝐒𝐈𝐓𝐄𝐒 𝐊𝐄𝐄𝐏 𝐆𝐎𝐈𝐍𝐆 𝐁𝐈𝐆?
Let’s be honest . it’s not always about the geology or production goals.
• 𝗘𝗴𝗼 : Loud blasts look like performance.
• 𝗛𝗮𝗯𝗶𝘁 : “We’ve always done it this way.”
• 𝗦𝗵𝗼𝗿𝘁-𝘁𝗲𝗿𝗺𝗶𝘀𝗺 : KPIs get ticked. Targets met.
Meanwhile, operations quietly bleed.
Blasting is also psychology . Not just art. Not just science. And sometimes, it’s emotionally driven.
💣 𝐓𝐇𝐄 𝐌𝐈𝐒𝐅𝐈𝐑𝐄 𝐌𝐔𝐋𝐓𝐈𝐏𝐋𝐈𝐄𝐑
Big blasts don’t just concentrate energy. They concentrate 𝗿𝗶𝘀𝗸.
One misfire in a small blast? ➡️ Annoying.
One misfire in a large blast? ➡️ Dangerous. Disruptive 𝗮𝗻𝗱 Expensive.
Let’s break it down:
• 👷 𝗦𝗮𝗳𝗲𝘁𝘆 𝗧𝗵𝗿𝗲𝗮𝘁: Unexploded charges = silent killers during mucking or secondary operations.
• 🚧 𝗢𝗽𝗲𝗿𝗮𝘁𝗶𝗼𝗻𝗮𝗹 𝗗𝗲𝗹𝗮𝘆𝘀: Can’t dig. Can’t load. Can’t crush. Everything stops.
• 💸 𝗖𝗼𝘀𝘁 𝗦𝗽𝗶𝗸𝗲: Re-drilling, re-priming, idle machines — your “cost-saving” blast just blew its own budget.
And ironically?
Big blasts often skip quality checks in the name of 𝙚𝒇𝙛𝒊𝙘𝒊𝙚𝒏𝙘𝒚. But when you scale up, your margin for error shrinks.
In a small blast, you can’t afford a misfire.
In a big one? You can’t afford 𝒂𝙣𝒚𝙩𝒉𝙞𝒏𝙜 𝙡𝒆𝙨𝒔 𝒕𝙝𝒂𝙣 𝙥𝒆𝙧𝒇𝙚𝒄𝙩𝒊𝙤𝒏. And that’s a dangerous bet.
𝐓𝐇𝐄 "𝐄𝐅𝐅𝐈𝐂𝐈𝐄𝐍𝐂𝐘" 𝐎𝐅 𝐁𝐈𝐆𝐆𝐄𝐑 𝐇𝐎𝐋𝐄𝐒 𝐈𝐒 𝐀 𝐌𝐈𝐑𝐀𝐆𝐄
Yes, larger diameter holes = fewer drill meters.
Fewer holes sound like savings. But here’s what doesn’t make it into the dashboard:
• 💥 𝗨𝗻𝗲𝘃𝗲𝗻 𝗘𝗻𝗲𝗿𝗴𝘆 𝗗𝗶𝘀𝘁𝗿𝗶𝗯𝘂𝘁𝗶𝗼𝗻: Large holes don’t spread energy evenly. Fragmentation suffer
• 🪨 𝐌𝐨𝐫𝐞 𝐎𝐯𝐞𝐫𝐬𝐢𝐳𝐞: You trade finer fragmentation for unpredictable boulders
• 📏 𝐑𝐞𝐝𝐮𝐜𝐞𝐝 𝐂𝐨𝐧𝐭𝐫𝐨𝐥: Wider burdens and spacings = precision out the window.
• 🎯 𝐏𝐨𝐨𝐫 𝐓𝐢𝐦𝐢𝐧𝐠 𝐅𝐥𝐞𝐱𝐢𝐛𝐢𝐥𝐢𝐭𝐲: Fewer holes = less control over initiation sequencing
It’s not efficiency. It’s erosion of control, consistency, and downstream productivity.
🧱 𝐁𝐈𝐆 𝐁𝐋𝐀𝐒𝐓𝐒 𝐁𝐔𝐈𝐋𝐃 𝐁𝐀𝐃 𝐇𝐀𝐁𝐈𝐓𝐒
When teams get used to chasing tonnage through size alone, something more dangerous happens: 𝙏𝙝𝙚𝙮 𝙨𝙩𝙤𝙥 𝙤𝙥𝙩𝙞𝙢𝙞𝙯𝙞𝙣𝙜.
- Precision gets replaced by routine.
- Initiation timing? “Good enough.”
- Burden checks? “Next time.”
- Post-blast reviews? “No time, we’re busy moving muck.”
🧠 What starts as a tactical decision becomes a cultural drift.
And suddenly, a site that once engineered every hole is now managing by momentum
Let's stop chasing size and start chasing strategy because “𝘽𝙞𝙜” 𝙤𝙛𝙩𝙚𝙣 𝙢𝙚𝙖𝙣𝙨 𝙪𝙣𝙘𝙚𝙧𝙩𝙖𝙞𝙣.
RTK (Real-Time Kinematic ) is a GPS correction technique that provides centimeter-level accuracy by using real-time satellite corrections, transmitted from a base station to a rover (the receiver on your survey tool, drone, or tractor). Here’s how RTK is reshaping industries:
Precision Surveying 📏
From boundary marking to infrastructure layout, RTK enables surveyors to establish points with pinpoint accuracy, minimizing rework and ensuring projects stay on track.
Construction & Urban Development 🏗️
In construction, RTK is invaluable for mapping and ensuring that every detail matches the design plan, speeding up timelines and lowering costs.
💡 Why Centimeters Matter
The difference between a few centimeters might seem trivial, but in fields like surveying, it’s the difference between efficiency and costly mistakes. RTK delivers that crucial accuracy, turning projects from “good enough” into flawlessly executed.
As we move toward an era of smart cities and autonomous machines, RTK is the backbone that will keep everything in sync. Thinking about adding RTK to your workflow? Now’s the time. 🔥
Image credit: Emlid
What is Predictive Maintenance?
Predictive maintenance refers to the use of data analysis tools and techniques to detect anomalies in equipment and predict potential failures before they occur. This approach leverages data from sensors and machines to anticipate maintenance needs, thereby preventing costly downtime and extending the lifespan of machinery.
Current State of Predictive Maintenance:
According to IoT Analytics, the predictive maintenance market is growing fast, hitting $5.5 billion in 2022, and is expected to grow by 17% annually until 2028. This growth is driven by industries with heavy assets like oil and gas, where downtime is costly. The market has evolved to include three main types of predictive maintenance: indirect failure prediction, anomaly detection, and remaining useful life (RUL). Most companies adopting predictive maintenance report a positive ROI, with 95% seeing benefits and 27% recouping costs within a year. Successful vendors often specialize in specific industries or assets, and software tools in this space share common features like data collection, analytics, and third-party integration. As the market matures, integration into broader maintenance workflows and asset management systems is becoming increasingly important.
Why is it a Big Deal?
The power of predictive maintenance lies in its ability to ensure operational efficiency and save substantial costs in the long run. By preventing unexpected equipment failures, companies can reduce downtime, enhance safety, and optimize spare parts handling, making operations smoother and more cost-effective.
The Challenge: Two Worlds Colliding
However, integrating predictive maintenance into business operations isn't without its hurdles. One significant challenge is the cultural and knowledge gap between maintenance teams and AI experts. Maintenance professionals may lack a deep understanding of AI and data analytics, while AI specialists often do not possess firsthand knowledge of the intricate realities of day-to-day maintenance. This disparity can lead to miscommunications and inefficiencies in implementing predictive maintenance solutions.
Analytics Considerations for Successful Predictive Maintenance Initiatives
Predictive maintenance fundamentally redefines traditional maintenance practices by integrating sophisticated analytics into its core processes. Unlike condition monitoring, which primarily focuses on using alarms to signal deviations from expected performance thresholds, predictive maintenance leverages in-depth analytics to foresee and mitigate potential failures before they manifest. According to IoT Analytics, the accuracy of many predictive maintenance solutions is lower than 50%. This low accuracy can erode trust and create frustration as maintenance teams spend time chasing false alarms. As a result, this approach necessitates a different set of considerations, many of which are novel for maintenance teams accustomed to conventional methods.
Consideration 1: Data Sources
The use of diverse inputs such as operational data, sensor outputs, and historical maintenance records is vital. These sources enrich predictive models by providing a comprehensive view of equipment performance and behavior over time. Are you capturing a wide range of data types to maximize your predictive accuracy? For example, have you considered integrating temperature and vibration data from sensors with operational logs to enhance failure prediction?
Knowledge-based: Utilizes pre-built models, first principles data, and subject-matter expertise. This information is crucial as it provides a theoretical and expert-backed foundation for predictive models.
User-based: Maintenance logs and feedback from operators are critical as they contain real-world insights and historical records of equipment performance, helping to refine predictive accuracy.
Hardware-based: Asset data, retrofitted sensor data, controller data, and gateway data are key inputs, providing live and historical operational data that can reveal trends and patterns indicative of potential failures.
External/other data: This includes external data sources that can enhance predictions, like environmental conditions or industry benchmarks.
Consideration 2: Types of Analytics
Employing a range of analytical methods—descriptive, diagnostic, predictive, and prescriptive—ensures a thorough understanding of both current conditions and future risks. This multifaceted approach allows for more nuanced decision-making and strategic planning. What mix of analytics does your organization currently use, and how can these be optimized to improve maintenance predictions? For example, could you implement diagnostic analytics to pinpoint the specific causes of equipment anomalies detected by your sensors?
Descriptive Analytics: Offers a summary of historical data, helping to understand past equipment behavior and identify patterns.
Diagnostic Analytics: Delves into the reasons behind observed equipment failures, aiding in understanding root causes.
Predictive Analytics: Foresees potential future failures based on trends and historical data, allowing proactive maintenance.
Prescriptive Analytics: Provides actionable recommendations on how to prevent failures or optimize performance, moving beyond predictions to decision support and automation.
Consideration 3: Class Imbalances
Addressing the imbalance where failure events are significantly outnumbered by normal operation data is crucial for model accuracy. Techniques such as synthetic data generation or advanced sampling methods can help models learn to recognize rare but critical failure patterns. How does your predictive maintenance system handle class imbalances, and what methods could be implemented to improve this? As a specific instance, have you considered using SMOTE (Synthetic Minority Over-sampling Technique) to artificially enhance your dataset with synthesized examples of rare but critical failures?
Data Level: Involves sampling techniques like oversampling, undersampling, or using hybrid methods like SMOTE to balance the dataset and improve model training.
Algorithm Level: Includes strategies like cost-sensitive learning, which penalizes the model more heavily for missing failure events, ensuring these critical events are accurately predicted.
Ensemble Learning: Combines multiple models to enhance prediction accuracy, particularly in cases of rare events.
Consideration 4: Data Quality
Ensuring data is accurate, complete, and timely is critical for effective predictive maintenance. High-quality data leads to more reliable predictions, fewer false alarms or missed failures, and higher overall uptime. How does your organization validate and clean its data, and what improvements could be made? For instance, what steps are taken to check sensor accuracy and recalibrate them if necessary to maintain data quality?
Accuracy: Ensures that data correctly reflects the true state of the equipment. Calibration of sensors and regular validation checks are necessary to maintain this accuracy.
Completeness: This involves ensuring that all relevant data points are captured without gaps, which could otherwise lead to misleading predictions.
Timeliness: Data must be up-to-date, as delayed data can lead to missed predictions and increased downtime.
Consideration 5: Model Evaluation
Regularly assessing the performance of predictive models through metrics such as accuracy, precision, and recall ensures they remain effective even as conditions change. Continuous model evaluation is key to adapting predictive maintenance strategies to new data and operational shifts. What evaluation schedule and metrics are most appropriate for your models, and how often should retraining occur? Could you use a confusion matrix to more clearly understand where your model's predictions go wrong?
Model Diagnostics: Includes techniques like ROC curve and AUC analysis to assess the true performance of the models.
Performance Methods: These methods evaluate how well the models perform in predicting failures versus non-failures.
Interpretability & Insights: Ensures that models are not just black boxes but provide actionable insights that can be understood by maintenance teams.
Error & Statistical Analysis: Regular analysis of errors helps in refining models and reducing false positives or negatives.
Consideration 6: Modeling Strategy
Selecting the appropriate modeling strategy involves deciding whether to focus on anomaly detection, failure prediction, or life expectancy estimation, among other options. This choice should align with the organization's specific maintenance goals and operational needs. How do you choose the right modeling strategy for your operations, and could this approach be refined? For example, if reducing downtime is a priority, how might focusing on real-time anomaly detection improve operational efficiency?
Remaining Useful Life (RUL): Focuses on estimating how long equipment will function before failure, which is critical for planning maintenance schedules.
Probability of Failure within a Time Window: Helps in understanding the likelihood of failure in the near future, allowing for targeted maintenance interventions.
Anomaly Detection: Identifies unusual patterns that could indicate potential failures, often serving as an early warning system.
Survival Analysis: A statistical method that estimates the time until an event, such as failure, occurs, helping in long-term maintenance planning.
Consideration 7: Model Deployment
The deployment of predictive models, whether in the cloud, on-premise, or in a hybrid environment, significantly impacts the timeliness and effectiveness of maintenance actions. Each deployment strategy offers different benefits and challenges related to scalability, speed, and security. What is the most effective deployment strategy for your organization's needs, and how can it enhance predictive maintenance performance? Specifically, how might moving to a cloud-based platform improve your ability to scale predictive maintenance efforts across multiple facilities?
Cloud Implementation: Offers scalability and centralized management, ideal for organizations with multiple facilities or those seeking to leverage advanced cloud-based analytics.
Edge Implementation: Provides real-time analytics at the point of data generation, which is crucial for scenarios where immediate action is required.
Hybrid Implementation: Combines the best of cloud and edge, balancing the need for real-time insights with broader scalability and data management.
Source: https://www.jeffwinterinsights.com/insights/analytics-considerations-when-implementing-predictive-maintenance
Source: Credit to Jeff Winter, jeffwinterinsights.com
Main Reasons For An Industrial Accident includes these factors:
1. Human Error – Lack of training, fatigue, negligence or misjudgment by workers.
2. Poor Safety Measures – Inadequate safety protocols, lack of protective gear or failure to follow standard operating procedures.
3. Equipment Failure – Malfunctioning machinery, lack of maintenance or outdated technology.
4. Unsafe Working Conditions – Slippery floors, poor lighting, excessive noise or exposure to hazardous substances.
5. Lack of Supervision – Weak enforcement of safety regulations, poor management oversight or non - compliance with safety laws.
6. Fire and Explosions – Flammable materials, electrical faults or improper handling of chemicals.
7. Mechanical Impact – Falling objects, crushing hazards or entanglement with moving parts.
8. Chemical Hazards – Toxic gas leaks, improper storage of chemicals or accidental mixing of incompatible substances.
9. Electrical Issues – Short circuits, exposed wires or improper grounding.
10. Workplace Stress and Fatigue – Overworking employees, leading to exhaustion and reduced concentration.
11. Improper Waste Disposal – Unsafe handling or disposal of industrial waste, leading to environmental contamination and health hazards.
12. Unauthorised Access to Hazardous Zones – Contracted workers or untrained personnel entering restricted hazardous areas, increasing the risk of accidents.
Prevention requires strict safety regulations, regular training, proper equipment maintenance, responsible waste management and controlled access to dangerous areas.
Creating a good chart, on the other hand, is
also easy…
Yet somehow, I still find myself staring at monstrosities.
Follow a few of these best practices, and your audience won’t have to suffer the same fate.
Immediate Actions During Sudden Complete Loss of Circulation While Drilling
When a complete loss of circulation suddenly occurs during drilling, it poses serious risks such as well control issues, formation damage, and operational delays. Both the Driller and Mud Engineer must take rapid and coordinated actions to stabilize the situation.
*Quick Actions for Driller*
1. Stop Pump Immediately
Halt mud circulation to prevent further loss and formation damage.
2. Inform the Company Man / Tool Pusher
Notify key personnel immediately for coordinated troubleshooting.
3. Check Pit Volume
Monitor and record the mud pit volume loss to estimate severity.
4. Monitor Well for Kick Signs
Be alert for signs of kick or influx due to underbalanced conditions.
5. Close the BOP (if necessary)
If there's a risk of influx, activate BOP to secure the well.
6. Circulate Pills (If Planned)
Use LCM (Lost Circulation Material) pills if already prepared.
7. Tag Bottom Carefully
Re-enter hole slowly to avoid swabbing or surging.
8. Log the Incident
Document depth, loss volume, mud parameters, and time of occurrence.
*Quick Actions for Mud Engineer*
1. Confirm Mud Properties
Immediately verify mud weight, viscosity, and loss circulation material (LCM) availability.
2. Prepare LCM Pills
Formulate appropriate LCM pill (fibrous, granular, or cement if severe).
3. Recommend Adjusting Mud Weight
Suggest lowering mud weight if formation cannot support existing density.
4. Analyze Formation Type
Determine if loss is due to fractures, vugs, or high permeability zones.
5. Support Drilling Team with Data
Provide historical data on loss zones from offset wells or previous depths.
6. Monitor and Record Loss Rate
Continuously track loss volume and fluid balance.
7. Coordinate with Cementing Services (if needed)
If LCM fails, initiate cement plug discussions.
RPN is a numerical score used in Failure Mode and Effects Analysis (FMEA) to evaluate and prioritize risks associated with potential failure modes of a product or process. It helps teams focus on the most critical risks that need to be addressed.
🔢 Formula for RPN: RPN = Severity (S) × Occurrence (O) × Detection (D)
-Severity (S): The potential impact of a failure.
-Occurrence (O): The likelihood of the failure occurring.
-Detection (D): The ability to detect the failure before it reaches the customer.
Each of these factors is rated on a scale (usually 1 to 10), and the RPN score is the product of these ratings.
⚖️ Prioritizing Risk by 3 Factors:
-Severity: How severe the failure would be.
-Occurrence: The likelihood of the failure happening.
-Detection: How likely the failure will be detected before it affects the customer.
📊 Risk Matrix: A Risk Matrix helps visualize and prioritize risks based on their Severity and Occurrence ratings, while the Detection rating influences how proactive we need to be in addressing those risks.
🔴 Color Coding in Risk Matrix:
-Red: High risk, immediate action needed.
-Yellow: Moderate risk, requires attention.
-Green: Low risk, monitoring required.
✅ Benefits of RPN Matrix:
-Provides a systematic way to evaluate and prioritize risks.
-Helps allocate resources more effectively by focusing on the most critical risks.
-Enhances decision-making by providing clear risk ratings.
⚠️ Disadvantages of RPN:
-RPN does not always reflect the true level of risk, especially when factors like severity are not accurately considered.
-Two failure modes with the same RPN may require different actions.
-Over-reliance on RPN can lead to missing out on other critical aspects of risk.
🔑 Recommendations:
- Combine RPN with Severity, Occurrence, and Detection ratings for a more accurate risk prioritization.
- Use tools like FMECA for a more detailed and comprehensive risk analysis.
Regularly update risk ratings to reflect new data and changes in operational conditions.
Source: https://www.linkedin.com/in/govind-tiwari-phd/
Underground mining is a complex field that requires different techniques depending on the orebody’s depth, shape, and geotechnical conditions. These methods can be classified into three main categories:
1. Naturally Supported Stopes
These methods rely on the strength of the ore and surrounding rock to provide natural support during extraction.
Gophering:
A primitive method where miners follow high-grade veins or deposits.
Minimal planning and used in small-scale operations.
Room-and-Pillar Mining:
Large rooms of ore are mined, leaving pillars to support the roof.
Commonly used for coal and flat-lying deposits.
Vertical Crater Retreat (VCR):
Involves drilling vertical holes and blasting ore in retreating slices.
Ideal for steeply dipping, massive deposits
Sublevel Stoping:
Ore is blasted from sublevels within the deposit and extracted through draw points.
Requires good orebody stability.
2. Artificially Supported Stopes
These methods require external support to ensure safety and stability in weaker rock conditions.
Longwall Mining:
A fully mechanized method where a long wall of ore is mined in a single slice.
Often used for coal mining with hydraulic roof supports.
Shortwall Mining:
Similar to longwall but with shorter mining faces.
Used in smaller deposits or lower-production scenarios.
Shrinkage Stoping:
Ore is broken in slices and temporarily left in the stope to provide support.
Ore is removed after the stope is fully mined.
Cut-and-Fill Mining:
Ore is mined in horizontal slices, and the void is backfilled with waste rock or cement.
Suitable for high-grade, irregular deposits.
3. Caving Methods
These involve controlled collapse of rock to extract ore with minimal drilling or blasting.
Top Slicing:
Ore is mined in horizontal layers from the top downward, with caving occurring at each level.
Suitable for deposits with weak overlying rock.
Sublevel Caving:
Ore is blasted in sublevels, and the caved rock flows into draw points for extraction.
Common in steep, large ore bodies.
Block Caving:
Involves large-scale caving where ore is extracted as it collapses under gravity.
Best for massive, low-grade deposits like copper and diamonds.
🔎 Each method has unique advantages, and the choice depends on factors like orebody geometry, rock stability, and economic feasibility.
Silver is a unique metal, valued both as an investment and for its wide range of industrial applications, from electronics to renewable energy. Understanding where this metal originates involves looking at some of the world's largest mining operations. Based on 2023 production data compiled by GlobalData, here are the ten mines that produced the most silver globally last year.
Top Producer: Turkey's Gumuskoy Mine
Leading the list by a considerable margin is the Gumuskol Mine in Turkey. Its production reached 45.69 million ounces in 2023, more than twice the output of the second-largest producer.
Mexico's Prominent Role in Silver Production
Mexico features heavily in the top rankings, hosting five of the ten largest silver-producing mines. The highest-ranked among these is Newmont's Penasquito Mine (#2 globally), which produced 20.68 million ounces. Penasquito produces significant amounts of gold and is primarily a gold mine.
Other major Mexican producers on the list include:
The Juanicipio Project (#6) with 14.89 million ounces.
The San Julian Project (#7) producing 13.59 million ounces.
The Fresnillo Mine (#8), part of the Fresnillo plc group, yielding 13.32 million ounces.
The Saucito Mine (#10) with 11.6 million ounces. These mines collectively demonstrate Mexico's significant position in global silver supply.
Major European Mines: Poland's KGHM Operations
In Europe, Poland hosts two key silver producers, both operated by the copper mining company KGHM:
The Polkowice-Sieroszowice Mine ranked #3 globally with 18.5 million ounces.
The Rudna Mine followed closely at #4, producing 18.09 million ounces. Silver production at these sites is closely linked to KGHM's extensive copper mining activities.
Other Key Contributors: India and Peru
Rounding out the top ten are significant mines in Asia and South America:
India's Sindesar Khurd Mine (#5), operated by Vedanta, produced 15.08 million ounces. This mine is primarily focused on lead and zinc, with silver as an important by-product.
Peru's large Antamina Mine (#9) contributed 12.63 million ounces. This multi-metal mine, operated by a consortium including Glencore, primarily produces copper and zinc.
Summary
The 2023 data shows a concentration of major silver production in specific regions, particularly Mexico and Poland, with Turkey hosting the single largest producing mine. The list includes both primary silver operations and polymetallic mines where silver is recovered alongside other base metals like copper, lead, and zinc. These ten operations are central to meeting the world's demand for silver.
Mine scheduling is more than just planning extraction sequences, it’s about maximizing value while ensuring sustainability and operational efficiency. Advanced mine scheduling integrates geostatistics, optimization algorithms, and machine learning to enhance decision-making, minimize waste, and improve resource recovery.
The outputs from mine scheduling such as production forecasts, equipment utilization plans, material movement schedules, and financial projections—are essential for strategic decision-making. They guide resource allocation, supply chain management, cost estimation, and environmental impact assessments, ensuring that mining operations remain efficient, compliant, and profitable.
How Advanced Mine Scheduling Supports Key Operational Decisions
✅ Production Forecasts – Accurate predictions of ore tonnage, grade distribution, and processing plant feed, aligning production targets with operational capacity and market conditions.
✅ Equipment Utilization Plans – Optimized deployment of mining fleets, drills, and loaders to maximize productivity, reduce idle time, and extend asset lifespan.
✅ Material Movement Schedules – Efficient hauling, dump location planning, and stockpile management to prevent bottlenecks, reduce fuel consumption, and improve logistics.
✅ Financial Projections – Improved cost estimation, cash flow predictions, and profitability analysis by integrating operational constraints, cost models, and commodity price forecasts.
By leveraging block modeling, real-time data analytics, and AI-driven simulations, mining operations can optimize fleet management, reduce downtime, and adapt to geological uncertainties. The result? Lower costs, higher productivity, and a reduced environmental footprint.
As the industry moves toward automation and digital transformation, mastering advanced mine scheduling will be critical for staying competitive.
✨ ¡Resultados emocionantes! ✨
Después de intensas jornadas de estudio (y de enfrentarme a que el escaso material estuviese en chino únicamente 😅), ¡finalmente logré demostrar con un experimento algo que intuía desde hace tiempo!
Los modelos actuales de daño en procesos de voladura tienden a sobreestimar el daño, ya que consideran que todos los tiros detonan al mismo tiempo (0 ms). Pero, ¿Qué pasa cuando incorporamos la realidad de una secuencia de detonación?
🔹 Modelo tradicional (sin secuencia de detonación): Predice una sobreexcavación de 50 a 60 cm respecto al contorno del túnel.
🔹 Modelo con secuencia de detonación: Al considerar la salida de los tiros en distintos milisegundos, el daño estimado se reduce significativamente a 15 a 20 cm.
Este análisis se realizó utilizando modelos avanzados de:
🟡 Finite element simulation (FEA) y Smoothed-Particle Hydrodynamics (SPH) para capturar la interacción de la voladura con el macizo rocoso.
🟡 Modelos constitutivos complejos para representar adecuadamente el macizo rocoso (y no solo la roca intacta) alimentados por el criterio de daño de Hoek and Brown.
🟡 Modelos JWL-EOS para modelar la detonación de la carga explosiva.
💡 ¡Este es un gran paso para optimizar el diseño de voladuras y reducir el daño en las excavaciones subterráneas! ( Es posible incorporar modelos geotécnicos y estructuras)
Si alguien está explorando temas similares o quiere implementar estas metodologías para evaluar el impacto de la secuencia de detonación en el daño inducido, ¡me encantaría conversar! 🚀💬
Además estaba pensando dar un curso sobre estos temas por Nube Minera para explicar con mas detalles como aplicar estas herramientas en el análisis de voladuras en mineria a cielo abierto y subterránea.
The Cut-off Grade is one of the most critical factors determining whether an ore deposit is economically viable for mining. It represents the minimum metal concentration required to make extraction profitable. Several factors influence this threshold, including:
🔸 Metal Market Price: The higher the metal price, the more economically viable it becomes to mine lower-grade ore. Conversely, if prices drop, certain ore portions may become uneconomical to extract.
🔸 Extraction and Processing Costs: These include drilling, blasting, transportation, grinding, and mineral processing expenses. The higher these costs, the higher the Cut-off Grade, as a higher concentration is needed to cover expenses and generate profit.
🔸 Transportation and Storage Costs: If a mine is located in a remote area or requires costly transportation, the minimum acceptable ore grade may increase.
🔸 Available Technology: Advances in technology can reduce extraction and processing costs, allowing for a lower Cut-off Grade and making previously uneconomical ore deposits viable.
🔸 Environmental and Regulatory Factors: Government regulations and environmental restrictions can impact overall mining costs, influencing the minimum ore grade required for profitability.
🔸 Geological and Engineering Factors: These include ore composition, impurity levels, depth, and extraction difficulty, all of which affect mining feasibility and efficiency.
🔹 Key Takeaway: The Cut-off Grade is not a fixed value—it fluctuates based on economic conditions, technological advancements, and operational costs. Understanding these factors helps mining companies make informed decisions about resource extraction.
Check out this project where our LiDAR team at HMaRA GIS performed high-precision stockpile volume calculations using UAV LiDAR scanning. We processed a point cloud with an average density of 485.2 points/m² to generate detailed contour lines and calculate a total volume of 6,788.4 m³ across 19 stockpiles.
Scope of Work:
- Classified the point cloud to separate ground and non-ground points
- Generated minor contour lines at 0.25 m intervals and major contour lines at 1 m intervals
- Created a Digital Terrain Model (DTM) for the entire territory
- Developed volumetric models for each stockpile, using the DTM as the base layer
- Applied elevation-based color coding to clearly define stockpile boundaries
- Calculated individual stockpile volumes and exported the data into vector formats
- Added annotations and labels for clarity
- Conducted a quality check to ensure accuracy and refined volume boundaries as needed
This project showcases how cutting-edge LiDAR technology delivers accurate, efficient, and cost-effective solutions for stockpile volume calculation, which is critical for infrastructure projects, resource management, and construction planning.
If you want to know more or get a quote, please write to Vladyslav Poda:
https://www.linkedin.com/in/vladyslav-poda/
👉 Explore the full case study here:
https://hmaragis.com/cases/
El Método Kaizen es una filosofía de mejora continua que ha transformado la forma en que las empresas optimizan sus procesos y mejoran la calidad.
🔍 1. Identifica Oportunidades de Mejora: Revisa tus procesos actuales y detecta dónde puedes optimizar.
👥 2. Conforma un Equipo de Trabajo: Involucra a todos los que participan en el proceso para obtener ideas valiosas.
📊 3. Evalúa la Situación Actual:Analiza cómo se realizan las tareas hoy en día para comprender el flujo de trabajo.
💡 4. Desarrolla Soluciones Innovadoras: Prioriza ideas simples y rápidas de implementar para mejorar el proceso.
⚙️ 5. Implementa el Cambio: Asegúrate de que todo el equipo esté informado y capacitado en los nuevos procedimientos.
📈 6. Monitorea y Evalúa:Observa el impacto de los cambios y ajusta según sea necesario.
🔄 7. Estandariza y Repite: Si los cambios han sido exitosos, estandariza y sigue buscando nuevas oportunidades de mejora.
La clave está en la constancia y en involucrar a todos los niveles de la organización. ¡Cada pequeño paso cuenta hacia un gran cambio!
Blasting, excavation, and material handling generate significant dust emissions, varying based on site geology and extraction methods. Some operations rely more on explosives, while others use mechanical excavation, but all involve large-scale equipment—excavators, dump trucks, and loaders—contributing to airborne dust. Mist cannons are commonly used for suppression.
Dust particles from drilling and blasting can travel far beyond site boundaries, monitored by regulators. These particles vary in size and impact:
🔹 PM10 (>10µm) – Visible dust, such as limestone, is generally less harmful as the body can filter it. However, silica dust within this category poses health risks.
🔹 PM10 (<10µm) – Invisible to the naked eye, includes cement, iron, and textile dust. These particles settle in the nose or throat, causing respiratory irritation and, with prolonged exposure, conditions like asthma.
🔹 PM2.5 (<2.5µm) – Known as respirable dust, including lead, carbon black, and metallurgic particles. These penetrate deep into the lungs, causing irreversible damage and diseases like silicosis, black lung, and lung cancer.
When airborne, these particles form Total Suspended Particles (TSP); once settled, they become deposited dust.
Effective dust control measures include dust suppressant chemicals, water sprinklers, water bags, and geotextiles, ensuring a safer and more compliant work environment.
From the visionary beginnings with King Abdulaziz to the transformative era of hashtag#Vision2030, Saudi Arabia's mining and mineral sector has seen incredible growth. Our mineral wealth, now valued at USD 2.5 trillion, is a testament to this journey.
We've implemented a comprehensive mining strategy, modernized investment laws, and embraced digital innovation to attract investment and enhance sustainability.
The recent launch of the USD 7.5 billion Phosphate 3 Project, set to increase phosphate production to 9 million tons, reinforces our global position in essential agricultural inputs. This progress, driven by the leadership of the Custodian of the Two Holy Mosques, King Salman bin Abdulaziz Al Saud, and HRH Prince Mohammed bin Salman bin Abdulaziz Al Saud, Crown Prince and Prime Minister, fuels our economic diversification and GDP growth.
On hashtag#SaudiFoundingDay 2025, we celebrate this legacy of progress and look forward to continued success.
La GMAO (Gestion de la Maintenance Assistée par Ordinateur) est un outil essentiel pour optimiser la gestion de la maintenance industrielle et tertiaire.
Voici pourquoi elle est importante :
1. Amélioration de la disponibilité des équipements
Réduction des pannes grâce à la maintenance préventive et conditionnelle
Optimisation des plans de maintenance
2. Réduction des coûts
Moins d’arrêts non planifiés et de réparations d’urgence
Gestion efficace des stocks de pièces de rechange
Suivi des coûts de maintenance en temps réel
3. Meilleure organisation des interventions
Planification des tâches de maintenance
Suivi des interventions et de l’historique des équipements
Gestion des équipes de maintenance et affectation des ressources
4. Amélioration de la traçabilité et conformité
Archivage des interventions pour audit et analyse
Respect des normes de sécurité et réglementations
Suivi des indicateurs de performance (MTTR, MTBF, taux de disponibilité)
5. Aide à la prise de décision
Analyse des pannes pour anticiper les défaillances
Optimisation des stratégies de maintenance
Gestion des budgets et des ressources
En résumé, la GMAO permet d’avoir une maintenance plus efficace, proactive et rentable, ce qui améliore la performance globale d’une entreprise.
📌 𝘓𝘢 𝘰𝘱𝘵𝘪𝘮𝘪𝘻𝘢𝘤𝘪𝘰𝘯 𝘥𝘦 𝘵𝘢𝘫𝘰𝘴 𝘦𝘯 𝘮𝘪𝘯𝘦𝘳𝘪𝘢 𝘢 𝘤𝘪𝘦𝘭𝘰 𝘢𝘣𝘪𝘦𝘳𝘵𝘰 𝘦𝘴 𝘤𝘭𝘢𝘷𝘦 𝘱𝘢𝘳𝘢 𝘮𝘢𝘹𝘪𝘮𝘪𝘻𝘢𝘳 𝘦𝘭 𝘷𝘢𝘭𝘰𝘳 𝘥𝘦𝘭 𝘱𝘳𝘰𝘺𝘦𝘤𝘵𝘰. 𝘌𝘭 𝘢𝘭𝘨𝘰𝘳𝘪𝘵𝘮𝘰 𝘥𝘦 𝘓𝘦𝘳𝘤𝘩𝘴 𝘺 𝘎𝘳𝘰𝘴𝘴𝘮𝘢𝘯, 𝘣𝘢𝘴𝘢𝘥𝘰 𝘦𝘯 𝘵𝘦𝘰𝘳𝘪𝘢 𝘥𝘦 𝘨𝘳𝘢𝘧𝘰𝘴, 𝘥𝘦𝘧𝘪𝘯𝘦 𝘦𝘭 𝘭𝘪𝘮𝘪𝘵𝘦 𝘰𝘱𝘵𝘪𝘮𝘰 𝘥𝘦𝘭 𝘵𝘢𝘫𝘰 𝘤𝘰𝘯𝘴𝘪𝘥𝘦𝘳𝘢𝘯𝘥𝘰 𝘪𝘯𝘨𝘳𝘦𝘴𝘰𝘴 𝘺 𝘤𝘰𝘴𝘵𝘰𝘴 𝘮𝘪𝘯𝘦𝘳𝘰𝘴.
🔍 Mediante un modelo de bloques, evalúa la rentabilidad y establece relaciones de precedencia, garantizando estabilidad y viabilidad en el diseño. Su implementación ha mejorado la toma de decisiones estratégicas en minería.
🔆 La evolución tecnológica ha potenciado este proceso con softwares como MinePlan, Deswik, Vulcan y NPV Scheduler, que optimizan pits, planificación y análisis estratégico, mejorando la eficiencia operativa.
Costing billions of wasted hours.
Here’s how you can change that,
With strategies from top entrepreneurs:
1. Elon Musk: Be Fully Prepared
Thoroughly prepare for each meeting.
Aim for efficiency, anticipate questions, and meet high standards.
2. Steve Jobs: Keep It Small
Productivity thrives in simplicity.
Limit participants to essential attendees only, cutting out distractions.
3. Larry Page: Make Fast Decisions
Speed up decision-making to avoid delays.
Appoint a decision-maker for each meeting.
4. Satya Nadella: Long Leadership Sessions
Use dashboards to align team goals.
Hold weekly leadership meetings for in-depth discussions and alignment.
5. Ben Horowitz: One-on-One Sessions
Hold structured one-on-one meetings to foster upward communication and fresh ideas, letting employees set the agenda.
6. Marissa Mayer: Vet Ideas Thoroughly
Demand well-thought-out proposals.
Ask tough questions about research, methodology, and solutions.
7. Alfred Sloan: Use Follow-Up Memos
Post-meeting memos ensure clarity and accountability.
Summarize decisions, assign tasks, and set deadlines.
8. Sheryl Sandberg: Stick to an Agenda
Keep meetings focused by sticking to a strict agenda.
Check off each item and finish early when possible.
Don’t let meetings drain your time.
P.S. How effective are your meetings?
♻️ Share this with your network to encourage better meetings!
----
📌 Get my top 100 infographics for free:
1) Follow Igor Buinevici.
2) Subscribe to my free newsletter at WildCapital.co.
You’ll receive them directly in your welcome email.
Everyone in mining knows the importance of NPV, IRR, and most critically—cashflow.
- Almost to a painful degree.
But there’s something that’s been sitting in my head for a while, and once I point it out, I think it will seem obvious. A recent post that linked grades to permitting delays got me thinking again about the time bias embedded in how we model cashflows.
We all know that NPV and IRR rely on discounting future cashflows—and for good reason. The further out a dollar is, the less valuable it is today.
It’s a fundamental principle in mining project evaluation. But here’s the problem: this approach bends reality in ways we don’t always acknowledge.
🔹 Long-term distortion—Anything beyond 30-50 years is effectively erased in value because of discounting. Yet, for the majors, a 50-year mine life is a massive advantage. The model says it’s nearly worthless. Operators know otherwise.
🔹 Short-term distortion—The magic of cashflow modeling is that it rewards slight shifts in timing. Delay capital deployment a little, assume cashflows start rolling in faster, push sustaining capital back a few years—suddenly, the numbers look fantastic. But in reality, there are limits on how well we can control these things. Payment terms don’t always line up.
Ramp-ups rarely go exactly as planned. And once a project is in motion, those early assumptions can make or break it.
We saw a clear example of it with a few companies in 2024. Namely Ascot Resources and the Premier Mine. This was an experienced team, a solid project that was tripped up because of not meeting early cashflow need. Not because the mine wasn’t viable, but because cashflows it needed did not come in on time.
That brings up the real question:
1) How do we ensure long-term optionality isn’t ignored just because it doesn’t show up in NPV?
2) How do we stay reasonable and conservative in short-term cashflow assumptions?
3) How do we account for delays—because they’re real and likely—so that a three or six-month slip doesn’t determine whether a mine should have been built in the first place?
▪️Because if a small delay can break a project, was the decision to build it ever sound? The focus shouldn’t just be on making numbers work in the short term—it should be on long-term stability beyond the initial payback.
The use of a grade control system is essential to enable better selectivity to optimize grade above cut-off, minimize waste/low-grade rock dilution, and maximize mining recovery.
This can be achieved by following the rules of an effective and efficient grade control program, There are:
1. High precision modelling system.
2. Clear and accurate geological mapping.
3. Effective definition of ore and waste base on
block models and grade control samples.
4. Strict supervision of stockpile management.
5. Evaluated the models and design of stope by conducted reconciliation.
Mining comes with its fair share of challenges, from finding valuable resources to protecting the environment and keeping communities safe.
That’s where Geographic Information Systems (GIS) and Remote Sensing step in, offering smart, practical solutions.
Whether it’s pinpointing mineral deposits, tracking underground fires, or managing waste, GIS helps mining teams work smarter, faster, and with greater accuracy.
Through the use of cutting-edge geospatial tools, mining operations can boost efficiency, reduce risks, and take better care of the planet.
From deep underground to the land and people above, GIS is making mining safer, more productive, and more sustainable.
Modelling density for resource estimation often becomes an afterthought, or only when a consultant asks for it which often leaves companies scrambling for a balance. Significant time is devoted to grade modelling as a primary focus, but density is a critical component in converting volumetrics into tonnages and should be considered carefully. Grade, volume, and density form the three pillars that underpin any resource estimation. It is important that each component be sufficiently examined to provide meaningful results.
Source: Credit to Lewis Harvey, Addison Mining Services
It's been a while since I posted an HR 101, so I thought today might be a good day to go back to basics once again.
The way an organization is designed affects everything, from how decisions are made to how employees collaborate and grow. 🌱
For HR professionals, understanding these 6 types of structures is key to making a real impact:
📌 Functional Organizational Structure
📌 Divisional Organizational Structure
📌 Flat Organizational Structure: https
📌 Vertical Organizational Structure
📌 Network Organizational Structure
📌 Hybrid Organizational Structure
https://www.aihr.com/hr-glossary/functional-organizational-structure/
As an HR professional, what organizational structure(s) do you have experience with? And what are the biggest advantages or HR challenges that come with it?
Slope design is an integral part of the engineering of an open pit, regardless of its size. Most cases the slope angles are a key component dictating the economic viability of a proposed or current mining project.
This has resulted in open pit mining operating with much lower Factor of Safety tolerances that would be used in civil engineering. However, the failure of a slope can have serious consequences in terms of the safety of personnel working in the open pit, and/or financial implications for the mining operation.
These factors place a significant responsibility on the slope designer to produce a reliable design often based upon limited data. This necessitates that the processes that are used to formulate the designs are the best available.
Source: Afri-Mining Consultancy
https://www.udemy.com/course/mine-design-using-geovia-surpac/
Source: Credit to P. F. Stacey, Stacey Mining Geotechnical Ltd.
Developed by Benchmark Mineral Intelligence, the report shows the latest trends and insights shaping the cobalt market – and highlights cobalt’s growing role in the green energy transition.
Key insights include:
- Demand growth: EVs and portable electronics drove an 8% year-on-year rise in cobalt demand. Battery demand grew 8% overall, while superalloys saw steady growth, now accounting for 34% of industrial demand.
- Record supply: Global cobalt supply reached an all-time high of 256kt, with significant contributions from CMOC’s African operations. The DRC continues to lead global production (76% of supply), with Indonesia expanding rapidly in nickel-cobalt.
- Geopolitical tensions: The DRC-Zambia Copperbelt has become a key focus for US-China competition, with major railway investments aiming to secure access to critical minerals.
Source: Credit to Susannah McLaren, Cobalt Institute
A team of researchers from Fraunhofer FFB and the German University of Münster has analysed the ownership structures and geopolitical dependencies along the supply chain for electric car batteries. The results of the study show that China is clearly in the lead when it comes to securing raw materials.
The analysts conclude that the People’s Republic of China controls almost the entire value chain from the extraction of raw materials to the production of batteries – and controls domestic production facilities, as well as those abroad. Of the four raw materials analysed – lithium, nickel, cobalt and manganese – only manganese is an exception. The refinement of the raw materials and the construction of the actual cells and batteries is also dominated by China, as the latest annual analysis by SNE Research shows. The leading duo CATL and BYD alone account for 55 per cent of the global market share for installed battery capacity in electric cars.
As the Fraunhofer FFB explains, large battery packs, such as those installed in a Tesla Model S Plaid, contain around 122 kilograms of so-called mineral raw materials. Geographically, only a few countries have the resources needed in large quantities for the expansion of electric mobility. These include China, Australia and the Democratic Republic of the Congo. The challenge: “Mineral raw materials are at the very beginning of the supply chain for battery cell production, and Europe is almost 100 per cent dependent on imports,” says Professor Simon Lux, Director of Fraunhofer FFB.
=> Securing raw materials in Europe and the USA: between catching up and dependency
In Lux’s view, China’s growing dominance of raw materials jeopardises the future of European electric mobility: “This dependency makes Europe vulnerable. Geopolitical tensions or export stops could lead to massive economic damage and losses running into billions.” Although Europe and the US are intensifying their efforts to gain greater control over the supply chain for lithium-ion batteries by acquiring mines and refineries, Europe’s share has so far been comparatively small. The US is making better progress – at least as far as lithium is concerned.
According to the authors of the study, Australia, Indonesia and the Democratic Republic of the Congo – all key regions for mining lithium, nickel and cobalt – are particularly affected by company takeovers. For example, 74 per cent of the world’s lithium comes from Australia and Chile, but Chinese (29 per cent) and US companies (26 per cent) hold the largest shares of production. “These developments underline the global competition for critical raw materials and the strategic realignment of value chains,” says Lux.
For the four raw materials analysed – lithium, nickel, cobalt and manganese – the study outlines the following picture of global ownership and influence:
Lithium: 74 per cent of the world’s lithium comes from Australia and Chile. Nevertheless, companies such as Tianqi Lithium from China and Albemarle from the USA hold the largest shares of global production, with China accounting for 29 per cent and the US for 26 per cent. Europe has almost no lithium shares abroad. Europe’s own shares are negligible and have so far been limited to the Baroso lithium project in Portugal, which accounts for just 0.4 per cent of production.
Nickel: Although 30 per cent of global nickel production takes place in Indonesia, Indonesian companies account for less than five per cent of production. Chinese companies, such as Tsingshan, secure 86 per cent of the remaining production in Indonesia, meaning China has the greatest control (32 per cent) over nickel production in combination with domestic production. The most influential regions after China include Europe, the Philippines and Russia, which together account for just over 40 per cent of global production.
Cobalt: Local companies control only five per cent of the mines, although 68 per cent of global production takes place in the DR Congo. China (47 per cent) and Europe (47 per cent) dominate production there – with players such as CMOC, Glencore and Eurasian Resources Group (ERG). Outside Chinese and European control, the Philippines, Russia and Cuba are influential (12 per cent).
Manganese: Australia is expanding its influence to a total of 25 per cent by acquiring more than half of South African mining rights through the companies South 32 and Jupiter Mines. South Africa is in second place with 20 per cent, followed by Europe, which has a total share of 16 per cent of global manganese production. These shares are spread across mines in Australia, Gabon and Ukraine, which were acquired by Anglo American, Eramet and ERG.
The analysts note that China has a particularly large lead in the LFP battery sector. Accordingly, China produces the majority of lithium iron phosphate active materials with a share of more than 98 per cent. The conclusion is that this means Europe is directly dependent on this more cost-effective battery chemistry. So, what can be done from a European perspective? According to the authors, possible levers for a secure and sovereign battery supply chain in Europe could be investments in expanding Europe’s own refinery capacities, promoting strategic raw material partnerships and strengthening the local circular economy.
In terms of methodology, the researchers from Fraunhofer FFB and the University of Münster state that the study is based on a comprehensive data analysis. To this end, the ownership structures along the global lithium-ion battery supply chain were analysed and compared with the geographical distribution of production shares. The study’s initiators aimed to “draw a holistic picture of the current power structures in the industry.”
Source: https://www.electrive.com/2025/02/19/fraunhofer-study-measures-chinas-dominance-in-the-battery-supply-chain/#
Falls from height account for almost half of the fatal accidents in the construction sector. Falling from height is a significant risk faced by scaffolders when erecting, altering or dismantling scaffolding during most scaffolding operations.
The NASC and HSE acknowledges that scaffolders have to work in hazardous situations, and this guidance note accepts that employers have a responsibility to ensure that adequate measures are provided for employees during scaffolding operations to eliminate or minimise those risks.
Source: HSE INTEGRO
Source: Credit to National Access and Scaffolding Confederation, NASC
Reconciliation is a crucial process in mining that ensures the accuracy of grade, tonnage, and metal content predictions by comparing them with actual production. It directly impacts resource valuation, operational efficiency, and financial performance. A well-structured reconciliation system minimizes discrepancies, improves planning, and optimizes resource utilization.
🔹 Understanding Reconciliation
Reconciliation involves comparing:
✔️ Ore Reserve Models – Predictions based on exploration data
✔️ Grade Control Models – Adjustments made during mining
✔️ Mine Production Data – Tonnage and grade mined
✔️ Mill Processing Data – Final output and recoveries
By systematically analyzing these factors, mining operations can refine sampling, enhance estimation accuracy, and reduce variances.
🔹 Why Reconciliation Matters
✔️ Performance Measurement – Tracks actual production against planned targets
✔️ Resource & Reserve Validation – Ensures reliable valuation of mineral assets
✔️ Operational Efficiency – Identifies inefficiencies in mining and processing
✔️ Financial Transparency – Provides clear insights for stakeholders
🔹 Addressing Discrepancies
Variances between predicted and actual production often stem from:
⚡ Changes in orebody characteristics
⚡ Sampling and grade control errors
⚡ Mining and milling inefficiencies
⚡ Ore loss, dilution, and stockpile mismanagement
A robust reconciliation system helps pinpoint root causes, allowing proactive adjustments to mining strategies.
🔹 Example Copper Mine Reconciliation: Addressing Production Shortfalls
A major copper mine in South America projected 500,000 tonnes of Cu concentrate annually. By Q3, reconciliation revealed a 7% production shortfall, driven by:
❌ Ore dilution from blasting errors
❌ Overestimated grades in resource models
❌ Lower-than-expected milling recovery
🔹 Corrective Actions & Results
✔️ Refined grade control techniques for selective mining
✔️ Optimized ore blending to stabilize feed grade
✔️ Adjusted milling parameters to improve Cu recovery
Outcome: Production aligned with forecasts in six months, preventing financial losses and enhancing operational efficiency.
🔹 Business Impact: Turning Insights into Value
Minimizing the gap between planned and actual production enhances profitability by:
🔸 Lowering operational costs
🔸 Improving resource utilization
🔸 Enhancing accuracy in financial forecasting
Reconciliation is more than a technical process—it’s a key performance indicator for efficient, sustainable, and profitable mining operations. Continuous monitoring ensures long-term success.
La reciente noticia sobre Cobre Panamá suspendiendo arbitrajes y abriendo el diálogo con el gobierno marca un momento histórico que merece análisis. La matriz de evolución del conflicto minero en Panamá muestra claramente este cambio significativo en la trayectoria.
Lo que ha cambiado: 🔄
▪️ Cobre Panamá ha suspendido los arbitrajes contra el Gobierno Nacional
▪️ El presidente ha autorizado la exportación del concentrado almacenado
▪️ Se ha autorizado la reactivación de la planta eléctrica de 300 MW
▪️ Ambas partes han expresado disposición al diálogo constructiv
Impacto económico inmediato: 📈
▪️ Acciones de First Quantum subieron 15% en la Bolsa de Toronto
▪️ Posible recuperación del 5% del PIB perdido con el cierre de la mina
▪️ Potencial alivio para proveedores locales con pagos pendientes
▪️ Señal positiva para inversores internacionales en el mercado panameño
Revelaciones del análisis histórico: 🔍
Como muestra la matriz actualizada, estamos presenciando un posible cambio de trayectoria: del patrón CAÓTICO (2011-2024) hacia un nuevo escenario de colaboración basada en datos y diálogo.
Esta transición podría representar una nueva fase en la historia minera panameña, donde las decisiones se toman con base en:
▪️ Análisis técnico riguroso
▪️ Conciliación de intereses económicos y ambientales
▪️ Transparencia en los procesos
▪️ Beneficio compartido para todas las partes involucradas
La pregunta hacia el futuro: 🌱
¿Marcará este momento el inicio de un nuevo modelo de minería responsable en Panamá, donde el diálogo constructivo reemplace el conflicto, y donde los datos guíen mejores decisiones para el desarrollo sostenible del país?
¿Qué opinas? ¿Crees que Panamá está lista para este nuevo enfoque colaborativo en la gestión de sus recursos naturales?
The preparation and successful execution of negotiations is one of the key competences in procurement. This overview contains some of the central elements for developing this competence.
1️⃣ Every expert in negotiations once started with none. The integrated procurement competency model defines three levels for each competency area, starting with Advanced Beginner, Competent and Expert.
2️⃣ Negotiation is not an event, but a process. In addition to the preparation, execution and follow-up of a negotiation, there are also two phases for the annual, overarching planning of negotiations.
3️⃣ The following overview deals with negotiation tactics. Roughly speaking, the possible tactics can be divided into five groups: delay, collaboration, manipulation, power and pressure.
4️⃣ The right preparation for a negotiation is one of the success factors. There are 9 main areas to consider: (I) negotiating team, objectives and timetable; (II) power analysis; (III) BATNA and alternatives; (IV) facts and interests; (V) negotiation strategy; (VI) possible options; (VII) negotiation tactics; (VIII) compromises and concessions; and (IX) opening of negotiations.
5️⃣ In the centre is a form with the 9 areas described above. It is important to be clear about your own position as well as the possible position of the other party (the supplier).
6️⃣ In team negotiations, it is important to be clear about the different roles in a negotiating team and to prepare accordingly.
7️⃣ A negotiation always involves interaction between the negotiating parties. Where there is interaction, there can also be conflict. It is important to know your own preferences and the preferences of your own team members.
8️⃣ Your own preference does not always have to coincide with the strategy defined before the negotiation: (I) AVOID - procrastinate to win; (II) ADAPT - lose to win; (III) COMPETITION - win/lose; (IV) COOPERATE - win/win; and COMPROMISE - splitting the difference.
9️⃣ Finally, an overview of active listening with its 5 steps: encourage, clarify, circumscription, reflection, and confirmation.
Dr. Mario Büsch, Purchnet
https://www.linkedin.com/in/mariobuesch
Las operaciones de izaje requieren un alto nivel de seguridad. Un error en la selección del equipo o en la ejecución puede generar accidentes graves. Esta guía detalla normativas, tipos de eslingas, tablas de carga y mejores prácticas para un izaje seguro.
✅ 𝑰𝒏𝒄𝒍𝒖𝒚𝒆:
✔️ Normas y regulaciones internacionales.
✔️ Inspección y mantenimiento de equipos.
✔️ Factores de seguridad y cálculos de carga.
Source:
Martin Gamarra Estupiñan
Rock Bolting in Underground Mining: Enhancing Stability & Safety
Rock bolting is a critical ground support method in underground mining, designed to reinforce rock masses and prevent failures. The selection of bolt type and installation depends on rock mass quality, assessed using Rock Mass Rating (RMR) and Geological Strength Index (GSI), as well as excavation size and mining method.
🔹 Rock Types & Classification:
• Good Rock (RMR: 61-80, GSI: 60-80) – Minimal support required, standard bolting.
• Fair Rock (RMR: 41-60, GSI: 40-60) – Systematic bolting with grouted rebar.
• Poor Rock (RMR: 21-40, GSI: 20-40) – Reinforced bolting with mesh and shotcrete.
• Very Poor Rock (RMR <20, GSI <20) – Cable bolts, shotcrete, and systematic reinforcement.
🔹 Bolt Types & Applications:
• Mechanical Bolts (Split Set, Expansion Shell) – Quick support in competent rock.
• Resin-Grouted Bolts (Rebar, Dowel) – Strong anchorage for weak rock.
• Cable Bolts – Deep anchorage for poor rock conditions and large spans.
• Self-Drilling Bolts (SDA) – Ideal for fractured rock, grouted during installation.
• Friction Bolts (Swellex, Split Set) – Fast installation for dynamic conditions.
• Super Bolts – High-capacity, long bolts (6m+) for deep-seated failures.
🔹 Bolt Dimensions & Spacing:
• Diameter: 16mm – 39mm (common sizes: 22mm – 32mm).
• Length: 1.2m – 6m (cable bolts may exceed 6m).
• Spacing: Typically 1m – 1.5m apart, depending on ground conditions.
🔹 Geotechnical Inspection & Monitoring:
• Pull Testing for load verification.
• Displacement Monitoring (extensometers, convergence meters).
• Ultrasonic & Acoustic Testing for bolt integrity.
• Numerical Modeling (FLAC3D, RS2, Map3D) to predict stability.
Proper bolt selection, systematic reinforcement, and geotechnical monitoring are key to safe and efficient underground operations. What bolting strategies do you use in your operations?
This collection of "Daily Toolbox Talks" represents key topics that supervisors can present to their teams as part of workplace accident prevention campaigns.
These talks emphasize general safety principles and personal conduct, as we believe that, despite being common sense, reinforcing these messages is essential in any safety program.
These are among the leading causes of workplace accidents and injuries, according to industry experience. Our goal is to strengthen prevention against the greatest risks that workers face daily.
There is no strict order for these talks—they should be used based on the specific needs of the company and the tasks being performed, taking advantage of the right opportunities to maximize their impact.
Source: Occupational Health and Safety Network, Gamal Mamdouh
Source: Credit to T.P Varghese, Expert Trainers Academy
=> Part two of a series on NI 43-101 myths
Ever since NI 43-101 came into effect, people have been drawn to the idea that a “qualified person” bears some outward and visible sign—perhaps an ID card, a secret handshake or a “QP” tattooed on the back of the neck. Regulatory staff have long had to push back on this idea, trying to explain that the QP is not a licence, designation, framed certificate or secret decoder ring, but purely a regulatory concept, which exists in the rule for one reason: to identify the professional taking responsibility for disclosure.
The following dialogue tries to state some of the myths around QPs. And because we love stacking the deck, we’ve stuffed a straw man to assert them and to pose all the questions.
=> I am a qualified person.
Nobody “is” a qualified person, becomes one or stays one. A professional geoscientist or engineer acts as a QP by taking responsibility for a given item of a company’s disclosure. Not everyone can do that; restrictions in NI 43-101 demand education, experience and professional registration. But the QP is the person that approved a specific item of disclosure.
=> A P.Geo. or a P.Eng. is a qualified person.
Don’t confuse a licence—the shingle and stamp of a professional—with the QP’s function: taking responsibility for information disclosed to the public. You need the licence or designation to perform the function, but they are always two different things. Equally, don’t confuse meeting each criterion to act as a QP with the right to practise anywhere—they’re not the same.
=> The professional associations determine who is a QP.
Professional associations determine who holds a licence or registration, in accordance with professional statutes in Canada, or with laws or self-regulating internal rules elsewhere. That is only one of the hurdles a professional must get over before assuming responsibility for public disclosure.
=> The regulators determine who is a QP. You need to be approved.
Not true. Regulators look at a professional’s background and experience and may challenge a company over that professional’s fitness to act as a QP for a specific item or aspect of public disclosure. But regulators don’t deliver a broad approval or disapproval of the professional; it is specific to the item of disclosure the company wants that professional to approve.
=> You need five years of experience to act as a QP.
Not exactly. It takes five years of total experience. But enough of that experience must be relevant to the subject matter at hand to show that the professional fully understands the information he or she is approving.
=> Relevant experience means working in the same commodity, in the same geological setting, doing the same kind of work.
No. Endless subdividing of deposit types, skill sets, target commodities, environments and job functions is not the point of “relevant” experience. How can anyone get identical experience when no two mineral deposits are identical? Slicing and dicing experience, ever more finely, ends with each project having exactly one person on earth that can act as a QP.
The question of relevant experience is not limited to the commodity sought and is better reflected by the integration of the geological setting and the type of knowledge being applied. In exploration and estimation, having experience in similar geological settings matters much more than having experience with the same commodity. In other facets of the work, the commodity may have little or no relevance—think rock mechanics or tailings dam design. Far more important is sticking to the work you’re educated for; too many geologists try to sign off on plant designs and infrastructure.
=> I need to register as a QP. Where do I go?
No, you don’t need to register as a QP. Rather, you do need to be registered with a professional association. Go forth and register. Meeting the requirements to take responsibility for disclosure (acting as a QP) remains a self-assessment. If you don’t understand the requirements, including registration, you likely should not act as a QP.
Victoria Yehl, P.Geo., is manager of mining at the British Columbia Securities Commission. James Whyte, P.Geo., retired last year from his role as senior geologist at the Ontario Securities Commission. Both authors are writing in their private capacity.
https://magazine.cim.org/en/ni-43-101-myths/i-am-a-qualified-person-en/
Source: Erik Ronald
Source: Credit to: Victoria Yehl, Jim Whyte and CIM Magazine
Development of Komatsu's lunar construction equipment began in 2021. The goal is to realize mankind's dream of going to space and building a base on the moon for long-duration stays. However, it is not an easy task to develop lunar construction equipment that can work in the harsh lunar environment as it does on Earth.
At present, the lunar construction equipment project team consists of about 10 members, each with knowledge and experience in his or her specialty.
We asked the three members, who are trying to overcome various challenges in this project.
Source: https://www.komatsu.jp/en/aboutus/brandcommunication/lunar-construction/interview
video: https://youtu.be/JL4tjI2lSvw?si=q9d0F2nNB_Pxtc3r
LEX Africa is an Alliance of leading African law firms founded in 1993 with over 700 lawyers in 29 African countries. LEX Africa effectively covers the entire African continent and has a more than 30 year track record of assisting and advising clients on their African business and other activities.
Each member is a full service business law firm with expert knowledge and experience in both local law and the local business, political, cultural and economic environment. LEX Africa accordingly provides a “one stop shop” and Pan African legal team for cross border and domestic African legal solutions to clients wherever they wish to do business in Africa.
Africa is a key source of minerals for the world and mining remains a very import source of African revenue and investment. Understanding the heavily regulated mining sector is vital for success in this sector and we are proud to launch our updated 2025 Mining Guide which summarises the applicable laws and regulations in 21 African countries.
Many thanks are due to all our contributors and editors. I trust the Guide will continue to assist mining companies and others interested in African mining.
Chairperson of LEX Africa
Pieter Steyn
Source: BANGALI Dédia
In the world of underground mining, safety is not an option it’s a necessity! After blasting operations, the work environment must meet international standards to ensure worker safety.
Oxygen Level: Must be between 19.5% and 23% to ensure proper breathing.
Carbon Dioxide (CO₂): Should not exceed 0.5% to avoid suffocation risks.
Carbon Monoxide (CO): Less than 25 ppm, as it’s highly toxic even in small concentrations.
Methane (CH₄): Less than 1% to prevent explosion hazards.
Airflow Speed: Should not be less than 0.3 m/s to ensure sufficient ventilation and air distribution.
Temperature: The maximum safe working temperature is 35°C, considering humidity levels.
Regular gas monitoring and proper ventilation are the first lines of defense to protect everyone working in this field.
India has applied to the International Seabed Authority (ISA) for two new licenses to explore parts of the Indian Ocean sea bed for minerals crucial to the green energy transition. If they are granted, India would hold four contracts, making it the country with the second highest number of active contracts for deep sea mining exploration projects in the world. As the following chart based on ISA data shows, China currently has five contracts, making it the leading country in terms of contracts for permitted deep sea mining exploration.
There are currently 31 contracts that have been signed off on by the ISA, 30 of which are active, and each of which last 15 years. Several of these involve governmental entities - for example, the Government of India, the Government of Poland, the Government of the Republic of Korea all appear on the ISA website. However, the majority are private companies that have so far directly engaged in contracts for deep-sea mining with the ISA.
There are three main categories of deep sea mineral exploration: finding and collecting polymetallic nodules (PMN), polymetallic sulfides (PMS) and cobalt-rich ferromanganese crusts (CFC) in the deep seabed. India’s two new proposed contracts apply to the latter two methods, first for the exploration of PMS in the Carlsberg Ridge of the Central Indian Ocean and secondly for the exploration of CFC in the deep seabed of the Afanasy-Nikitin Seamount in the Central Indian Ocean.
According to the ISA, the majority of companies looking into seabed exploration are focused on polymetallic nodules (19; with 17 of these focused on the Clarion-Clipperton Fracture Zone), followed by polymetallic sulfides (7) in the Southwest Indian Ridge, Central Indian Ridge and the Mid-Atlantic Ridge and then only 5 companies looking into polymetallic crusts in the Western Pacific Ocean.
As Gaby Ramirez and Tina Lee’s article for Unbias the News outlines, the issue of deep sea mining is a complex and divisive one. Supporters argue that in order to manage a successful green transition, we will need more of these precious metals and fast. Critics argue, on the other hand, that far more information is needed before further action can be taken, namely on how such extractions will impact the environment of what has been called the “final frontier” of the Earth.
La conception d’un plan de tir minier est une tâche complexe qui nécessite une compréhension approfondie des nombreux paramètres interdépendants influençant l’exécution des tirs dans les massifs rocheux. Ce résumé présente les principales contraintes à considérer lors de cette conception.
1️⃣ Diamètre du Trou de Foration
Le diamètre du trou de forage est un élément crucial qui doit être adapté aux objectifs de tir et aux conditions d’abattage. Un diamètre plus large permet une détonation plus rapide et une meilleure fragmentation, mais peut également entraîner une distribution inefficace de la charge en raison d’un bourrage excessif. Dans les massifs fracturés, une maille plus grande peut compromettre la fragmentation souhaitée.
🎯 Facteurs influençant le choix du diamètre :
💦 Environnement :Le niveau de vibration et de bruit dépend de la charge utilisée.
💦 Structure du massif :Influence la granulométrie et le choix du diamètre.
💦 Engin de chargement : Nécessite un type de fragmentation spécifique.
💦 Nature de l’explosif : Sa vitesse de détonation varie avec le diamètre.
💦 Hauteur du front à abattre :Un abaque peut aider à évaluer la relation entre le diamètre de forage et la hauteur à abattre.
2️⃣ Inclinaison du Trou
L'inclinaison des trous de forage contribue à améliorer la qualité de la fragmentation sans augmenter significativement les coûts. Les avantages des trous inclinés incluent :
☘️ Stabilité des gradins : Les talus inclinés offrent une meilleure tenue.
☘️ Optimisation de la consommation d’explosifs.
☘️ Élimination des inconvénients liés au rebord.
Ces avantages expliquent la popularité croissante de cette méthode dans les carrières et mines à ciel ouvert.
3️⃣ Excès de Forage (Sous Forage)
L'excès de forage est essentiel pour augmenter l’efficacité du tir dans la partie inférieure du gradin, facilitant ainsi le travail des engins de chargement. La longueur de sous-forage dépend de plusieurs facteurs :
✨ Hauteur du gradin.
✨ Diamètre du trou.
✨ Propriétés de l’explosif et des roches.
En général, elle doit être environ 0,3 fois la hauteur du gradin, bien que son efficacité puisse diminuer en présence de discontinuités horizontales.
4️⃣ Longueur du Trou
La longueur du trou est déterminée par la hauteur du gradin, l’inclinaison et la longueur d’excès. Elle joue un rôle clé dans la distribution de l’énergie lors du tir. Cependant, atteindre une distribution idéale de la charge est complexe, notamment pour les trous longs.
5️⃣ Propriétés de la Matrice Rocheuse
Les caractéristiques physico-mécaniques, acoustiques et hydrologiques de la matrice rocheuse sont essentielles pour la conception du plan de tir. Les propriétés importantes incluent :
✅ Densité.
✅ Résistance à la traction et à la compression.
✅ Module de Young.
✅ Coefficient de Poisson.
✅ Impédance acoustique.
Par: Gwenaelle Erika Lekane Yakap
Raw materials are the backbone of the economy. The sufficient supply of mineral raw materials under fair market conditions is essential for a sustainable and well-functioning economy. Although the geological availability of minerals is relatively high, occurring disruptions can lead to a shortfall of mineral resources. Smouldering geopolitical crises and wars in Ukraine and Gaza relentlessly demonstrate our vulnerability in a globalized world with its complex dependencies and widely ramified value chains.
Raw materials are necessary to secure our future viability and to solve the grand challenges in the fields of climate and energy, health, nutrition, mobility, digitalisation and security and defence. To foster the security of supply of commodities especially critical raw materials, fair trade, innovations along the entire value chain and the expansion of the circular economy are part of the solutions. Additionally, domestic production contributes to independence and strategic autonomy. A holistic and cross-policy approach is needed to meet these major challenges.
Fact-based knowledge of mineral production, market concentrations and production trends are the basis of foresighted policy and decision-making. This can help to identify potential short or medium-term supply risks. I am delighted that the annual publication "World Mining Data" has served as a valuable basis for commodity forecasts of renowned national and international institutions for 39 years. In this way, the Austrian Federal Ministry of Finance provides an important contribution to international resource policy.
I would like to express my sincere gratitude to Austrian representations abroad as well as to international institutions for their support and active participation regarding this publication.
Dr. Magnus Brunner
Federal Minister of Finance
Source: https://www.world-mining-data.info/
Source: Credit to: Austrian Federal Ministry of Finance
✅L’employeur est responsable de la santé et de la sécurité des salariés sur les chantiers.
📚Le Code du travail l’oblige à mettre en œuvre des moyens particuliers pour prévenir les risques identifiés (Code du travail, art. L. 4121-1).
Or pendant les mois Ramadan et Carême, le salarié est soumis à des risques supplémentaires pour sa santé, notamment à cause de la déshydratation.
Il ne faut pas négliger également les risques liés à la sécurité, le Ramadan étant une période de jeûne où les personnes dorment peu.
Or la fatigue entraîne des baisses de vigilance.
Il est donc nécessaire d’informer les salariés des règles minimales à respecter pour assurer leur propre santé et sécurité :
Respecter une hygiène de vie adaptée aux exigences du poste de travail, par exemple les heures de sommeil pour assurer la concentration des conducteurs d’engins ;
🌿Boire beaucoup d’eau juste avant la levée du jour et consommer des sucres lents (pâtes, riz, céréales, etc.) ;
Se reposer pendant les pauses dans un lieu calme et frais.
Une des difficultés réside dans le fait que le suivi du Ramadan est un choix privé du salarié et qu’il n’a aucune obligation d’en informer l’employeur.
🛑Mais le salarié ne peut se prévaloir du suivi d’un jeûne pour justifier des erreurs ou le non-respect des cadences habituelles de travail.
Sachant que l’employeur peut valablement le sanctionner, le salarié a donc tout intérêt à échanger en amont avec lui de la meilleure façon de concilier le jeûne et son travail.
✅Réaliser une communication générale sur la problématique du travail sous la chaleur, incluant les difficultés spécifiques du Ramadan, peut conduire les salariés concernés à venir d’eux-mêmes échanger avec l’employeur.
Cela sera l’occasion de réfléchir ensemble à d’éventuelles adaptations de leurs conditions de travail.
✅Adapter les conditions de travail sur chantier pendant le Ramadan
Plusieurs possibilités existent afin de limiter au maximum la pénibilité accrue du travail pour les salariés réalisant le Ramadan.
✅Leurs mises en œuvre dépendent de la nature du chantier, du poste du salarié, du lieu d’exécution ou du nombre de salariés présents.
Une pratique habituelle correspond à réaffecter les salariés sur des postes moins exposés aux risques.
🌿L’organisation du travail sur le chantier doit aussi être pensée de façon à éviter que le salarié soit isolé.
La présence en permanence d’un collègue assure une réaction rapide en cas de survenance d’un accident ou d’un malaise du salarié.
✅Enfin, décaler les heures de travail reste une bonne pratique si elle est possible. On peut ainsi prévoir de commencer la journée de travail plus tôt pour limiter les impacts de la chaleur.
🪢Cela nécessite de vérifier l’accessibilité du chantier à ces horaires, l’organisation avec les autres.
Des désaccords peuvent intervenir entre les salariés suivant ou non le Ramadan. C’est alors à l’employeur qu’il incombe de trancher et de fixer les horaires de travail.
Ne forcer aucune situation⛑️👌❗
En el sector minero, cada etapa del proceso requiere la intervención de profesionales con habilidades y experticias específicas. Desde el descubrimiento del yacimiento hasta la explotación y el cierre de la mina, cada rol juega un papel crucial en el éxito del proyecto.
En las etapas de prospección y exploración, el geólogo es el protagonista. Su trabajo de investigación y análisis es fundamental para descubrir y caracterizar el yacimiento; sin embargo, requiere el apoyo del área de 𝙍𝙚𝙡𝙖𝙘𝙞𝙤𝙣𝙚𝙨 𝘾𝙤𝙢𝙪𝙣𝙞𝙩𝙖𝙧𝙞𝙖𝙨, pues, si durante todo el tiempo que dure la evaluación del yacimiento no se cuenta con la aceptación del proyecto, algo se hizo mal durante todo ese tiempo, y la empresa debe replantearse los objetivos centralizando sus esfuerzo para obtener esta aceptación.
Una vez que se ha confirmado la viabilidad del proyecto, el 𝙞𝙣𝙜𝙚𝙣𝙞𝙚𝙧𝙤 𝙙𝙚 𝙢𝙞𝙣𝙖𝙨 toma el relevo. Su experiencia y conocimientos son esenciales para diseñar y ejecutar la explotación de la mina de manera segura y eficiente.
Y es que la explotación es la etapa más larga y crítica del proceso minero. Es aquí donde se extrae el mineral y se genera el valor económico del proyecto. Por lo tanto, 𝙚𝙨 𝙛𝙪𝙣𝙙𝙖𝙢𝙚𝙣𝙩𝙖𝙡 𝙦𝙪𝙚 𝙚𝙡 𝙧𝙚𝙨𝙩𝙤 𝙙𝙚 á𝙧𝙚𝙖𝙨 𝙙𝙚𝙡 𝙥𝙧𝙤𝙮𝙚𝙘𝙩𝙤 𝙚𝙨𝙩é𝙣 𝙙𝙞𝙨𝙥𝙪𝙚𝙨𝙩𝙖𝙨 𝙖 𝙙𝙚𝙟𝙖𝙧𝙨𝙚 𝙜𝙪𝙞𝙖𝙧 𝙥𝙤𝙧 𝙡𝙤𝙨 𝙞𝙣𝙜𝙚𝙣𝙞𝙚𝙧𝙤𝙨 𝙙𝙚 𝙢𝙞𝙣𝙖𝙨, quienes son los expertos en la explotación de la mina.
Es importante reconocer que, en cada etapa del proceso, el protagonismo cambia. 𝙇𝙤𝙨 𝙥𝙧𝙤𝙛𝙚𝙨𝙞𝙤𝙣𝙖𝙡𝙚𝙨 𝙙𝙚𝙗𝙚𝙣 𝙚𝙨𝙩𝙖𝙧 𝙙𝙞𝙨𝙥𝙪𝙚𝙨𝙩𝙤𝙨 𝙖 𝙘𝙚𝙙𝙚𝙧 𝙚𝙡 𝙥𝙖𝙨𝙤 𝙮 𝙩𝙧𝙖𝙗𝙖𝙟𝙖𝙧 𝙚𝙣 𝙚𝙦𝙪𝙞𝙥𝙤 𝙥𝙖𝙧𝙖 𝙜𝙖𝙧𝙖𝙣𝙩𝙞𝙯𝙖𝙧 𝙚𝙡 é𝙭𝙞𝙩𝙤 𝙙𝙚𝙡 𝙥𝙧𝙤𝙮𝙚𝙘𝙩𝙤.
Pero, ¿qué sucede si falta alguno de los ingredientes clave? Un proyecto sin reservas minerales no se convierte en mina. Un proyecto sin aceptación social, no se convierte en mina. Una mina sin personal competente no se desarrolla.
Es aquí donde el personal de RRHH juega un papel fundamental. Deben estar 𝙥𝙧𝙚𝙥𝙖𝙧𝙖𝙙𝙤𝙨 𝙮 𝙘𝙤𝙣𝙤𝙘𝙚𝙧 𝙚𝙡 𝙥𝙧𝙤𝙘𝙚𝙨𝙤 𝙢𝙞𝙣𝙚𝙧𝙤, no es lo mismo movilizar o contratar personas para actividades administrativas, que personal técnico y personal operacional de mina.
Todas las áreas deben trabajar en estrecha colaboración con los equipos técnicos para identificar las necesidades de personal y desarrollar planes de capacitación y desarrollo para garantizar que el personal tenga las habilidades y competencias necesarias para llevar a cabo el proyecto de manera segura y eficiente.
Reconocer y valorar el trabajo de cada una de las áreas es esencial para garantizar que el sector minero siga siendo una fuente de empleo y desarrollo para las comunidades locales.
I would like to share the presentation material about Experimental Variogram that I delivered in the Geostatistics class in the S1 Mining Engineering study program ITB.
This material begins with a brief overview of Regionalized Variables and Autocorrelation, before focusing on the concept and calculation of Experimental Variograms. In this session, students also had the opportunity to perform variogram calculations manually as an exercise in class. In closing, I gave homework so that they could repeat and deepen their understanding of the material they had learned.
Hopefully this material will be useful, not only for those who are involved in the mining world, but also in various other fields that apply geostatistics.
Joachim Braun, Division President, and April Whitson, Division VP of Human Resources at ABB Process Industries, discuss how technological advancement and diversifying the mining workforce are interlinked as the mining industry strives to overcome the skill shortage amid the green energy transition.
The mining industry is facing a global shortage of skilled workers while, at the same time, needing to meet increasing demand for critical minerals, driven by the energy transition. Traditionally, remote locations, harsh working conditions, and outdated perceptions have made recruitment difficult. According to ABB’s recent ‘Mining’s Moment’ report, the industry must attract a larger, more varied pool of talent to increase production while progressing decarbonisation efforts. In fact, 46% of respondents confirmed diversity, equity, and inclusion as a powerful driver of ESG across the industry. Transforming mining into a high-tech and purpose-driven industry by harnessing the latest technological advancements in automation, electrification, and digitalisation to become more sustainable and safer, can attract a broader, more diverse workforce, and secure the sector’s long-term success.
=> Safer conditions and greater work-life balance
Technological solutions are revolutionising the mining industry and remote working is eliminating the need for on-site presence in isolated or hazardous situations. These advancements are especially significant in remote regions, such as Chile or Western Australia, where operations can now be managed hundreds of miles away, minimising risk and allowing for safer working conditions.
Remote working not only improves safety, but also makes the mining industry more accessible to a broader talent pool. The future workforce, particularly younger people, prioritise flexibility and work-life balance. Automation offers the opportunity to meet these desires, providing greater autonomy and safety while allowing them to manage operations from virtually anywhere. This shift is changing the way mining is perceived, helping to attract and retain talent that may have once overlooked the industry due to outdated perceptions.
=>New skills and newer technology
As automation and data-driven systems become more integral to mining operations, there is an increasing need for workers with advanced digital literacy and technical skills. Currently, 44% of mining companies cite limited expertise and skills as significant barriers to decarbonisation. To retain industry expertise and prepare the next generation of workers, upskilling initiatives are essential. Already, 70% of respondents are committing to reskilling and training employees to provide the expertise needed to drive decarbonisation efforts.
Emphasis on new technologies, in addition to better work-life balance, also plays a significant role in attracting the next generation of workers who are often looking to work for companies at the forefront of innovation. The report found 68% of mining executives view technology as a driver for diversity and a solution to attracting younger generations to work within the industry.
=> A new era of mining for future generations
Ultimately, the future of mining will be defined by innovation and empowerment. As automation, electrification, and digitalisation continue to evolve, they will reshape the mining industry into a safer, more flexible, and attractive field for the next generation of workers. Many young professionals seek careers that offer growth, purpose, and impact, and the mining sector’s crucial role in the green energy transition presents a compelling opportunity. By positioning mining as an innovative, purpose-driven industry, companies can align with the values of the future workforce, offering fulfilling careers and the opportunity to transform the sector.
Source:
https://www.globalminingreview.com/mining/18022025/minings-moment-to-attract-a-new-generation-of-talent/
Source: Credit to Jess Watts, Global Mining Review
Geologists define resources.
Mining engineers extract them.
Metallurgists process them.
Yet, they rarely communicate well with each other.
In countries like Canada, the US, and Australia, mining education is structured along rigid disciplinary lines. Geologists spend years studying ore deposit formation, geochemistry/mineralogy and geostatistics, but rarely learn how their models affect downstream processing.
Mining engineers focus on extraction and haulage techniques, but often overlook how blasting impacts processing. While metallurgists optimize processing circuits without considering how geological variability influences plant performance.
By the time they enter the workforce, they already think in silos.
These divisions date back to the early 20th century when mining education mirrored industry workflows: geologists found the ore, engineers mined it, and metallurgists processed it—each in isolation.
By the 1980s, accreditation bodies reinforced these divisions. Committees of retired industry professionals resisted changes that might “dilute” technical expertise. Curricula stagnated while the industry evolved.
Mining has changed drastically since the 90s.
Yet, universities still train professionals in isolation.
What does this look like in practice?
Modern geology programs analyze ore deposits in extreme detail but rarely consider how models influence mine planning or processing. As John Steen of UBC’s Bradshaw Research Initiative put it:
“Engineers don’t design for the orebody because they’ve never been taught to integrate geological variability into their models.”
The result? Mines are designed based on optimistic ore interpretations, often overlooking real variability. When the orebody is more complex than expected (which it almost always is), engineers and metallurgists scramble to compensate.
Mining engineers, trained to maximize extraction efficiency, prioritize high-tonnage bulk mining without considering processing impacts.
And metallurgists?
They inherit these problems without having been involved in the decisions that caused them. Processing programs emphasize extraction techniques but often overlook the geological origins of ore variability. Graduates excel at mass balancing and circuit design but struggle to optimize processes for fluctuating feed grades or mineralogical complexities.
These silos create a culture of risk avoidance.
It doesn’t have to be this way.
In Brazil, where I studied (Escola Politécnica da USP), mining education is different. Instead of separate geology, mining, and processing degrees, we study Mine Engineering—a multi-disciplinary program integrating exploration, extraction, processing, and tailings management.
And the difference is clear.
Thinking across disciplines prevents problems from being designed into operations before they even start.
Global silver demand has surged in recent years, outpacing supply since 2020. This imbalance underscores the critical importance of untapped silver resources in meeting future demand. Undeveloped silver projects are poised to play a vital role in addressing the need for this valuable metal, which is essential in industries such as electronics, solar panels, jewelry, investment, healthcare, and green tech.
=> Latin America: A Hub for Untapped Silver Resources
A closer look at the largest projects reveals that Mexico, Bolivia, and Peru are home to some of the world's most significant undeveloped silver projects. These nations are positioned to become key players in supplying silver to meet future global needs.
=> Spotlight on Major Projects
1. Metates (Mexico): Located in Durango State, Mexico, Metates is a massive project owned by Chesapeake Gold Corp. It boasts a significant amount of both gold and silver, making it a very valuable find. It contains approximately 19.8 million ounces of gold and 542 million ounces of silver in measured and indicated resources.
2. Cordero (Mexico): Another large silver deposit in Mexico, Cordero is known for its potential to produce a substantial amount of silver over a long period. It is one of the largest undeveloped silver deposits in the world, with an estimated 1.3 billion ounces of silver equivalent. The project has capacity to produce an average of 33 million ounces of silver equivalent per year for 18 years.
3. Iska Iska (Bolivia): Discovered in 2020, Iska Iska is a significant find in Bolivia. It contains a variety of valuable metals, including silver, tin, zinc, lead, and gold. It contains 1.15 billion ounces of silver equivalent. Located in the Potosí region, this large-scale project is regarded as one of the most significant recent mineral discoveries, potentially becoming a world-class mining operation for Bolivia.
=> Other Noteworthy Silver Projects
• Corani (Peru): 225 Moz (P&P)
• Silver Sand (Bolivia): 202 Moz (M&I)
• Carangas (Bolivia): 171 Moz (M&I)
• DeLamar (USA): 143 Moz (M&I)
• Diablillos (Argentina): 123 Moz (P&P)
• Calico (USA): 110 Moz (M&I)
• Berenguela (Peru): 101 (M&I)
• Panuco (Mexico): 94 moz (Inferred)
• Panuco (Mexico): 88 Moz (M&I)
• Eskay Creek (Canada): 88 Moz (P&P)
• Cerro Las Minitas (Mexico): 83 Moz (Inferred)
• San Diego (Mexico): 82 Moz (Inferred)
=> The Future of Silver Production
As the global economy continues to grow, these untapped resources represent a crucial opportunity for the mining industry to meet future needs. Beyond their economic potential, these projects can contribute significantly to the development of local communities by creating jobs and generating revenue. With many of the largest deposits located in Latin America, the region is set to play a pivotal role in shaping the future of silver production.
Owner Project M&I Resources Category
Chesapeake Gold Metates 542 M M&I
Discovery Silver Cordero 493 M M&I
Eloro Resources Iska Iska 273 M Inferred
Bear Creek Mining Corani 225 M P&P
New Pacific Metals Silver Sand 202 M M&I
New Pacific Metals Carangas (Upper Silver Zone) 171 M M&I
Integra Resources DeLamar 143 M M&I
AbraSilver Resource Diablillos 123 M P&P
Apollo Silver Calico 110 M M&I
Aftermath Silver Berenguela 101 M M&I
Vizsla Silver Panuco 94 M Inferred
Vizsla Silver Panuco 88 M M&I
Skeena Resources Eskay Creek 88 M P&P
Southern Silver Exploration Cerro Las Minitas 83 M Inferred
Silver Storm Mining San Diego 82 M Inferred
Source: Company presentations & reports
https://www.miningvisuals.com/post/silver-s-future-lies-underground-the-role-of-untapped-resources
Desired for millennia because of its shine and rarity, gold is still the safe haven asset (with fairly decent returns) in times of uncertainty.
This chart examines a hypothetical question of how much gold every person in the world would get if all discovered gold was shared equally.
Data for this graphic is sourced from the U.S. Geological Survey and from the UN’s World Population Prospects 2024.
=> There’s Not a Lot of Gold for 8 Billion People
Turns out, there really isn’t a lot of gold in the world.
To date, only 244,000 metric tons of gold have ever been discovered. This includes historical production and current known discoveries.
That works out to about 30 grams (about one troy ounce), or six gold rings, for every single human being on the planet.
Categories Figures
Gold Discovered
(Metric Tons) 244,000
World Population 8,161,972,572
Gold per Person
(Metric Tons) 0.00002989
Gold per
Person (Grams) 29.89 (or one ounce)
Of course, jewelry isn’t the only use of gold (though it does account for the largest share of above-ground use).
Central banks have quite a bit in their reserves, with the U.S. holding the most at roughly 8,000 tonnes.
At sixth place China (2,200 tonnes) has been steadily increasing its reserves in the past year, in a bid to diversify foreign exchange reserves away from the U.S. Treasury bonds.
=> Largest Gold Producers
And then there’s all the gold beneath the ground, spread out in massive mines across the world. Of them, Australia is home to two in the top 10, and is also the second-largest producer.
Who’s the largest producer? That’s China—even though it doesn’t have any large mines on the same scale as those found in the U.S. and Australia. Instead it has numerous smaller ones, and coupled with efficient smelting infrastructure, ends up producing more volume.
Finally, South Africa held the top supplier spot between 1900–1970. Its production peaked at about 1,000 tonnes annually, the most by any country in a single year.
Employers are encouraged to use this document to learn how they can use leading indicators to improve safety and health outcomes in the workplace. While large businesses may already be familiar with the benefits of using leading indicators, many small and medium-sized businesses may not know what they are or how to use them. This document can help such businesses get started. This document may also be useful to large businesses seeking new approaches to using leading indicators.
“Today, EHS practitioners continue to rely on injury rates, absenteeism, and other lagging metrics despite the growing acceptance of the fact that these failure-focused measures are ineffective in driving continuous improvement efforts. Leading indicators, on the other hand, appear to offer a more useful gauge of EHS activity by providing early warning signs of potential failure and, thus, enabling organizations to identify and correct deficiencies before they mature into accidents and injuries.”
Source: Omar Raul Párraga Rodriguez
Source: Credit to Occupational Safety and Health Administration, OSHA
In an era of soaring metal prices, the industry's emphasis has shifted towards swift execution rather than cost-effective functionality. Amid declining grades, rising expenses, and market fluctuations, technology-driven design stands at a crucial juncture. The mining and related sectors often opt for shortcuts based on past experiences. Many current norms may no longer align with future needs. Swift design practices also rely on rigid constraint modeling, favoring costly high-capacity solutions for consistent performance, in dynamic mining conditions. Detailed ore body assessments for more frugal designs, are reduced due to time constraints, leading to designs that often unnecessarily exceeding inherent needs.
The industry now needs revert to traditional yet effective approaches, emphasizing frugal functionality with an owner's mindset approach. Incorporating human elements alongside technical aspects, a simplified approach involving industry observation, learning, and agile experimentation through an agile Technology Readiness Level (TRL) framework, can enhance outcomes from exploration to production.
A strategic shift towards 'Simply Smart' aims for substantial improvements by exploring seemingly unconventional methods and addressing complex challenges within a five-year timeframe. Offline design teams can collaborate to explore innovative solutions to streamline functionalities, before integrating them back into the operational structure effectively.
Embracing a 'Try More Faster' approach, focusing on adaptation, streamlines innovation projects and accelerates the adoption of proven solutions. Rapid prototyping facilitates the integration of alternative methods through scalable prototypes, ensuring a smooth transition without disrupting core operations. Practical adopters within organizations play a vital role for this, driving change by addressing implementation challenges and influencing widespread acceptance of innovations.
¿Sabías que los KPIs (Key Performance Indicators) son esenciales para el éxito empresarial? 🤔📈💼 Son métricas clave que permiten medir el rendimiento y tomar decisiones estratégicas. Sin ellos, sería imposible saber si se están alcanzando los objetivos o si es necesario ajustar la estrategia.
📊 ¿Por qué son tan importantes los KPIs?
✔️ Evalúan el progreso hacia los objetivos.
✔️ Identifican áreas de mejora y oportunidades de crecimiento.
✔️ Permiten monitorear el rendimiento del equipo.
✔️ Ayudan a mantener el enfoque en lo que realmente importa.
🔹 12 pasos para un KPI efectivo
🟢 Nivel Básico:
1️⃣ Definir el nombre del KPI.
2️⃣ Alinear el KPI con un objetivo estratégico.
3️⃣ Establecer el valor, referencia y meta.
4️⃣ Diseñar el proceso de recopilación de datos.
🔵 Nivel Experto
5️⃣ Identificar indicadores clave.
6️⃣ Definir el peso del KPI.
7️⃣ Acordar la frecuencia de actualización.
8️⃣ Establecer la fecha de caducidad.
9️⃣ Calcular el costo de seguimiento.
🔟 Asignar roles y responsabilidades.
1️⃣1️⃣ Definir escenarios de uso.
1️⃣2️⃣ Analizar la diferencia entre proyección y realidad.
What we’re showing
This graphic breaks down the market value of the entire global mining industry, as of Jan. 16, 2025, using data from Companiesmarketcap.com
Note that this data only covers publicly-traded companies.
Australia and Canada Lead 🏆
Australia tops the list, with its major mining companies totaling $353 billion in market capitalization. The country is home to two of the biggest miners in the world, BHP and Rio Tinto.
Rich in minerals, Australia is the world's largest producer of iron ore, essential for steel production, and lithium, a key component in batteries.
While Canada’s economy has struggled to keep pace with its southern neighbor, its mining industry remains formidable.
The country’s mining sector has a combined market capitalization of $344 billion, making it the second-largest globally.
Canada, the world’s second-largest country by land area after Russia, has vast natural resource wealth. It is particularly rich in gold, copper, nickel, and potash.
United States with miners totaling $228 billion and China with companies totaling $206 billion come in third and forth, respectively.
Dataset
Country Company Market Cap (USD)
🇦🇺 Australia BHP Group 125B
🇦🇺 Australia Rio Tinto 97B
🇦🇺 Australia Fortescue 36B
🇦🇺 Australia Northern Star 12B
🇦🇺 Australia South32 10B
🇦🇺 Australia Evolution Mining 7B
🇧🇷 Brazil Vale 37B
🇨🇦 Canada Agnico Eagle Mines 43B
🇨🇦 Canada Barrick Gold 28B
🇨🇦 Canada Wheaton Precious Metals 27B
🇨🇦 Canada Nutrien 26B
🇨🇦 Canada Franco-Nevada 24B
🇨🇦 Canada Teck Resources 22B
🇨🇦 Canada Cameco 22B
🇨🇦 Canada Ivanhoe Mines 15B
🇨🇦 Canada Kinross Gold 13B
🇨🇦 Canada First Quantum Minerals 11B
🇨🇦 Canada Alamos Gold 8B
🇨🇦 Canada Pan American Silver 8B
🇨🇦 Canada Lundin Mining 7B
🇨🇦 Canada Lundin Gold 6B
🇨🇳 China China Shenhua Energy 103B
🇨🇳 China Zijin Mining 57B
🇨🇳 China Yanzhou Coal Mining 15B
🇨🇳 China Shandong Gold Mining 14B
🇨🇳 China Ganfeng Lithium 9B
🇨🇳 China Tianqi Lithium 7B
🇮🇳 India Coal India 27B
🇮🇳 India Vedanta 20B
🇮🇳 India NMDC 7B
🇮🇩 Indonesia Bayan Resources 42B
🇮🇩 Indonesia United Tractors 6B
🇯🇵 Japan Sumitomo Metal Mining 6B
🇰🇿 Kazakhstan Kazatomprom 10B
🇲🇽 Mexico Grupo México 39B
🇲🇽 Mexico Fresnillo 6B
🇵🇱 Poland KGHM 6B
🇷🇺 Russia Nornickel 18B
🇷🇺 Russia Severstal 11B
🇸🇦 Saudi Arabia Maaden 49B
🇿🇦 South Africa AngloGold Ashanti 14B
🇿🇦 South Africa Gold Fields 14B
🇿🇦 South Africa Harmony Gold 6B
🇿🇦 South Africa Impala Platinum 5B
🇸🇪 Sweden Boliden 8B
🇨🇭 Switzerland Glencore 55B
🇬🇧 UK Anglo American 37B
🇬🇧 UK Antofagasta 21B
🇬🇧 UK Endeavour Mining 5B
🇺🇸 USA Southern Copper 77B
🇺🇸 USA Freeport-McMoRan 58B
🇺🇸 USA Newmont 48B
🇺🇸 USA Royal Gold 9B
🌍 Global Total All Companies Combined 1.4T
Data sources
https://companiesmarketcap.com/mining/largest-mining-companies-by-market-cap/
Source: Credit to Elements & Companies Market Cap
Purpose: A problem-solving method used to identify the root cause of an issue by repeatedly asking "Why?" until the fundamental cause is discovered.
Steps:
1. Ask "Why?" for the problem or symptom.
2. Ask "Why?" again for each answer until the root cause is identified.
Example:
Problem: Defective products on the assembly line.
Why: Machine issues.
Why: Machine not calibrated.
Why: Calibration schedule missed.
Why: No reminder sent to maintenance.
Why: Reminder system down.
Root Cause: Reminder system failure caused missed calibration, leading to defects.
Outcome: Fix the reminder system to ensure timely calibration and prevent defects.
I have been asked many times what simulation method I use. This question is probably originated in the rivalry that the old schools had in geostatistics. In this note I discuss my views, hoping this clarifies what is important and what is irrelevant.
I would be very interested in hearing other views about this issue.
I hope you enjoy the document! You can download it below.
https://julianmortiz.com/articles
The Barrick-Mali Situation: A Lesson in Spotting Risks Early
The situation between Barrick and Mali isn’t improving.
Two weeks ago, Mali detained four senior Barrick employees, and now they've issued a warrant for the arrest of Barrick’s CEO.
This issue didn’t come out of nowhere—it’s been building for over a year. By looking at what led to this, we can learn how to spot early warning signs and manage risks better in the future.
The story really starts back in 2023, when Mali’s new government—formed after a coup—teamed up with Russia to plan a massive gold refinery.
With a capacity of 200 tonnes per year, this refinery would triple Mali’s gold output and likely process all the country’s gold, giving the government full control of its production.
Around the same time, Mali started discussing changes to its mining laws to align with this transition.
Risk consultancy firm Control Risks flagged this early.
Their 2024 risk outlook warned, “Government plans to build refining capacity in Burkina Faso and Mali could trigger a showdown with gold mining operators, which currently send their product abroad for refining.”
That warning has become reality.
While I believe this situation will eventually stabilize, it highlights how rising gold prices and tighter government finances can escalate risks for miners.
The lesson here is to keep an eye on early signs of policy shifts—they can help you avoid or prepare for situations like this.
As 2024 comes to a close, gold, silver, and copper have experienced notable price growth. Gold has had an outstanding year so far, with prices rising by more than 27%. The precious metal soared to an all-time high of $2,790 per ounce in October 2024, marking its strongest performance in decades. Investor demand surged amid geopolitical tensions, inflationary concerns, and a flight to safe-haven assets during periods of uncertainty. Gold’s enduring appeal as a store of value was reinforced as inflation and market volatility spooked investors, leading to a steady climb in its price throughout the year.
Silver also experienced substantial growth so far in 2024, gaining over 24%. Its price peaked at $34.72 per ounce on October 22, 2024, the highest level in 12 years. Silver’s rise was largely driven by booming industrial demand, particularly from the solar energy and electric vehicle sectors. As global economies accelerated their sustainability initiatives, silver became an increasingly critical material due to its key role in green technologies, such as photovoltaic cells and battery production.
Copper’s YTD growth of 5.37% reflects its steady demand, although it did not experience the same dramatic percentage increases as gold and silver. However, copper hit a record high of $5.20 per pound in May 2024, driven by its critical role in the renewable energy transition and advanced technologies. The metal is essential for clean energy infrastructure, electric vehicles, and the rapidly expanding AI industry, positioning copper as a cornerstone for future industrial development.
This graphic ranks the countries where mining exports (minerals, ores, and metals) are more than 60% of their total exports. Data is from sourced from UN Trade and Development, based on 2019–2021 averaged figures
This sort of resource dependency can make a country vulnerable to economic shocks via price fluctuations.
Diamonds, Gold, and Copper: Key Exports for Many Countries
Around 90% of Botswana’s exports are concentrated in mining, making it the most mineral resource dependent country in the world. Within the sector, diamonds alone account for 80% of all exports.
As a result, Botswana is the top producer of raw, uncut diamonds in the world. The IMF estimates that 25% of the country’s $20 billion GDP is from diamond mining.
Rank Country % of Exports
from Mining Top Mineral/Metal
Export (2022)
1 🇧🇼 Botswana 92% 💎 Diamonds
2 🇬🇳 Guinea 87% 🏅 Gold
3 🇲🇱 Mali 85% 🏅 Gold
4 🇧🇫 Burkina Faso 84% 🏅 Gold
5 🇸🇷 Suriname 83% 🏅 Gold
6 🇿🇲 Zambia 79% 🪨 Copper
7 🇨🇩 DRC 77% 🪨 Copper
8 🇲🇷 Mauritania 66% 🏅 Gold
9 🇬🇾 Guyana 64% 🏅 Gold
10 🇰🇬 Kyrgyzstan 62% 🏅 Gold
11 🇳🇦 Namibia 61% 💎 Diamonds
12 🇵🇪 Peru 61% 🪨 Copper
Figures rounded. The top mining export per country sourced from The Observatory of Economic Complexity.
Meanwhile, in Mali (#3), Burkina Faso (#4), and Suriname (#5) gold is responsible for most of the mining export dependency. However, Guinea (#2) also exports a significant amount of aluminum ore as well.
In Zambia (#6) and the DRC (#7) where more than 70% of their exports are from mining, copper plays a crucial role. However Zambia also exports a significant amount of gold, and the DRC is a major cobalt exporter.
Of the top 10 countries whose exports are predominantly mining-based, seven are from Africa.
It’s also apparent that this kind of commodity dependence is more common in developing economies (wealthy oil nations are exceptions to the rule). And as commodity demand tends to run in boom-bust cycles, it leaves these less-wealthy countries particularly susceptible to price shocks.
By Pallavi Rao
Graphics/Design: Sam Parker
The Revenue Factor (RF) is a fundamental parameter in open-pit mining, crucial for defining the economic pit limits under variable commodity price scenarios. It provides a systematic approach to evaluating the interplay between price fluctuations and the economic feasibility of extracting ore, enabling precise optimization of pit geometry, cutoff grades, and resource recovery strategies.
Formula:
Revenue Factor (RF) = Simulated Commodity Price / Assumed Market Price of Commodity
Applications in Pit Optimization:
RF = 1: Represents the base-case scenario, defining the economic pit limit based on assumed market prices.
RF > 1: Simulates elevated commodity prices, expanding the pit shell as lower-grade ore becomes economically mineable.
RF < 1: Reflects reduced commodity prices, contracting the pit shell since only higher-grade ore sustains profitability.
Technical Insights:
RF is integral in cutoff grade optimization and economic pit shell generation.
It facilitates the delineation of economically recoverable resources, balancing grade-tonnage relationships under varying market conditions.
RF-driven scenarios support sensitivity analysis, providing a robust framework to evaluate project resilience against price volatility.
By incorporating RF into pit design workflows, mining engineers can achieve optimized resource recovery, enhance project economics, and adapt to dynamic market trends.
Sustaining capital is essential for maintaining and enhancing production levels in mining operations over the life of the project. Unlike routine operating costs (labor, consumables, maintenance, and third-party services), sustaining capital is specifically focused on the necessary investments required to extend the useful life of mining assets and ensure continuous operations.
Why Sustaining Capital is Important in Mining Projects:
1. Maintaining Production: Sustaining capital is vital to maintaining operations at the planned level, ensuring that key assets (mining fleet, equipment, processing facilities) are maintained or replaced as required.
2. Long-Term Viability: It supports the extended life of the mine, ensuring continued resource extraction through investments in mine development, infrastructure, and safety systems.
3. Risk Mitigation: By allocating funds for unexpected equipment failures, infrastructure upgrades, and environmental management, sustaining capital helps mitigate operational risks.
4. Economic Stability: Accurate sustaining capital estimates contribute to financial planning, ensuring that cash flow is managed efficiently throughout the mine's life cycle.
Key Technical Parameters in Sustaining Capital:
Mine Development: Includes open-pit pre-stripping, underground haulage drifts, and ventilation raises to prepare and maintain access to reserves.
Push-Back Waste Stripping: Extending mine life by removing waste material to access ore.
Equipment Rebuilds: Costs related to overhauling mining fleets and plant equipment to extend their operational life.
Equipment Replacement or Expansion: Replacement of obsolete equipment and expansion of mining fleets based on the Life-of-Mine (LOM) plan
Process Facility Replacements: Ensuring the continuous functionality of processing plants through replacement or upgrades.
Expansion of TSF: Ensuring adequate capacity for increasing tailings production as the mine progresses
Progressive Rehabilitation & Ongoing Closure Costs: Long-term planning for environmental reclamation and mine closure, ensuring sustainable environmental practices.
Infrastructure Facility Replacements: Replacing critical infrastructure (e.g., power, water, transportation) to support ongoing mining operations.
Additional Land Purchases: Acquiring land for future expansion or to support reserves
Dewatering and Pumping: Managing water resources effectively to avoid operational disruptions.
Contingency: Allocating funds for unexpected costs or emergencies that may arise during the life of the mine
Sustaining capital ensures that a mining operation remains viable and efficient over its entire life cycle, ultimately contributing to the financial success of the project.
Note: The numerical values used in the table and graph are for illustrative purposes only.
At the end of 2023, the national company Kazatomprom's uranium reserves amounted to 567k tons.
Kazatomprom's mining operations at many uranium deposits are carried out through joint enterprises with foreign partners. Here is an infographic showing the structure of reserves distribution at the end of 2023 by companies. The data take into account recent changes in the structure of some joint ventures.
According to the data, Kazatomprom holds the leading position with a share of 53% or more than 300 thousand tons. “Rosatom" (Uranium One Inc.) accounts for 25% of the reserves. The other companies share the remaining part.
Mining companies worldwide employ millions of workers, driving not only resource extraction but also economic development in many regions. The sheer scale of employment showcases the industry's global reach and the significant role it plays in communities worldwide. Here’s a closer look at some of the largest employers in the mining sector and how they impact global labor markets.
Leading Employers in Mining
At the top of the list is Coal India, employing a staggering 248,550 people. Based in India, Coal India underscores the labor-intensive nature of coal mining, particularly in regions where mechanization remains limited. With a workforce more than twice the size of its closest competitor, it stands out as a leader in coal production and a vital source of livelihoods for hundreds of thousands of families.
Glencore, headquartered in Switzerland, employs around 150,000 workers, making it the second-largest employer among publicly traded mining firms. With operations spanning multiple continents, Glencore's workforce reflects its diversified portfolio of mining and trading activities.
Anglo American, headquartered in the United Kingdom, employs 105,000 people. Its major operations in diamonds, copper, and platinum span Africa, the Americas, and Australia, requiring a substantial workforce.
Regional and Industry Trends
Countries like China and South Africa host several major mining employers. For example, China Shenhua Energy and Yankuang Energy employ 83,029 and 64,279 workers, respectively. These companies focus on coal and energy production, crucial for fueling China’s industrial growth. Meanwhile, South Africa's Sibanye-Stillwater and Harmony Gold collectively employ over 97,000 workers, reflecting the region's focus on platinum and gold mining.
In contrast, technologically advanced mining operations in countries like the United States employ fewer workers due to higher levels of mechanization. For example, Newmont, one of the largest gold mining companies globally, employs 21,700 people, significantly fewer than coal-heavy operations in India and China.
Global Impact
Mining companies not only provide raw materials essential for industries like construction, electronics, and energy but also offer direct employment to millions and indirectly support even more jobs through supply chains and associated industries. For developing countries, mining companies often play a critical role in local economies, providing infrastructure, healthcare, and education alongside employment.
Conclusion
Mining companies employ vast workforces across the globe, with some like Coal India dominating in sheer numbers. These companies are not only critical for resource extraction but also for job creation and economic development. As the industry evolves, so will its workforce, balancing technological innovation with the continued need to support communities dependent on mining.
A book on 100 risk assessments provides examples and templates to guide hazard identification and management but should be used as a reference, not a definitive solution.
Here’s why (and how to fix it) ⬇️
Why does most change fail?
It’s not because people resist change.
It’s because leaders miss one (or more) critical ingredients:
❌ No vision?
The team doesn’t know where they’re headed - causing confusion.
❌ No skills?
People feel overwhelmed and anxious about their ability to deliver.
❌ No incentives?
Without clear motivation, resistance builds quickly.
❌ No resources?
Frustration sets in when people don’t have what they need.
❌ No action plan?
You’ll see false starts and repeated mistakes.
But when you get all these factors right, change becomes possible:
✅ A clear vision inspires the team and aligns their efforts.
✅ Building the right skills empowers people to contribute effectively.
✅ Meaningful incentives keep everyone motivated and engaged.
✅ Providing the necessary resources ensures a smooth path forward.
✅ A strong action plan keeps the team focused and on track.
Change isn’t about luck - it’s about preparation and execution.
🧠 Remember; without all five pieces,
even the best ideas will fail to stick.
What’s your biggest challenge when driving change?
Fascinating visualization showing that meeting global battery demand by 2030 would require 293 new mines split as shown below which will not be physically possible given the time needed to develop a new mine...
- Copper, used in wires and other applications, and lithium, essential for batteries, will require the greatest number of new mines.
- Manganese production would need to increase more than 4x to meet the anticipated demand.
This is not going to be feasible when we know that it takes nearly 29 years to develop a new mine in the US and 10 to 15 years in Ghana, the Democratic Republic of Congo, and Laos...
The transition objectives will de facto be delayed which means an increased temperature, and we'll have to learn to adapt anyway.
Better late than never...
Source: Credit to Benchmark Mineral Intelligence & Laurent BABIKIAN
Prominent outliers in a dataset can significantly affect the accuracy of analyses.
So, how can we detect and manage these outliers?
✅ Methods like Z-Score, IQR, and Box Plot can help tackle this issue! 🚀
In this document, I’ve compiled various techniques for outlier detection and handling.
Literature reveals various reconciliation techniques adopted by mining companies. These have been described as Depletion by Mining; Reconciliation of Resources with Grade Control; Reconciliations between Ore Reserves, Grade Control and Production; and the use of Reconciliation Factors (mine call factors). A mine with a consistent record of poor reconciliation may be battling with one or more of the following issues: Perceived Complexity of the Reconciliation Process; Shifting of Blame/Responsibilities; Poor Material Tracking; and Superfluous Parameter Alterations to meet expectations
Source: Credit to Amoako Richard, Al-Hassan Sulemana
It's Automated - JEs to the Dashboard!
I designed MAK's Simple Ledger to help small business owners simplify their accounting processes.
It all started when a small business owner client maintained multiple Excel files to track business revenue and expenses. Keeping records this way made tracking day-to-day transactions, reconciling accounts, or generating useful financial reports challenging.
The client needed a solution:
• Simple and easy to use—not overly complicated or technical
• Time-efficient—something he could update every day seamlessly
MAK's Simple Ledger is a fully automated Excel-based accounting solution designed for small businesses and bookkeepers.
Features
• Dynamic Chart of Accounts (COA) to fit your business needs.
• Simple Journal Entry Recording
• Enter your revenue, expenses, and other transactions in the JEs sheet.
• Automatic Updates Across Reports
• Powerful Reporting Tools
•Visual dashboards and trend analysis to monitor business performance.
Benefits
• Saves time with automated calculations.
• Helps keep accurate, up-to-date financial records.
• Provides insights through clear financial statements and charts.
• No need for expensive accounting software—this is built in Excel.
You can build it, too!
Here are the skills and knowledge you'll need to get started:
• Basic Accounting Knowledge
• Intermediate Excel Skills
• Step-by-step guide I created for you
You will be building these sheets:
• Chart of Accounts
• Months – Fiscal Year
• Trial Balance
• Journal Entries Sheet
• Income Statement
• Balance Sheet
• Budget
• Prior Year Actuals
• Ledger Report
• Actual vs Budget
• Dashboard
Once completed, you will enter a journal entry, and all reports will be updated automatically.
Follow the guide and give it a go!
➡️Most top companies have climate targets,yet only 12% have one for biodiversity, despite the global economy’s dependency on nature.
This report summarizes the mining sector’s key impacts and dependencies on nature and sets out priority actions that corporate leaders can take to transform their businesses. These include:
➡️Transform operations across the mine life cycle: Avoid, then reduce, the land, pollution and emissions impacts of mining operations and
restore across the mine life cycle in accordance with the mitigation hierarchy.
➡️Improve water stewardship: Avoid, then reduce, water abstraction, use and pollution in mining operations, and improve water stewardship across landscapes.
➡️Expand circularity and source responsibly:
Expand circularity across the value chain, embrace standards and transparency, engage with suppliers and source responsibly, and collaborate with and support customers.
➡️Restore and regenerate landscapes: Support nature conservation and restoration with local communities across and beyond their own
value chains and invest in innovative nature
financing mechanisms.
➡️Transform policy systems and collaborate across sectors: Call on governments to strengthen nature-related policy and support cross-sector and cross-industry collaboration.
These priority actions could unlock more than $430 billion in annual business opportunities by 2030 for companies operating across the sector’s value chain, presenting a significant opportunity for the mining and metals sector in the new nature-
positive economy.
Insight Report
January 2025
(Word Economic Forum)
Source: Credit to Word Economic Forum / and Adele Rouleau
𝗟𝗔 𝗩𝗜𝗗𝗔 𝗡𝗢 𝗦𝗘 𝗡𝗘𝗚𝗢𝗖𝗜𝗔: 𝗟𝗮𝘀 𝗥𝗲𝗴𝗹𝗮𝘀 𝗤𝘂𝗲 𝗦𝗮𝗹𝘃𝗮𝗻 𝗩𝗶𝗱𝗮𝘀"
⛑️ 𝗘𝗻 𝗺𝗶𝗻𝗲𝗿í𝗮 𝘆 𝗲𝗻 𝗰𝘂𝗮𝗹𝗾𝘂𝗶𝗲𝗿 𝗶𝗻𝗱𝘂𝘀𝘁𝗿𝗶𝗮 𝗱𝗲 𝗮𝗹𝘁𝗼 𝗿𝗶𝗲𝘀𝗴𝗼, 𝗵𝗮𝘆 𝗮𝗹𝗴𝗼 𝗺á𝘀 𝘃𝗮𝗹𝗶𝗼𝘀𝗼 𝗾𝘂𝗲 𝗰𝘂𝗮𝗹𝗾𝘂𝗶𝗲𝗿 𝗿𝗲𝘀𝘂𝗹𝘁𝗮𝗱𝗼: 𝗟𝗔 𝗩𝗜𝗗𝗔 𝗛𝗨𝗠𝗔𝗡𝗔.
🚨 ¿𝙎𝙖𝙗í𝙖𝙨 𝙦𝙪𝙚 𝙡𝙖 𝙢𝙖𝙮𝙤𝙧í𝙖 𝙙𝙚 𝙡𝙤𝙨 𝙖𝙘𝙘𝙞𝙙𝙚𝙣𝙩𝙚𝙨 𝙛𝙖𝙩𝙖𝙡𝙚𝙨 𝙤𝙘𝙪𝙧𝙧𝙚𝙣 𝙥𝙤𝙧 𝙣𝙤 𝙘𝙪𝙢𝙥𝙡𝙞𝙧 𝙘𝙤𝙣 𝙡𝙖𝙨 𝙣𝙤𝙧𝙢𝙖𝙨 𝙗á𝙨𝙞𝙘𝙖𝙨 𝙙𝙚 𝙨𝙚𝙜𝙪𝙧𝙞𝙙𝙖𝙙?
🔑 Las 𝗥𝗲𝗴𝗹𝗮𝘀 𝗾𝘂𝗲 𝗦𝗮𝗹𝘃𝗮𝗻 𝗩𝗶𝗱𝗮𝘀 no son opcionales. Son una necesidad 𝗶𝗺𝗽𝗲𝗿𝗱𝗼𝗻𝗮𝗯𝗹𝗲 en empresas de clase mundial como 𝗖𝗼𝗱𝗲𝗹𝗰𝗼 y otros líderes globales. Estas reglas representan 𝗰𝗼𝗺𝗽𝗿𝗼𝗺𝗶𝘀𝗼𝘀 𝗰𝗿í𝘁𝗶𝗰𝗼𝘀 que controlan los mayores riesgos y 𝙥𝙧𝙚𝙫𝙞𝙚𝙣𝙚𝙣 𝙩𝙧𝙖𝙜𝙚𝙙𝙞𝙖𝙨 en operaciones diarias.
💡 ¿𝙌𝙪é 𝙨𝙞𝙜𝙣𝙞𝙛𝙞𝙘𝙖𝙣 𝙚𝙨𝙩𝙖𝙨 𝙧𝙚𝙜𝙡𝙖𝙨?
1️⃣ Nunca intervengas equipos energizados sin bloqueo y verificación de "Energía Cero".
2️⃣ Usa siempre tu sistema de detención de caídas en trabajos en altura.
3️⃣ Mide los gases antes de ingresar a un espacio confinado.
4️⃣ Conduce equipos solo si estás capacitado y descansado.
5️⃣ Respeta la segregación en maniobras de izaje y cargas suspendidas.
🛑𝙉𝙊 𝙏𝙍𝘼𝙉𝙎𝘼𝘽𝙇𝙀𝙎. 𝙉𝙊 𝙉𝙀𝙂𝙊𝘾𝙄𝘼𝘽𝙇𝙀𝙎. 𝙎𝙄𝙉 𝙊𝙋𝘾𝙄𝙊𝙉𝘼𝙇𝙀𝙎.
Estas reglas son el límite entre 𝗹𝗮 𝘀𝗲𝗴𝘂𝗿𝗶𝗱𝗮𝗱 𝘆 𝗹𝗮 𝘁𝗿𝗮𝗴𝗲𝗱𝗶𝗮. Empresas de clase mundial han comprobado que implementarlas con liderazgo activo, control riguroso y cultura de seguridad salva vidas todos los días .
🔒 𝘾𝙪𝙢𝙥𝙡𝙞𝙧 𝙘𝙤𝙣 𝙚𝙨𝙩𝙖𝙨 𝙧𝙚𝙜𝙡𝙖𝙨 𝙣𝙤 𝙨𝙤𝙡𝙤 𝙥𝙧𝙤𝙩𝙚𝙜𝙚 𝙖 𝙡𝙤𝙨 𝙩𝙧𝙖𝙗𝙖𝙟𝙖𝙙𝙤𝙧𝙚𝙨, 𝙨𝙞𝙣𝙤 𝙦𝙪𝙚 𝙞𝙢𝙥𝙪𝙡𝙨𝙖 𝙪𝙣𝙖 𝙞𝙣𝙙𝙪𝙨𝙩𝙧𝙞𝙖 𝙢á𝙨 𝙝𝙪𝙢𝙖𝙣𝙖, 𝙨𝙚𝙜𝙪𝙧𝙖 𝙮 𝙚𝙛𝙞𝙘𝙞𝙚𝙣𝙩𝙚.
⚠️ 𝙍𝙚𝙘𝙪𝙚𝙧𝙙𝙖 𝙨𝙞𝙚𝙢𝙥𝙧𝙚: 𝙀𝙡 𝙢𝙚𝙟𝙤𝙧 𝙧𝙚𝙨𝙪𝙡𝙩𝙖𝙙𝙤 𝙚𝙨 𝙦𝙪𝙚 𝙏𝙊𝘿𝙊𝙎 𝙫𝙤𝙡𝙫𝙖𝙢𝙤𝙨 𝙖 𝙘𝙖𝙨𝙖 𝙨𝙖𝙣𝙤𝙨 𝙮 𝙨𝙖𝙡𝙫𝙤𝙨.
Oryx Global Partners latest report, The Need for Critical Minerals Supply Chain Diversification, highlights a pressing challenge in today’s global energy transition: the over reliance on concentrated supply chains for critical minerals. China dominates processing and refining 90% of rare earths, over 50% of nickel, lithium, and cobalt, and is forecast to produce 95% of battery grade graphite by 2030.
Meanwhile, Indonesia now accounts for 62% of global nickel supply, and the DRC contributes 66% of cobalt. These concentrations create vulnerabilities to geopolitical tensions, natural disasters, and trade conflicts.
The report highlights the risks of this imbalance. China’s export controls, such as its recent hashtag#antimony restrictions, have driven price spikes of up to 200%, showcasing how minerals can be weaponised. Western nations are responding through policies like the U.S. Inflation Reduction Act and EU Critical Raw Materials Act, aiming to reshuffle supply chains and reduce dependence.
Source: https://wp-orynx-2024.s3.eu-west-2.amazonaws.com/media/2025/01/2025.01-Oryx-Insights-Critical-Minerals-Supply-Diversification_vf.pdf
In the world of maintenance, two key metrics often take center stage: MTTR (Mean Time to Repair) and MTBS (Mean Time Between Stoppages).
🔧 MTTR reflects how quickly we can respond and restore operations after a failure. Speed is critical—every minute counts when minimizing downtime.
🏗️ MTBS, on the other hand, highlights the quality of our work and processes. It's a measure of how long a system operates without interruption—a testament to reliability.
Together, these metrics form the backbone of equipment availability. Striking the right balance between repair speed and system reliability is key to ensuring consistent performance and minimizing costs.
📊 For example, improving MTTR means:
Streamlining repair processes.
Ensuring spare parts and tools are readily available.
Methodology to reduce MTTR: Eliminating the 8 Waste.
Meanwhile, increasing MTBS requires:
Proactive maintenance strategies.
Identifying and addressing root causes of failures.
Methodologies to improve MTBS:
DE: Defect Elimination
RCM: Reliability Centered Maintenance
RCA: Root Cause Analysis
RBD: Reliability Block diagram
FMEA: Failure Mode and Effect Analysis
La guía Nº3, “Manejo de Explosivos”, incluye las medidas generales de seguridad en el manejo de explosivos y accesorios para faenas de pequeña minería. Lo señalado en esta guía se refiere desde el manejo que se hace con los explosivos, hasta su disposición en el área en que serán ocupados. El uso y manejo posterior se incluye en la guía correspondiente a “Perforación y Tronadura”.
La ley clasifica a los pequeños mineros como “consumidores habituales de explosivos”, exigiéndoles por tal condición diversos requisitos relacionados con el manejo de éstos, incluyendo su transporte, almacenamiento y manipulación. Cabe señalar que la ley también faculta a las asociaciones mineras y sindicatos de pirquineros con personalidad jurídica, a inscribirse como consumidores habituales de explosivos, para los efectos de tener y administrar polvorines comunes para sus asociados.
Source: Omar Raul Párraga Rodriguez
In December 2024 I had a pleasure to participate in an outstanding event organized by the Soil Mechanics and Foundations Division of The Canadian Geotechnical Society / La Société canadienne de géotechnique and share the stage with some of the leading experts in the field.
I presented on the topic of "Probabilistic Analysis and Reliability-Based Design in Geotechnical Engineering."
I thought it might be helpful to share my presentation here with the geotechnical community. If you have any questions or feedback, please feel free to send me a direct message or leave a comment on this post.
Regularly reviewing and analyzing these KPIs will help you maintain effective and efficient maintenance operations, ultimately leading to improved equipment performance and reduced costs.
1. Reduce Breakdowns: Decrease the number of equipment failures.
2. Zero Failure Machine: Ensure that key machines operate without any failures.
3. Abnormality Correction: Address and fix abnormalities immediately.
4. MTBF (Mean Time Between Failures): Work to increase the time between equipment failures.
5. MTTR (Mean Time to Repair): Shorten the time required to repair broken equipment.
6. MTTF (Mean Time to Failure): Aim to lengthen the average duration a part lasts before failure.
7. Failure Rate: Lower the frequency at which equipment fails.
8. Reliability: Improve the chances that equipment will function correctly without malfunctioning.
9. Minimum Spares: Maintain only the necessary spare parts to prevent operational downtime.
10. PM Schedule (Preventive Maintenance): Adhere to a regular maintenance schedule to avert problems.
11. TBM (Time-Based Maintenance): Carry out maintenance based on a fixed time interval rather than only when issues arise.
12. CBM (Condition-Based Maintenance): Perform maintenance according to the actual condition of the equipment.
13. MP Sheet / Know-why / Know-How: Utilize MP Sheets and document the reasons and procedures for maintenance.
14. Reduce Maintenance Cost: Lower the costs associated with maintaining equipment.
15. Reduce Energy Cost: Decrease the energy expenses involved in running equipment.
16. Kaizen / OPLs (One Point Lessons): Apply continuous, incremental improvements through Kaizen and OPLs.
Silver, copper and tin to battle it out for the honours this year
70 pages of annotated charts and tables that should make for light but informative reading
Source: Credit to Natalie Scott-Gray and Rhona O’Connell, StoneX
1️⃣Down-The-Hole (DTH) Drilling:💥
DTH drilling is like precision power! With this method, a hammer is located behind the drill bit, ensuring direct impact and efficient penetration through rock formations. Perfect for hard rock and deep drilling projects, DTH brings unparalleled accuracy and depth.
2️⃣Rotary Drilling:🌀
In the world of versatility, rotary drilling takes the spotlight. This technique involves a rotating drill bit that grinds away at formations. Ideal for soft or hard ground and sedimentary rocks, rotary drilling is a go-to for mining, construction and oil exploration, offering excellent sample retrieval.
3️⃣Top Hammer Drilling🚀
For rapid-fire drilling, top hammer takes the lead! Operating from the surface, the hammer strikes through the drill string to the drill bit, making it a champion for speed and shallow drilling. Top hammer is widely used in mining and quarrying, delivering quick results without compromising on accuracy. Hole size is a restriction with Top Hammer.
The choice of drilling method depends on geological conditions, project objectives, and desired outcomes. Each technique brings its unique strengths to the table, ensuring success in various industries.
The toolkit aims to provide information for supervisor to communicate one topic a day to workers.
Pictures are for illustration purposes only.
=> Green box or a green tick shows the correct practice
=> Red box or a red cross shows the wrong practice
Source: HSE Professionals
Source: Credit to the Workplace Safety and Health Council in Collaboration with the Ministry of Manpower
Depreciation, a visual guide:
Depreciation is key in accounting.
It shows how a fixed asset's value drops over time.
This drop is due to wear, tear, and obsolescence.
It's crucial for businesses with assets like machinery, buildings, vehicles, and equipment.
In the cash flow statement, depreciation appears in the operating activities section.
It's added back to net income as a non-cash expense.
This step reduces taxable income without affecting actual cash flow.
Businesses depreciate assets like machinery, buildings, vehicles, and computers.
These items have limited useful lives.
Depreciation spreads their cost over these periods.
Several ratios help measure depreciation and its impact:
1. 𝗗𝗲𝗽𝗿𝗲𝗰𝗶𝗮𝘁𝗶𝗼𝗻 𝘁𝗼 𝗦𝗮𝗹𝗲𝘀 𝗥𝗮𝘁𝗶𝗼: Measures the proportion of sales used to cover depreciation.
2. 𝗗𝗲𝗽𝗿𝗲𝗰𝗶𝗮𝘁𝗶𝗼𝗻 𝘁𝗼 𝗙𝗶𝘅𝗲𝗱 𝗔𝘀𝘀𝗲𝘁𝘀 𝗥𝗮𝘁𝗶𝗼: Assesses the extent of depreciation relative to total fixed assets.
3. 𝗗𝗲𝗽𝗿𝗲𝗰𝗶𝗮𝘁𝗶𝗼𝗻 𝘁𝗼 𝗢𝗽𝗲𝗿𝗮𝘁𝗶𝗻𝗴 𝗜𝗻𝗰𝗼𝗺𝗲 𝗥𝗮𝘁𝗶𝗼: Evaluates the impact of depreciation on operating profitability.
4. 𝗔𝗰𝗰𝘂𝗺𝘂𝗹𝗮𝘁𝗲𝗱 𝗗𝗲𝗽𝗿𝗲𝗰𝗶𝗮𝘁𝗶𝗼𝗻 𝘁𝗼 𝗧𝗼𝘁𝗮𝗹 𝗔𝘀𝘀𝗲𝘁𝘀 𝗥𝗮𝘁𝗶𝗼: Indicates the proportion of asset value depreciated over time.
Depreciation greatly affects investments.
It lowers a company's profits, increases its taxes, and reduces asset values.
Knowing how a company handles depreciation reveals its financial and operational health.
https://einvestingforbeginners.kit.com/99e2f936ff
Source: Credit to Dave Ahern, Investing for Beginners
Excited to Share: The Complete Data Terms Dictionary!
After dedicated effort and passion for making complex concepts accessible, I've created a comprehensive guide that makes complex data terms simple to understand.
Whether you're a beginner or an expert, this dictionary is your go-to resource.
What's Inside:
• 19 Categories
• 114 Essential Terms
• Clear, Two-Line Definitions
• Zero Jargon, Pure Clarity
Covers Everything From:
📊 Basic Data Concepts
🔄 Modern Data Architecture
🛠️ Engineering & Processing
🤖 Machine Learning
🔒 Security & Privacy
...and much more!
Example:
"Data Fabric" - A unified architecture that connects all data across an organization.
Provides consistent data management regardless of location.
Hot Topics Included:
• DataOps & MLOps
• Data Mesh
• Modern Data Stack
• Data Governance
• Privacy Standards
Recent analysis of 2024 exploration trends highlights a sharp divide across battery metals:
🔹 Lithium exploration remains a standout performer, with budgets reaching a record $1.1 billion, a 30% year-over-year increase. Major contributors include Rio Tinto, Delta Lithium Limited, Ioneer Ltd. , and Azure Minerals Limited, with Canada and Australia leading global efforts. Rio Tinto notably increased its focus on Canada and Serbia, including the reactivation of its Jadar lithium project.
🔹 In contrast, Nickel exploration has taken a significant hit, falling 30% to $534 million, marking a three-year low. Budget cuts from major players like Vale and BHP have been substantial. Vale’s allocation alone dropped from $167 million to $56 million. Canada, historically dominant in nickel, saw a 52% decline.
🔹 Cobalt exploration fell to a seven year low of $52 million, a 35% decline. Leaders in this space include Cobalt Blue Holdings Ltd, which allocated $11 million to its Broken Hill Cobalt Project in New South Wales. The decline reflects continued price pressures and oversupply, particularly in key regions like Australia, the Democratic Republic of Congo, and Canada.
With Australia now the top exploration hub for battery metals, driven by unprecedented lithium investment, the outlook for nickel and cobalt remains cautious amid persistent oversupply concerns and price uncertainty.
Everyone thinks road transport is straightforward.
Load the truck.
Hit the road.
Deliver.
But those of you in logistics know better.
Behind every successful delivery is a list of risks you deal with daily.
Some are predictable. Others? Not so much.
Here’s what we’re up against on every mile of the journey:
• Vandalism
• Overloading
• Driver Fatigue
• Cargo Spoilage
• Road Conditions
• Legal Liabilities
• Traffic Accidents
• Improper Loading
• Traffic Congestion
• Wildlife Collisions
• Weather Conditions
• Theft and Hijacking
• Mechanical Failures
• Political or Civil Unrest
• Fuel Price Fluctuations
• Environmental Hazards
• Regulatory Compliance
• Communication Failures
• Insurance Coverage Gaps
• Delays Due to Border Crossings
My competencies matrix was so well received 6 weeks ago
That I’m re-sharing it
It’s helped me time and again for:
✅ Reviewing skills I need for promotion
✅ Checking hard vs soft capabilities
✅ Performance managing a team
✅ Resourcing & recruitment
✅ Organisational design
✅ Tailored coaching
✅ Training
Since publishing the matrix, many people contacted me to say how it highlighted the inadequacy of their training:
- often little more than a negotiation course
- and CIPS that they did years ago
This is not good enough!
Training needs to be:
↳ Matched to role type and seniority
↳ Based on competencies
↳ Properly funded
↳ Ongoing
Be firm with your employer to facilitate proper training
⬇️ Do you use a similar sort of matrix?
Accurate and stable control points are the backbone of underground mining operations. Here’s a comprehensive guide to setting up a reliable traverse network:
🔍 Steps to Follow
1️⃣ Determine the Number of Points:
Typically, 4 to 8 main points are required, depending on the size and complexity of the site.
2️⃣ Preliminary Planning:
Select points in stable and secure locations to ensure long-term usability.
Maintain an optimal angle between points (60°-120°) for network stability.
Plan for visibility and accessibility to all points.
3️⃣ Assigning Coordinates Using GPS:
Use precise GPS systems (e.g., RTK) to assign coordinates to reference points.
Ensure optimal satellite signal for accuracy, especially in open areas.
4️⃣ Network Closure with Total Station:
Use a total station to measure and close the traverse network.
Leverage applications like Sets of Angles to refine angles and distances.
Ensure closure accuracy with an error ratio of at least 1:10,000 or better.
5️⃣ Quality Check:
Verify the network’s accuracy by checking angles, distances, and closures.
Remeasure if discrepancies are detected.
6️⃣ Securing Points:
Use permanent markers like concrete columns or metal markers in stable locations.
This enhances durability and protects the points for long-term use.
7️⃣ Documentation:
Create a detailed report with coordinates, measurements, and error corrections.
Share the data with relevant teams for future underground operations.
💡 Key Recommendations:
Distances between points should range from 100m to 500m, depending on terrain.
Always measure angles and distances in both directions for accuracy.
Construct concrete pillars for reference points in critical areas.
After GPS setup, always verify and close the network using a total station.
Regularly monitor the network to ensure its accuracy. Mining operations or ground displacement may affect the stability of the network, requiring adjustments or updates.
By following these steps and recommendations, you’ll create a robust and reliable network that serves as the foundation for underground mining operations. 🛠️
Most people assume uranium is hard to find. It powers nuclear plants, so it must be scarce, right?
Here’s the twist – uranium is more abundant than gold and silver.
In fact, it’s as common as tin in the earth’s crust.
So why the misconception?
Cost. Risk. And the nuclear industry’s exclusivity.
But here’s the kicker – uranium reserves jumped 25% in the last decade.
New deposits keep popping up. Exploration tech is getting better.
The world isn’t running out of uranium anytime soon.
And with nuclear energy making a comeback, that’s good news.
Source: DBS
Source: Credit to Giacomo Prandelli and CityGlobeTour
Despite efforts by European countries to reduce their reliance on China for critical materials, the region remains heavily dependent on Chinese resources.
This graphic shows the percentage of EU raw material supply sourced from China for 12 raw materials used in various industries. Bloomberg published this data in May 2024 based on European Commission research.
=> China’s Dominance in Clean Energy Minerals
Europe is 100% dependent on China for heavy rare earth elements used in technologies such as hybrid cars, fiber optics, and nuclear power.
Additionally, 97% of the magnesium consumed in Europe, for uses ranging from aerospace alloys to automotive parts, comes from the Asian country.
Raw Material Percentage Supplied by China Usage
Heavy rare earth elements 100% nuclear reactors, TV screens, fiber optics
Magnesium 97% Aerospace alloys, automotive parts
Light rare earth elements 85% Catalysts, aircraft engines, magnets
Lithium 79% Batteries, pharmaceuticals, ceramics
Gallium 71% Semiconductors, LEDs, solar panels
Scandium 67% Aerospace components, power generation, sports equipment
Bismuth 65% Pharmaceuticals, cosmetics, low-melting alloys
Vanadium 62% Steel alloys, aerospace, tools
Baryte 45% Oil and gas drilling, paints, plastics
Germanium 45% Fiber optics, infrared optics, electronics
Natural graphite 40% Batteries, lubricants, refractory materials
Tungsten 32% Cutting tools, electronics, heavy metal alloys
Almost 80% of the lithium in electric vehicles and electronics batteries comes from China.
=> Assessing the Risks
The EU faces a pressing concern over access to essential materials, given the apprehension that China could “weaponize” its dominance of the sector.
One proposed solution is the EU’s Critical Raw Materials Act, which entered into force in May 2024.
The act envisions a quota of 10% of all critical raw materials consumed in the EU to be produced within the EU.
Additionally, it calls for a significant increase in recycling efforts, totaling up to 25% of annual consumption in the EU. Lastly, it sets the target of reducing dependency for any critical raw material on a single non-EU country to less than 65% by 2030.
Source: Credit to Bruno Venditti, Visual Capitalist
Surface Mining: Haul Truck Payload Basics for some reason confuse many in mining! Why? No one knows, it always has and always will!
Solution: Study and understand the technical aspects involved, slowly and surely, then it’s a breeze.
As we enter 2025, the global mining and commodity landscape continues to play a critical role in shaping industries and economies worldwide. Here are some key takeaways from the latest Commodity
Overview 2024 / 2025:
🔑 Critical Minerals: The building blocks of modern technology—from electric vehicles to renewable energy systems—rely heavily on lithium, copper, rare earth elements, and cobalt. Countries like Chile, Australia, and China are at the forefront of these resources.
💡 Gold’s Enduring Power: With central banks purchasing gold at record rates, the metal remains a hedge against economic volatility, inflation, and currency instability.
🔋 Copper and Batteries: The energy transition demands more copper than ever, powering advancements in EVs, solar panels, and wind turbines. Meanwhile, China’s dominance in battery manufacturing underscores the strategic importance of vertical integration.
🌱 Sustainability in Focus: ESG considerations are reshaping coal and other commodities' market dynamics, driving a push for cleaner, sustainable alternatives.
✨ Fascinating Facts:
Iron Ore: The backbone of steelmaking, essential for infrastructure and development.
Diamonds: Beyond their allure, diamonds are indispensable in industrial applications for cutting and grinding.
Uranium: One ton of uranium can produce energy equivalent to 16,000 tons of coal.
Commodities underpin our daily lives, from the smartphones in our hands to the electricity powering our homes. As global demand evolves, staying informed about these shifts is crucial for industries and policymakers alike.
Share of Chinese companies in the uranium production in Kazakhstan increased to 9%
In Kazakhstan, uranium mining is concentrated among several large companies. Kazatomprom, the national company, leads the market with a 54% share, representing more than half of the total production.
How will the recent acquisition of a stake in a Russian company by Chinese investors impact the distribution of uranium production?
Although the change in ownership structure is recent, we can visualize the current distribution of production among companies based on data for the first half of 2024. Thus, the share of Rosatom (Uranium One) is 22%, while the share of Chinese companies increased to 9%.
It is important to note that Rosatom is concentrating on assets with substantial uranium reserves, such as the large Budenovskoye deposit. The expectstion is that the company's strategy focuses on prioritizing highly productive deposits, which may have resulted in the sale of assets with lower production dynamics.
Source: Credit to Dr. Abzal Narymbetov, CEO at ENERGY ANALYTICS
Read the business news, or take part in a business conversation, and you'll come across lots of expressions and idioms that make the subject more vivid and descriptive.
Expressions like "flood the market" or "a big cheese" give us strong mental images. But it can be difficult to understand the precise meaning of some other expressions - especially if English isn't your first language. For example, phrasal verbs (such as "drag on", "pick up" or "lay off") don't have clues that help with understanding.
Eight of the 10 deepest mines reside in a particular region of South Africa, while the reimaining two - Kidd Creek and Creighton - are located in Canada
The junior mining industry is a high-risk, high-reward arena.
A practical way to navigate it is by categorizing companies by market capitalization to understand their development stage, potential, and risks.
𝟭. 𝗙𝗿𝗼𝗻𝘁𝗶𝗲𝗿 𝗝𝘂𝗻𝗶𝗼𝗿𝘀 ($𝟭𝗕–$𝟮𝗕)
Advanced projects near production or significant discoveries. Look for proven reserves, feasibility studies, and potential for acquisitions.
𝟮. 𝗔𝗰𝗰𝗼𝗺𝗽𝗹𝗶𝘀𝗵𝗲𝗱 𝗝𝘂𝗻𝗶𝗼𝗿𝘀 ($𝟱𝟬𝟬𝗠–$𝟭𝗕)
Late-stage development or high-grade deposits. Key questions: Can management handle the transition to production, and is funding non-dilutive?
𝟯. 𝗦𝘂𝗰𝗰𝗲𝘀𝘀𝗳𝘂𝗹 𝗝𝘂𝗻𝗶𝗼𝗿𝘀 ($𝟮𝟱𝟬𝗠–$𝟱𝟬𝟬𝗠)
Advanced exploration projects expanding known deposits. Evaluate management's ability to align exploration goals with shareholder value.
𝟰. 𝗘𝘅𝗽𝗮𝗻𝗱𝗶𝗻𝗴 𝗝𝘂𝗻𝗶𝗼𝗿𝘀 ($𝟭𝟬𝟬𝗠–$𝟮𝟱𝟬𝗠)
Scaling up exploration with promising discoveries but funding challenges. Check for strong technical teams and minimal shareholder dilution.
𝟱. 𝗣𝗿𝗼𝗺𝗶𝘀𝗶𝗻𝗴 𝗘𝘅𝗽𝗹𝗼𝗿𝗲𝗿𝘀 ($𝟱𝟬𝗠–$𝟭𝟬𝟬𝗠)
Early-stage resource definition with high-grade results. Focus on drilling prioritization and management’s track record.
𝟲. 𝗖𝗮𝘁𝗮𝗹𝘆𝘀𝘁 𝗝𝘂𝗻𝗶𝗼𝗿𝘀 ($𝟮𝟬𝗠–$𝟱𝟬𝗠)
Speculative plays relying on upcoming drill results or partnerships. Ensure they have enough cash to execute plans.
𝟳. 𝗘𝗮𝗿𝗹𝘆-𝗦𝘁𝗮𝗴𝗲 𝗝𝘂𝗻𝗶𝗼𝗿𝘀 ($𝟭𝟬𝗠–$𝟮𝟬𝗠)
Grassroots explorers with prospective land but no major discoveries. Assess the geological rationale and team experience.
𝟴. 𝗡𝗮𝗻𝗼 𝗘𝘅𝗽𝗹𝗼𝗿𝗲𝗿𝘀 ($𝟯𝗠–$𝟭𝟬𝗠)
High-risk plays with minimal funding. Look for land near significant discoveries and cash to sustain operations.
𝟵. 𝗠𝗶𝗰𝗿𝗼 𝗝𝘂𝗻𝗶𝗼𝗿𝘀 ($𝟭𝗠–$𝟯𝗠)
Struggling to stay viable with speculative projects. Watch for hidden assets or potential partnerships.
𝟭𝟬. 𝗕𝗮𝗿𝗲-𝗕𝗼𝗻𝗲𝘀 𝗝𝘂𝗻𝗶𝗼𝗿𝘀 ($𝟬–$𝟭𝗠)
Mostly inactive shells. Investigate whether they hold hidden value or pivot potential.
𝗡𝗮𝘃𝗶𝗴𝗮𝘁𝗶𝗻𝗴 𝘁𝗵𝗲 𝗦𝗲𝗰𝘁𝗼𝗿
Building a diversified portfolio across categories can mitigate risks and capitalize on exploration successes. Always prioritize management expertise, funding sufficiency, and project potential.
Source: GoldDiscovery
Because you can measure the maturity of your Procurement team...
By how many KPIs you track beyond the traditional ones.
This infographic shows 12 value reporting metrics
(most teams report just the first 4 max)
✅ #1 - OPEX SAVINGS
❓ What: measures cost reduction achieved in the operational expenses of a business
🔢 Calculation: (Original Price - Negotiated Price) x Quantity purchased
✅ #2 - CAPEX SAVINGS
❓ What: measures the cost reductions achieved in capital expenditure
🔢 Calculation: Original price - negotiated price.
✅ #3 - COST AVOIDANCE
❓ What: measures prevention of potential future cost increases
🔢 Calculation: Expected future costs - actual future costs
✅ #4 - CASHFLOW
❓ What: measures the timing and movement of cash to improve business liquidity
🔢 Calculation: Improved cash flow from payables = delayed payables period x average purchase per day.
✅ #5 - REVENUE
❓ What: sourcing activities that contribute to increasing the business income or top-line growth
🔢 Calculation: e.g. Cost of good sold reduction (COGS). Procurement's ability to lower COGS directly impacts profitability and revenue generation.
✅ #6 - PROCESS IMPROVEMENT
❓ What: enhancement of workflows and tools to increase efficiency & improve outcomes
🔢 Calculation: time saved (hours) x hourly rate of employee
✅ #7 - RISK MITIGATION
❓ What: identifying, assessing and addressing potential risks within the supply chain
🔢 Calculation: (Risk Mitigated through Procurement / Total Identified Risk) x 100
✅ #8 - INNOVATION
❓ What: leveraging creative strategies and advances technologies to contribute to business goals
🔢 Calculation: (Value of innovative solutions sourced by Procurement / Total Innovation-Related Spend or Revenue) x 100
✅ #9 - STRATEGIC SOURCING
❓ What: identifying, evaluating and engaging suppliers to achieve long-term value in line with business goals
🔢 Calculation: (Value of strategic sourcing initiatives / Total Procurement Spend) x 100
✅ #10 - EFFICIENCY
❓ What: optimising processes, resources and workflows to achieve the desired outcomes with minimal waste
🔢 Calculation: (total value delivered by Procurement / total procurement costs) x 100
✅ #11 - SUSTAINABILITY
❓ What: sourcing goods & services in a way that minimises negative ESG impacts
🔢 Calculation: Measured by number of activities driving ESG improvements. Also environmental reporting, e.g. carbon footprint reduction
✅ #12 - DEMAND MANAGEMENT
❓ What: forecasting, planning and controlling the demand for goods and services
🔢 Calculation: Service level (availability) improvements.
Source: Credit to Tom Mills, https://procurebites.com/
These 4 pages teach you everything you need to know
Balance Sheet:
The balance sheet consists of the following elements:
- Current assets
- Long-term assets
- Current liabilities
- Long-term liabilities
- Shareholders equity
The balance sheet is based on a simple formula:
Assets = Liabilities + Equities
A balance sheet shows you what a company owns and owes.
Income Statement:
An Income Statement shows you the revenues and expenses of a company.
It consists of the following elements:
Revenue
- COGS
= Gross Profit
- Operating Expenses
= Operating Income
- Non-Operating Income / Expenses
= Pre-Tax Income
- Income Tax
= Net Income
Cash Flow Statement:
A Cash Flow Statements shows you the cash that enters and leaves a company.
The Cash Flow Statements consists of 3 elements:
- Cash Flow from Operating Activities
- Cash Flow from Investing Activities
- Cash Flow from Financing Activities
Cash Flow from Operating Activities:
Net Income
+ Non-Cash Changes
+/- Changes in Working Capital
= Cash Flow from Operating Activities
Cash Flow from Investing Activities:
- Capital Expenditures
- Acquisitions
+ Proceeds from the Sale of Investments
= Cash Flow from Investing Activities
Cash Flow from Financing Activities:
+/- Borrowing/Repaying Debt
+/- Issuing/Repurchasing Stocks
- Dividends Paid
= Cash Flow from Financing Activities
• Behind the scenes, RTK relies on a network of GNSS satellites that transmit signals to both the base station and the mobile receiver. The base station, positioned at a stable, fixed location with visibility to satellite constellations and within radio range of the rover, continuously calculates the discrepancies between its precise coordinates and the coordinates obtained from GNSS signals. These discrepancies, or errors, include factors such as 𝘀𝗮𝘁𝗲𝗹𝗹𝗶𝘁𝗲 𝗼𝗿𝗯𝗶𝘁 𝗲𝗿𝗿𝗼𝗿𝘀, 𝗮𝘁𝗺𝗼𝘀𝗽𝗵𝗲𝗿𝗶𝗰 𝗱𝗲𝗹𝗮𝘆𝘀, 𝗮𝗻𝗱 𝗺𝘂𝗹𝘁𝗶𝗽𝗮𝘁𝗵 𝗲𝗳𝗳𝗲𝗰𝘁𝘀, which occur when signals reflect off surfaces before reaching the receiver.
• The base station sends real-time correction data to the mobile receiver, which applies these corrections to its own measurements. This process involves several key steps:
𝟭. 𝗗𝗶𝗳𝗳𝗲𝗿𝗲𝗻𝘁𝗶𝗮𝗹 𝗖𝗼𝗿𝗿𝗲𝗰𝘁𝗶𝗼𝗻𝘀 – The base station calculates the difference between the observed GNSS measurements and the true position, generating differential corrections.
𝟮. 𝗥𝗲𝗮𝗹-𝗧𝗶𝗺𝗲 𝗧𝗿𝗮𝗻𝘀𝗺𝗶𝘀𝘀𝗶𝗼𝗻 – These corrections are transmitted to the mobile receiver via radio signals, enabling immediate adjustments.
𝟯. 𝗣𝗼𝘀𝗶𝘁𝗶𝗼𝗻 𝗥𝗲𝗳𝗶𝗻𝗲𝗺𝗲𝗻𝘁 – The mobile receiver applies the corrections to refine its position estimates, resulting in highly accurate coordinates.
• To maintain optimal performance, it is crucial that the error in RTK positioning remains minimal—typically within a few centimeters. If the error exceeds this acceptable range, adjustments or recalibrations may be necessary to ensure measurement accuracy.
Also Check:
▪️"𝗥𝗧𝗞 𝗣𝗼𝘀𝗶𝘁𝗶𝗼𝗻𝗶𝗻𝗴 𝗘𝘅𝗽𝗹𝗮𝗶𝗻𝗲𝗱"
----https://lnkd.in/d9K2bxsC
▪️"𝗥𝗧𝗞 🆚 𝗣𝗣𝗞"
----https://lnkd.in/d9rWPcgK
🔻𝗦𝗵𝗮𝗿𝗲 𝘆𝗼𝘂𝗿 𝗽𝗲𝗿𝘀𝗽𝗲𝗰𝘁𝗶𝘃𝗲 👇🏾
🔻Follow 👉🏾: Gensre Engineering & Research
Video Credit 🎥: Geospatial World & SatLab
The world’s 50 biggest miners are now worth $1.35 trillion after losing a combined $126 billion over the course of 2024 as the copper rally faded and gold stocks once again underperformed bullion.
At the end of 2024, the MINING.COM TOP 50* ranking of the world’s most valuable miners had a combined market capitalization of $1.28 trillion, down $126 billion for the year after a dismal final quarter when even gold firms succumbed to overall bearish sentiment.
The total stock market valuation of the world’s biggest mining companies declined by 9% or a combined $126.2 billion over the course of 2024.
A promising Q3, when the index touched its second highest level on record, quickly turned sour and only eight constituents made gains over the final three months of the year.
The Top 50 is now trading a stomach churning $480 billion below the peak hit in the second quarter of 2022, when the entire mining complex was riding high from uranium and nickel to copper and gold.
Much of the blame for the drift lower can be laid at the door of mining’s traditional champions.
Passing parade
Mining’s traditional big 5 – BHP, Rio Tinto, Glencore, Vale and Anglo American – that trace their roots back many decades if not more than a century, were pounded down in 2024.
Together the stalwarts shed 25.3% or $119.7 billion of their value as their bread and butter commodities – copper and iron ore – went into retreat.
The rampant dollar over the final months of 2024 only compounded losses: MINING.COM’s Top 50 considers performance in US$ market capitalisation terms, not share price changes in local currency on domestic exchanges.
In the past these companies would, apart from wobbles as the Chinese supercycle became just a cycle, consistently occupy the top five slots in the ranking, supported by vast asset portfolios covering a range of commodities across many regions.
Now the big diversifieds stocks – the mining industry’s now erstwhile version of the Mag 7 – make up less than 28% of the total index, down from a height of 38% at the end of 2022.
Vale, down 44.9% for the year, a dismal outcome made worse by the 22% fall in the real last year, is the ranking’s worst performer of the year.
Vale topped $100 billion in value briefly in 2022. Now the Rio de Janeiro based giant’s market cap is down to $37.7 billion and the counter has dropped out of the top 10 position pushed out by Indonesian upstart Amman Mineral.
Anglo American is not a top 10 company anymore either but has the distinction of being the only one of the old guard which ended 2024 in positive territory, adding $5.5 billion, or 18.1% last year.
How much of that valuation is the lingering effects of BHP’s approach is debatable, but long term investors will still be carrying the shock of January 2016 when Anglo’s market cap fell below $5 billion after it came close to suffocating under a pile of debt.
With the exception of Glencore, iron ore has been the cash cow for the big 5 as China’s massive infrastructure investment sucked upwards of 80% of seaborne cargoes and prices flirted with $200 a tonne.
In 2011, iron ore came with some of the fattest margins mining had ever enjoyed. With two-thirds of pre-tax profits coming from the steelmaking raw material that year BHP recorded a $24 billion windfall, Vale reaped $23 billion, Rio racked up $15 billion and Anglo made $11 billion.
Today the steelmaking ingredient is back to double digits and a looming supply surge coupled with the prolonged construction malaise in China, offer little hope of a return to the go-go days.
Copper cop out
Copper was going to play the role of iron ore for the Top 5 going forward and in the first half of 2024 that notion began to seem plausible.
Comex copper hit an all-time intraday high of nearly $5.20 a pound or $11,500 per tonne. In one 24-hour period trading volumes scaled $100 billion (twice the Dow daily average) with the bellwether metal attracting investors well beyond mining.
Amid the frenzy, forecasts became ever more outlandish with 50% upside from the all-time high actually one of the more sober predictions. But it didn’t take long for the squeeze to be squoze and by the end of the year copper had barely eked out a gain. Turns out copper is not the new oil.
With the copper-heavy Anglo deal dead in the water, a pivot to organic growth is under way at BHP with up to $10bn being spent on Escondida alone, the world’s largest copper mine.
Rio Tinto benefits from the fact that BHP has been working its Melbourne neighbour’s 30% stake in Escondida so hard while its Resolution copper project in Arizona languishes in permitting hell.
The long-running battle to expand Oyu Tolgoi in Mongolia also seems to have reached a steady state, but Rio’s diversification bent and penchant for opportunistic investment are intact.
The company, one of only two miners with a $100 billion-plus valuation (and only just at the end of 2024) spent $6.7 billion to buy into lithium in 2024 just as its Jadar project in Serbia was thrown a lifeline. Whether the project goes into production is still in dispute, much like the prospects for lithium.
Glencore finally got a piece of Teck Resources last year, but while highly profitable at the moment, coal is not exactly the future of mining.
With geopolitics and global trade entering ever more dangerous territory, Glencore may find its trading business beginning to throw off cash. The Swiss company, which has for decades been negotiating commodity trading waters few are willing to wade into may also want to avoid the Las Bambas effect.
The prospects of an IPO for Vale’s base metals spin-off seems to be vanishing into the distance and is now scheduled “going into 2027”. Moreover, the $25 billion to $30 billion promised spending to build up the business seems lavish with copper and nickel’s medium term prospects uninspiring.
The new 5
Southern Copper, part of conglomerate Grupo Mexico, seems unlikely to be toppled from the third spot any time soon while fellow copper specialist Freeport-McMoRan edged Glencore out of the top 5.
One out of only five listed companies with a copper production target for 2024 above one million tonnes, fourth-placed Zijin’s management seems to hold to the belief that in a boom and bust industry diversity is still the key to success.
The rapidly growing company’s latest acquisition target is another billion dollar lithium miner, the $6.4 billion market cap Shenzhen-listed Zannge. The Zannge approach follows the rather controversial takeover of the giant Manono lithium project in the DRC which Australia’s AVZ Minerals claim was unlawful.
Lithium stocks made the worst performing list their own during 2024 and the ranks of the battery metal producers have thinned. Already a crowded space, and with deep-pocketed Big Oil taking an active interest, most notably the new Ma’aden and Aramco deal, lithium will be tightly contested in the years ahead. Surging demand notwithstanding.
Amman Mineral continues its run up, piercing the top 10 for the first time after gaining 24.7% in 2024, and 360% since its debut in Jakarta in early 2023. Some froth has disappeared from the copper-gold company’s valuation as losses from its peak at the end of Q2 last year now top $13 billion.
While First Quantum Minerals ended up the clear leader among the best performers as the prospects of the re-opening of Cobre Panama mine become brighter, Polish copper major KGHM leaving the Top 50 in Q4 puts a cap on a what-could-have-been year for copper stocks.
Not that shiny
The value of precious metals and royalty companies climbed by a modest $18.4 billion or 7.2% in 2024, compared to gold’s 27% run up and silver’s 22% charge.
Gold stocks’ relative weakness against the gold price is a perennial problem for the industry exemplified by the world’s top two producers Newmont and Barrick, which lost ground in 2024.
Apart from missed targets and rising production costs at both firms, Barrick is also dealing with severe problems in Mali where it is halting its Loulo-Gounkoto mine in a dispute with the West African country’s military rulers.
While Barrick moves into copper (upper guidance for 2024 is 210kt) and Newmont trims its portfolio, Agnico Eagle continues to pick up assets large and small.
On a dollar basis Agnico is the best performing stock in the Top 50, adding $12.6 billion in value in 2024 (versus $9.3 billion for Zijin and $8.8 billion for India’s Vedanta) and enters the top 10 for the first time.
Were it not for the limited tradability of stock in Russia’s Polyus, which greatly underperformed its peers on an ounce for ounce basis (the Moscow-based company’s 2024 target is 2.8moz) the sector’s standing in the ranks would also be greater.
The position and annual performance of South Africa’s Goldfields were also hurt by exaggerated moves in its stock and the South African rand on the day the snapshot was taken. The Johannesburg-based company is off to the races in the opening weeks of 2024, jumping by 14% for a $13.3 billion valuation.
Alamos Gold joined the top 50 for the first time in Q3 last year and with a more than 50% jump in value in 2024 now appears firmly ensconced in the top 50 with a valuation of $8.1 billion at the end of the quarter.
The second quarter’s newcomer Pan American Silver (following its absorption of Yamana Gold) is also likely to be a permanent fixture.
Uzbekistan is readying an IPO for Navoi Mining and Metallurgy Combinat – the world’s fourth largest gold mining company and significant uranium producer in 2025. NMMC debuted a $1 billion bond offering in September, marking the first global debt market issuance from a gold mining company since June 2023.
Navoi should easily join the ranks of gold producers in the top 50 thanks to ownership of the world’s largest gold mine, Muruntau, and annual production of 2.9 million ounces at grades and per ounce extraction costs the envy of the sector.
Bad graphs are everywhere
I encounter a lot of less‐than‐stellar visuals in my work (and in my life—once you get a discerning eye for this stuff, it’s hard to turn it off). Nobody sets out to make a bad graph. But it happens. Again and
again. At every company throughout all industries and by all types of people. It happens in the media. It happens in places where you would expect people to know better. Why is that?
Source: Abdelsalam Elshourbagy
Mining is an afterthought for investors.
But without mining, Big Tech wouldn’t exist.
It’s like watching a Michelin-starred chef get all the glory for serving a meal while the farmer growing the ingredients gets ignored.
The tech industry attracts investors with shiny apps and gadgets, while mining, the industry literally making all that innovation possible, remains an afterthought.
Having spent most of my career consulting for software and tech companies, stepping into mining was like stepping into a time warp. Don’t get me wrong, the industry is critical.
Without it, there’d be no iPhones, no EVs, and no cloud servers.
But it feels like mining is stuck in an endless cycle of outdated practices.
Numbers never lie.
At the start of 2023, the combined market value of the top 50 mining companies was $1.39 trillion.
That’s barely a third of Apple’s valuation, even after Apple shed nearly $750 billion in a single year.
Think about that for a second.
One tech company losing value still dwarfs the entire mining industry’s top players.
Investors throw cash at virtual assets while undervaluing the raw materials that make the digital economy even possible.
Mining’s problem?
It’s boring.
From where I’m sitting, the issue isn’t mining’s importance.
It’s that mining just isn’t sexy to investors.
Tech has mastered the art of storytelling.
Mining, on the other hand, markets itself like a grumpy old man yelling at clouds.
No one cares how critical copper is for electrification when all they see are trucks hauling dirt.
So we have a massive disconnect.
We’re pouring money into NFTs and social media startups while neglecting the industries needed to sustain a green future.
The market capitalization of entities like META says to us that there’s more than enough capital.
The money exists.
It’s just going into cat videos and dopamine hits instead of sustainable infrastructure.
Mining needs to start thinking like Big Tech.
It could adopt marketing practices from Silicon Valley: transparency, bold sustainability goals, and investor pitches that focus on long-term value.
Right now I work with several tech projects that aim to modernize different sides of the mining industry, from operational efficiency to capital investment.
Some progress has been made.
But let’s be honest: these changes won’t be enough if mining doesn’t fundamentally shift how it’s perceived.
Here's what you'll learn:
• Financial reporting
• Balance statements
• Income statements
• Statement of cash flows
• Statement of Retained Earnings
• Ratios
• Financial Analysis
This course explains how to read and interpret the financial statements of a business enterprise. It is not an accounting course and it is written by a non-accountant for non-accountants. The purpose of the financial statements of a company is to provide information on the profitability and economic well-being of the organization. Accounting and the corresponding financial statements are the “language of business” and allow business owners, investors, bankers, and others to understand how the business is doing.
Everyday hundreds of financial transactions take place in the normal course of business and without some mechanism to compile and organize the transactions they would just be a mindnumbing jumble of data. To bring order to this chaos, accountants developed standard reporting guidelines for business data. The guidelines allow us to summarize a large number of transactions into groupings of similar transactions.
The standard reporting format includes three primary reports: The Balance Sheet, the Income Statement, and a Statement of Cash Flows. Sometimes other reports are included such as a Statement of Retained Earnings. To insure consistency, the reports must comply with guidelines known as Generally Accepted Accounting Principles (GAAP). GAAP is a set of accounting and financial reporting standards administered by the Financial Accounting Standards Board (FASB). More information about FASB can be found at www.FASB.org.
In this course we will analyze each of the three basic financial statements in detail, as well as other statements and key indicators of the financial well-being of the company. The first section is an overview of the financial statements, followed by detailed explanations of the Balance Sheet, Income Statement, Statement of Cash Flows, and Statement of Retained Earnings.
Source: Marianne Peeters
More than 300 new mines needed to meet battery demand by 2035
Analysis from Benchmark Mineral Intelligence's raw material forecasts shows at least 384 new mines for graphite, lithium, nickel and cobalt are required to meet demand by 2035, based on average mine sizes in each industry
Taking into account recycling of raw materials, the number is around 336 mines
For lithium, the world will require 74 new lithium mines with an average size of 45,000 tonnes by 2035, or 59 if recycling rates ramp up as expected
Issues will also be faced in the midstream, with the need for aggressive expansion of lithium refinery facilities able to produce consistent, battery grade, qualified lithium chemicals being another significant hurdle
Looking to graphite, a total of an estimated 97 natural flake graphite mines will need to be built, assuming an average size of 56,000 tonnes a year, whilst a further 54 synthetic graphite plants with an average size of 57,000 tonnes will also be required
How the balance of synthetic vs natural graphite plays out in China compared to the rest of the world will also play a role, but either way a significant volume of raw materials will be required to meet anode demand from the EV industry
Source: Daisy Jennings-Gray, Benchmark Mineral Intelligence
The average mine lead time continues to trend upward, reaching 17.9 years for mines coming online in 2020–23 compared with 12.7 years for mines that started up 15 years ago.
In this update of our previous article studying the lead time of mines — the interval from discovery to production — we have included several mines that started in 2023 and backfilled information on mines that started earlier. This study includes gold, copper, nickel and lithium mines that have begun production since 2000.
All the main points that we presented in our previous study have held true in this iteration. It takes an average of approximately 16 years for a mine to go from discovery of a deposit to startup. Open-pit mines have a longer average lead time than underground mines due to the longer exploration and permitting phases. Nickel mines have the longest lead time due to a longer construction period, amplified by several mines discovered in the mid-1980s and 1990s when lower nickel prices may have caused tighter access to capital.
Our research confirms the industry belief that lead times are getting longer. The average lead time for mines from 2005 to 2009 was 12.7 years, which has grown steadily up to the present. From 2020 to 2023, the average lead time jumped to 17.9 years, fueled by a longer exploration, permitting and studies phase and a longer period between the end of feasibility studies and the start of construction, which can be attributed to time spent obtaining financing and construction permits.
An example is the Bystrinskoye copper mine in Russia, which took 32 years from its discovery in 1986 to its startup in 2018. The mine completed its feasibility study in 2011, but being a public-private partnership between PJSC Norilsk Nickel, Chinese investors and the Russian government, it encountered several delays in securing funds. The Celestial mine in the Philippines was discovered in 1993 but did not begin production until 2022. The project underwent several ownership changes over the years and was delayed by difficulties in accessing capital.
Source: https://www.spglobal.com/marketintelligence/en/news-insights/research/average-lead-time-almost-18-years-for-mines-started-in-2020-23
In 2023, Kazakhstan ranked 6th in terms of gold mined and 14th in terms of reserves in the world.
In Kazakhstan, the largest gold reserves include East Kazakhstan, Akmola and Karaganda regions.
According to Altynalmas' financial statements for 2022, the leaders in gold production in the country in this year are the following companies:
1. Kazzinc LLP - 23%
2. Solidcore (Polymetal) - 23%
3. Altynalmas - 22%
4. Kazakhmys - 10%
5. KAZ minerals - 7%.
6. Others - 15%.
Imports of Kazakh gold in 2022:
1. Kyrgyzstan - 60%
2. Russia - 39%
3. Others - Uzbekistan, Great Britain, Turkey
According to the Komges of the Republic of Kazakhstan, gold reserves in Kazakhstan are 20 thousand tons. This will be enough for 20-25 years with the production of 90 tons of gold per year.
In general, all Kazakh deposits with 1,159,687.4 kilograms of gold are estimated at $48 billion.
The world’s 50 biggest miners are now worth $1.5 trillion, up $76 billion during Q3 as gold miners climb the rankings and Chinese mining stocks get a late boost.
At the end of the third quarter of 2024, the MINING.COM TOP 50* ranking of the world’s most valuable miners had a combined market capitalization of $1.51 trillion, up just under $76 billion from end-June, largely on the back of gold and royalty stocks.
The total stock market valuation of the world’s biggest mining companies is up a fairly modest 8% year to end-September and despite the good run is still $240 billion below the peak hit in the second quarter of 2022.
=> Ranks, value of gold stocks swell
The value of precious metals and royalty companies climbed by a combined $42 billion or 16% during the quarter and gold counters dominate the best performing ranks.
Were it not for the limited tradability of stock in Russia’s Polyus, which lost some ground over the three months despite gold’s stellar performance, bullion’s effect on the Top 50 would have been even more pronounced.
Canada’s Alamos Gold joins the top 50 for the first time with a more than 31% jump in value lifting it six places to number 48 with a valuation of $8.2 billion at the end of the quarter while the second quarter’s newcomer Pan American Silver (following its absorption of Yamana Gold) hangs on at no 50.
Alamos Gold last month raised its production guidance by over 20% for 2025-2026 with the inclusion of the Magino mine and its integration with its Island Gold operation in Ontario. The Toronto based miner has long term ambitions to grow its production base to 900,000 ounces per year.
Uzbekistan is readying an IPO for Navoi Mining and Metallurgy Combinat – the world’s fourth largest gold mining company and significant uranium producer in 2025. NMMC debuted a $1 billion bond offering last week, marking the first global debt market issuance from a gold mining company since June 2023.
Navoi should easily join the ranks of gold producers in the top 50 thanks to ownership of the world’s largest gold mine, Muruntau, and annual production of 2.9 million ounces at grades and per ounce extraction costs the envy of the sector.
The Muruntau open pit mine southwest of the Kyzylkum desert, originally developed during the Soviet era as a source of uranium, has estimated reserves of around 130 million ounces of gold.
=>Goldilocks copper
Copper specialists, and those with fat gold credits, have gained a combined 36% year to date as the copper price continues to flirt with the $10,000 a tonne level but momentum slowed dramatically during Q3 with the group contributing only $7.2 billion in added market worth during the quarter.
Amman Mineral’s fierce rally also came to an abrupt halt during the quarter with the counter losing 18% over the three months and coming close to falling out of the top 10.
Investors who bought Amman, owner of the world’s third largest mine worldwide in terms of copper equivalent, at the IPO price in Jakarta a year ago, are still enjoying 400% gains since then however.
Southern Copper’s position as the world’s third most valuable mining stock seems entrenched after a double digit percentage gain in Q3 compared to a much more sedate performance by Freeport-McMoRan which now has to gain a full $20 billion in market cap to haul in its Mexico City-based rival.
=> Light on lithium
Rio Tinto’s vote of confidence in the long term future of the lithium sector (and its own ability to make M&A work) dominated the news at the start of the December-quarter but it’s worth noting that Arcadium’s more than 90% surge since the all-cash offer was first announced are not enough for the stock to enter the rankings.
Three lithium counters exited the rankings this year, Australia’s Pilbara Minerals and Mineral Resources and China’s Tianqi Lithium as the deep slump in prices for the battery metal continues to take its toll.
Last quarter’s no 50, Ganfeng Lithium jumps six places after being swept up in the stimulus-induced rally on Chinese stock markets at the end of the quarter while Tianqi’s performance so far in October should see it reenter the Top 50 in due course.
Ganfeng was barely holding on at position 50 at end-June and with gold price momentum continuing and two gold mining companies waiting in the winds – Yintai and Alamos – only three lithium counters in the top 50 may be a reality for some time to come.
After peaking in the second quarter of 2022 with a combined value of nearly $120 billion, the remaining lithium stocks’ market value has now shrunk to $34 billion.
=> Iron ore ground down
Despite a modest improvement during the quarter, the mining industry’s traditional big 5 – BHP, Rio Tinto, Glencore, Vale and Anglo American – remain in the red for 2024, losing $24 billion since the start of the year.
The big 5 diversifieds now make up 29% of the total index, down from a height of 38% at the end of 2022.
Iron ore’s less than rosy outlook – the late boost China’s recent stimulus package notwithstanding – saw Fortescue once again feature on the biggest losers list and Cleveland Cliffs exit the ranking with the US iron ore miner’s 37% decline this year exacerbated by its inability to capitalize on the blocking of the Nippon-US Steel tie up.
Iron ore’s representation in the top 50 have diminished in the last couple of years – Brazil’s CSN Mineração dropped out during Q1 this year while Anglo-controlled and separately-listed Kumba Iron Ore has lost touch with the top tier after a 40% fall year to date.
When I first heard about capping, I hadn't heard of that term before. Once it was explained to me that you choose a cap and any value above that threshold would be capped to that threshold, then it made sense. I knew of it (barely) as winsorization or as truncation (when truncating not clipping but lowering all values above to the value you choose or opposite on the lower end).
=> Why cap:
There are quite a few reasons why you would cap. If you have outliers (extreme values) which the mean is highly sensitive to, then you would want to limit its effect since you want the statistical measures to be representative of the data. Gold, especially, is skewed and in many deposits I worked in, tends to show outliers.
Sometimes data can have logical limits such as a percentage wouldn't ever go above 100% because how would you get more than itself unless you somehow created it (or didn't clean the crucible or something) or other physical limits. There are variables that you would never get below a certain value (detection limit) nor above a certain value (some assay methods stop at a certain cutoff and then you have to switchover to a different method).
In regression analysis, it can distort the model and fit. The best fit may tilt towards the outlier which misrepresents the relationship for the majority of the data. It affects p-values and R squared values (false sense of model quality) or makes a predictor variable seem more significant than it actually is. There are some regression methods that are less sensitive to outliers but that is not a topic for capping :) .
Outliers should be reviewed to see whether they are natural, errors or rare occurrences. Since with each you may want to change your plan on capping/dealing with them.
Remember though the largest reason why we want to cap in Geostatistics is to prevent overestimation!
=> How to deal with Outliers:
Note: These are not complete and only ones that I have heard of, used or been told about. Feel free to fill me in if you know of more or you know it a little differently than I do.
Grade Capping/Top Cutting: When I first heard the work top cutting to me this meant taking scissors and cutting the top off so I literally thought we were chopping off the tail of the distribution which was not true. It's where you choose a threshold (based on tests/visuals I will talk about in a minute) and then cap all the values above this to that value. So for instance if your values are 0.005, 0.010, 0.012, 0.045, 0.05, 0.06 and 20; say we choose a threshold of 0.06 that would mean it now looks like this: 0.005, 0.010, 0.012, 0.045, 0.05, 0.06, 0.06 --- see we capped the 20 down to 0.06. We didn't remove it, we just made it 0.06. This can be done before compositing, after compositing/during estimation.
High Yield: I haven't started liking this nor loving it. To me as I've stated previously, it just reminds me of building another indicator shell that limits the impact of high grade, constrains it into poddy little blocks. It removes it from being used below its threshold but then you end up with a few spots depending on what threshold you chose. I guess if you know the volume/geometry from ore control then maybe you could use it or if you know that it was intrusives and that the ore didn't bleed out or the variable didn't bleed out then yeah but I'm still on the fence with this one. Some people use rhograms to help choose/guide a threshold for this but some of the rhograms just look like what I'm used to seeing in very unbehaving IK domains when I'm trying to choose group binning. It very much reminds me of omni/group binning.
Segregation: Sometimes you may have mixed populations where maybe you have very high grade mixed in with medium to low grade. Maybe you didn't domain it properly or didn't quite understand the controls but wanted to create a model or had to create a model. If you had time you could segregate whether through using software like Leapfrog or Micromine or Vulcan or RMSP (this year I got to see Micromine and I was of the assumption it was still way in the past...absolutely not, if you haven't seen it, you need to...it blew my mind for what it can do). It's not great but you could create indicator shells which may work in a pinch or you can dive in and see if you can figure out the geologic control (which would be the preferred method...if you had time). Also, I had someone reach out to me and ask me about ROKE ( so figured I'd throw this in here) and if we had built tools for it in my previous role. Not that I remember, I didn't know what it was so I reached out to Isobel and she shared this for anyone that wants to review/read it: (Thanks Isobel)
ROKE separates component normal or lognormal populations in one mixed histogram. Read my 1974 paper! The math is in my Computers and Geosciences paper but that is just boring!! (Isobel - you are talking to a Math major lol!!!! I will look at it.)
http://www.kriging.com/publications/IMM1974.htm
http://www.kriging.com/publications/CompGeoScRoke.htm
The analysis is available in our free teaching software which you can find at kriging.com.
You are the best Isobel, thank you so much for that! I first met Isobel Clark when she came to Elko and taught us Practical Geostatistics. The best part was we had to do Variography by hand so I was placed on a team with a few other geologists and man did we have lots of laughs because I was so competitive and things were making more sense, I was helping the geos understand it. I always felt like we had to race when we had to do things by hand...it's like a game LOL! Rachel Burgess can tell you how much fun I had :) and she still remembers that day, over 15 years ago! I feel when you do things by hand, it really drives it home and you fully understand it (then later onto automation after you have done it 100+ times).
Cut: I say don't ever cut something off, dispose of it unless you have extreme evidence to do so. It's high for a reason, its data, its trying to scream at you about something. So please take extreme care here. The ONLY time I ever did this was when I was questioning in ore control if sample bags were mixed up and we had gotten undergrounds assays in our database (true story) so we wanted to krige/cut polys with and without that sample. Again...do not try this at home!
Local Capping: I haven't seen this used much, let me know if you have. It basically looks at assays around it and sees what it should be capped down to. We used it once in ore control for similar reasons as above. I wish this would have been available back when we had to use "cut", I would have much rather used this.
=> How to choose a cap?
Now for the moment you've all been waiting for. How on earth do you choose a cap?
Probability Plots: Here you are looking for breaks or changes in the slope. Some explain it as a "kink" like a slight bend. I remember people showing me by drawing lines with a ruler and where the lines meet if they didn't continuously connect but instead made a V then that is your "kink". Where this "kink" occurs could suggest a change in the distribution or indicate outliers.
Decile Analysis: This involves analyzing the contribution of high-grade samples (top deciles) to the overall mean or total metal content. By comparing different deciles, you can decide on an appropriate capping threshold to reduce the influence of extreme values. I don't like this one because I feel instead of chopping up the data into 10 groups that you need to chop up the high grade tail with more care since most of your metal content lives here. I learned about this alot with MIK.
Some other methods used for comparison are Mean + 2SD or Mean +3SD, CV analysis, correlation indicator: this one you would turn the data into binary (indicator) data and then choose a threshold distance for it to compare the pairs of values. If it turned out negative, it meant the distance was too far.
Risk Hi: This one always gave a cap that was way too low but it was interesting to run and compare to. It uses Monte Carlo simulation to run say 1000 realizations. It would then tell you that 1 in 5 years the metal won't be there but 4 out of 5 years it would using P20. I'm deep in my files trying to find the documentation that I was given by Amec/Wood. and Ed Isaaks over the years. Ed loved doing it all in JMP...he was a JMP wizard and it fascinated me that he used that because I used SAS in school, JMP is just an easier version of it/more user friendly/less scripting - a lot less!
Visual: Nothing beats this. I normally go and look at all the other methods, usually using the probability plots as a good starting point. I may check the tail of the probability plot to see if the high grade was just a hole that piped mineralization or an intrusive or something, then I will dive into a visualization software (Vulcan, Leapfrog, RMSP, etc.) to look. If samples that are going to be capped are in the same area (ponded together) then you know its real and probably a geologic reason for it, you probably don't want to cap this. If its sporadic then those could be real outliers and you would want to cap those, "one-hit-wonders" which at times Geos have told me they would sell their lives for.
Then I always like to run an estimate with and without that cap and compare. How much metal was removed by using the cap that I chose? Does it make sense. Am I too conservative? Too optimistic (I am never this)? I might even choose many caps to compare to just to see how sensitive it is in those domains.
What do you use?
(later I'll come back and add in some figures...I feel figures really drive it home but for now here are the words)
Breaking Down the Key Minerals in an EV Battery
Inside practically every electric vehicle (EV) is a lithium-ion battery that depends on several key minerals that help power it.
Some minerals make up intricate parts within the cell to ensure the flow of electrical current. Others protect it from accidental damage on the outside.
This infographic uses data from the European Federation for Transport and Environment to break down the key minerals in an EV battery. The mineral content is based on the ‘average 2020 battery’, which refers to the weighted average of battery chemistries on the market in 2020.
The Battery Minerals Mix
The cells in the average battery with a 60 kilowatt-hour (kWh) capacity—the same size that’s used in a Chevy Bolt—contained roughly 185 kilograms of minerals. This figure excludes materials in the electrolyte, binder, separator, and battery pack casing.
Mineral Cell Part Amount Contained in the Avg. 2020 Battery (kg) % of Total
Graphite Anode 52kg 28.1%
Aluminum Cathode, Casing, Current collectors 35kg 18.9%
Nickel Cathode 29kg 15.7%
Copper Current collectors 20kg 10.8%
Steel Casing 20kg 10.8%
Manganese Cathode 10kg 5.4%
Cobalt Cathode 8kg 4.3%
Lithium Cathode 6kg 3.2%
Iron Cathode 5kg 2.7%
Total N/A 185kg 100%
The cathode contains the widest variety of minerals and is arguably the most important and expensive component of the battery. The composition of the cathode is a major determinant in the performance of the battery, with each mineral offering a unique benefit.
For example, NMC batteries, which accounted for 72% of batteries used in EVs in 2020 (excluding China), have a cathode composed of nickel, manganese, and cobalt along with lithium. The higher nickel content in these batteries tends to increase their energy density or the amount of energy stored per unit of volume, increasing the driving range of the EV. Cobalt and manganese often act as stabilizers in NMC batteries, improving their safety.
Altogether, materials in the cathode account for 31.3% of the mineral weight in the average battery produced in 2020. This figure doesn’t include aluminum, which is used in nickel-cobalt-aluminum (NCA) cathode chemistries, but is also used elsewhere in the battery for casing and current collectors.
Meanwhile, graphite has been the go-to material for anodes due to its relatively low cost, abundance, and long cycle life. Since the entire anode is made up of graphite, it’s the single-largest mineral component of the battery. Other materials include steel in the casing that protects the cell from external damage, along with copper, used as the current collector for the anode.
Minerals Bonded by Chemistry
There are several types of lithium-ion batteries with different compositions of cathode minerals. Their names typically allude to their mineral breakdown.
For example:
=> NMC811 batteries cathode composition:
80% nickel
10% manganese
10% cobalt
=> NMC523 batteries cathode composition:
50% nickel
20% manganese
30% cobalt
With consumers looking for higher-range EVs that do not need frequent recharging, nickel-rich cathodes have become commonplace. In fact, nickel-based chemistries accounted for 80% of the battery capacity deployed in new plug-in EVs in 2021.
Lithium iron phosphate (LFP) batteries do not use any nickel and typically offer lower energy densities at better value. Unlike nickel-based batteries that use lithium hydroxide compounds in the cathode, LFP batteries use lithium carbonate, which is a cheaper alternative. Tesla recently joined several Chinese automakers in using LFP cathodes for standard-range cars, driving the price of lithium carbonate to record highs.
The EV battery market is still in its early hours, with plenty of growth on the horizon. Battery chemistries are constantly evolving, and as automakers come up with new models with different characteristics, it’ll be interesting to see which new cathodes come around the block.
Source: https://elements.visualcapitalist.com/the-key-minerals-in-an-ev-battery/
In Geographic Information Systems (GIS), data is primarily represented in two formats: Vector and Raster.
Understanding the differences between these two formats is crucial for choosing the right data structure for various applications.
The infographic highlights the key distinctions between vector and raster data to help guide your GIS projects, differentiating the two data types along the issues of:
➡️ File Size
➡️ Rendering
➡️ Scalability
➡️ Data Attributes
➡️ Best Use Cases
➡️ Storage Formats
➡️ Software Processing
➡️ Data Representation
➡️ Coordinate Precision
➡️ Analysis Applications
Both vector and raster data play important roles in GIS. Vector data excels in representing discrete features with high precision, while raster data is ideal for modeling continuous phenomena.
Knowing when to use each type can significantly improve your GIS analysis and decision-making.
Rio Tinto wins approval for a US$6.7billion all cash deal for Arcadium Lithium.
US$5.85 a share, the offer is a 90% premium on Arcadium Lithium's closing share priced on Oct 4th. The deal was approved by both boards and is expected to close in mid-2025.
Rio Tinto CEO - Jakob Stausholm released a statement "Acquiring Arcadium Lithium is a significant step forward in Rio Tinto's long-term strategy, creating a world-class lithium business alongside our leading aluminium and copper operations to supply materials needed for the energy transition."
1. Optimización de escenarios y planificación predictiva
=> Oportunidad: Muchas herramientas como XPAC y Whittle se destacan en el análisis de escenarios, pero la IA puede mejorar esto aún más al automatizar la exploración de escenarios de múltiples variables.
=> Aplicación de IA/ML:
Utilice algoritmos de aprendizaje de refuerzo para predecir los cronogramas de minería más rentables, considerando factores dinámicos como fluctuaciones del mercado o restricciones operativas.
Aplique análisis predictivos para pronosticar resultados operativos futuros en función de patrones históricos y datos de sensores.
2. Ajustes de programación en tiempo real
=> Desafío actual: Herramientas como Xecute y MineSched permiten la programación en tiempo real, pero carecen de capacidades avanzadas de toma de decisiones autónomas.
=> Aplicación de IA/ML:
Los sistemas de programación dinámica impulsados por IA podrían monitorear el rendimiento del equipo y los datos de producción en tiempo real y ajustar los planes automáticamente para evitar demoras.
Use modelos de aprendizaje automático para identificar cuellos de botella y optimizar los cambios de turno o las asignaciones de flotas de manera proactiva.
3. Mantenimiento predictivo y monitoreo del estado del equipo
=> Desafío actual: Muchas plataformas, como XERAS y SmartMine, no integran completamente las capacidades de mantenimiento predictivo.
=> Aplicación de IA/ML:
Implementar algoritmos de mantenimiento predictivo para anticipar fallas del equipo en función de datos operativos (por ejemplo, vibración, consumo de combustible) y reducir el tiempo de inactividad.
4. Optimización del transporte y mezcla de materiales
=> Desafío actual: HaulSim y Deswik.Blend optimizan el transporte y la mezcla, pero no utilizan la IA en todo su potencial.
Los modelos de aprendizaje automático pueden optimizar las operaciones de mezcla de forma dinámica, lo que garantiza una calidad constante del material con un desperdicio mínimo.
Usar algoritmos de IA para la optimización de rutas a fin de minimizar los costos de transporte al predecir el tráfico, el desgaste y la disponibilidad del equipo.
5. Sistemas de soporte de decisiones en tiempo real
=> Desafío actual: Si bien existe una integración operativa y financiera, muchas soluciones carecen de un soporte sofisticado para la toma de decisiones en tiempo real.
Desarrollar herramientas de apoyo a la toma de decisiones basadas en IA que sugieran estrategias óptimas basadas en datos de producción y mercado en tiempo real.
Utilizar el procesamiento del lenguaje natural (PLN) para permitir que los operadores consulten conjuntos de datos complejos mediante voz o texto, lo que mejora la accesibilidad y reduce la carga cognitiva.
6. Mejoras de usabilidad con interfaces impulsadas por IA
=> Desafío actual: La complejidad de la implementación es una barrera importante en plataformas como XPAC y MineRP.
Spatial Analysis transforms raw data into insights by uncovering patterns and relationships across locations.
This ABCs of Spatial Analysis guide provides essential terms and techniques for understanding spatial patterns, making informed decisions, and solving geographic problems.
From clustering to weighted overlays, these ABCs of Spatial Analysis give you the foundational tools to dig deeper into spatial data.
Mastering these basics unlocks the potential for advanced analysis, enabling data-driven decision-making in fields ranging from urban planning to environmental science.
Use ADKAR to make it simple ⬇️
Change is inevitable, but navigating it
successfully is where many organisations struggle.
This is where the ADKAR model comes in,
offering a structured path to make change
not just possible, but sustainable.
The ADKAR model was invented by Jeff Hiatt,
the founder of Prosci.
Here’s how ADKAR breaks down the process:
➡️ Awareness
Identify what is and isn’t working in your organisation.
Make sure your team knows why change is essential.
➡️ Desire
Spark interest and commitment by highlighting the
benefits and showcasing successful examples.
➡️ Knowledge
Provide the training and tools necessary for the change.
Help teams learn and prepare effectively.
➡️ Ability
Empower your team with practice and support,
removing obstacles that may hinder their progress.
➡️ Reinforcement
Sustain the change with ongoing support,
recognition, and by celebrating milestones.
❌ Skipping any of these steps leads to:
↳ Resistance from your team.
↳ Lack of understanding and engagement.
↳ An unsuccessful change initiative.
✅ Following ADKAR ensures:
↳ Clear communication and purpose.
↳ Empowered, prepared teams.
↳ Long-term adoption and success.
🧠 Remember;
The ADKAR model is more than a checklist.
It’s your roadmap to seamless, impactful change.
1. Rule 1: One point outside the control limits
If a point falls outside the upper or lower control limits, something unusual has happened.
2. Rule 2: Eight or more points in a row on one side of the centerline
If eight or more points are all above or all below the centerline, the process may have shifted.
3. Rule 3: Six or more points in a row showing a steady increase or decrease
If six or more points trend up or down, it suggests a consistent change in the process.
4. Rule 4: Two out of three points near the control limits
If two of three points are near the control limits, the process is approaching its limits.
5. Rule 5: Fifteen or more points clustered near the centerline
If 15 or more points are close to the centerline, the process might be too stable or not varying enough.
Developing a mine is a complex and multi-step process that requires careful planning, expertise, and attention to environmental, economic, and safety considerations. Here’s a brief overview of the key steps involved in bringing a mining project from exploration to production:
𝗘𝘅𝗽𝗹𝗼𝗿𝗮𝘁𝗶𝗼𝗻 🔍
The journey begins with identifying and assessing mineral deposits. Geologists conduct geological surveys, sampling, and drilling to determine the size, grade, and location of the mineral resources.
𝗙𝗲𝗮𝘀𝗶𝗯𝗶𝗹𝗶𝘁𝘆 𝗦𝘁𝘂𝗱𝘆 📈
After discovering a viable deposit, a feasibility study is conducted. This study evaluates the technical, economic, and environmental aspects to determine if the project is financially viable and sustainable.
𝗣𝗲𝗿𝗺𝗶𝘁𝘁𝗶𝗻𝗴 𝗮𝗻𝗱 𝗔𝗽𝗽𝗿𝗼𝘃𝗮𝗹𝘀 ✅
Mining projects require various government approvals, environmental permits, and land-use agreements. This step ensures the project complies with legal and environmental regulations.
𝗠𝗶𝗻𝗲 𝗗𝗲𝘀𝗶𝗴𝗻 𝗮𝗻𝗱 𝗣𝗹𝗮𝗻𝗻𝗶𝗻𝗴 🏗️
Engineers design the layout of the mine, taking into account safety, efficiency, and environmental impact. Planning includes the type of mining (open-pit or underground), equipment, infrastructure, and operational schedules.
𝗖𝗼𝗻𝘀𝘁𝗿𝘂𝗰𝘁𝗶𝗼𝗻 🚧
With approvals in place, construction of the mine infrastructure begins. This includes building access roads, processing plants, waste disposal facilities, and accommodation for workers.
𝗢𝗽𝗲𝗿𝗮𝘁𝗶𝗼𝗻𝘀 ⚙️
Once construction is complete, mining operations start. This involves extracting the ore, transporting it, and processing it to separate valuable minerals from waste.
𝗖𝗹𝗼𝘀𝘂𝗿𝗲 𝗮𝗻𝗱 𝗥𝗲𝗵𝗮𝗯𝗶𝗹𝗶𝘁𝗮𝘁𝗶𝗼𝗻 🌱
At the end of the mine’s life, closure and rehabilitation activities begin. This ensures the land is restored to a natural or productive state, addressing environmental and safety concerns.
Developing a mine requires significant investment, planning, and cooperation between engineers, geologists, environmental scientists, and regulatory authorities. With careful management, mining can be a source of sustainable economic growth, while minimizing its environmental impact.
The Geological considerations are critical during the drilling phase of exploration to ensure effective and safe drill hole path design.
Generally the key factors include:
1. Understanding the local geology, such as rock type, structure, and stratigraphy, which influence drillability and stability.
2.Identifying fault lines, fractures, and mineralization zones helps optimize the drill path to target economically viable resources while minimizing the risk of equipment damage.
3.Evaluating hydrogeological conditions is essential for managing groundwater and preventing contamination.
The orientation of the drill holes should align with geological features to enhance resource recovery and reduce drilling costs.
Incorporating geophysical data and previous drilling results into the planning process improves accuracy in predicting geological conditions encountered during drilling.
Effective communication with geologists and engineers ensures that adaptations can be made in real-time, enhancing the overall success of the exploration project.
The choice between surface and underground mining methods is a strategic decision that significantly impacts project feasibility, cost efficiency, and operational safety. Below are the essential factors that guide this selection:
1.Surface Mining
Optimal For: Shallow, extensive deposits accessible with minimal overburden removal.
Advantages: Offers higher production rates, lower initial capital costs, and streamlined timelines for project initiation.
Limitations: Higher environmental impact due to waste removal and increased land use, often restricted in densely populated or environmentally sensitive areas.
2.Underground Mining
Optimal For: Deep or geologically complex deposits where surface methods are impractical or prohibited.
Advantages: Minimal surface disruption and enhanced ore selectivity, reducing waste and environmental footprint.
Challenges: Higher upfront capital requirements, extended development phases, and complex safety considerations.
Hybrid Approach
Transitioning Methods: For deposits extending from surface to significant depths, a hybrid approach (e.g., surface extraction transitioning to underground methods) maximizes resource recovery while managing costs effectively.
Key Decision Factors
Deposit Characteristics: Depth, shape, and ore-to-waste ratio are fundamental in method selection.
Economic Viability: Capital costs, operational efficiencies, and production scale determine cost-effectiveness.
Safety and Environmental Impact: Surface mining is generally safer, but underground methods reduce surface-level impact, crucial in high-density or ecologically sensitive regions.
Regulatory and Social Considerations: Compliance with local regulations and community expectations is essential, particularly for surface operations near populated areas.
Strategic Insights
Balancing surface and underground mining methodologies can optimize recovery rates and profitability while adhering to environmental and social governance (ESG) principles. Each project requires an in-depth analysis of technical, financial, and societal factors to ensure sustainable, cost-effective resource extraction. ⛏️ 🌍
For all maintenance engineers
Today, I came across an excellent file from the Reliability Academy titled "9 Types of Maintenance," written by the Great Erik Hupjé 👏.
The document is simple yet powerful. It breaks down different maintenance strategies in a clear and professional way, making it easy to choose the right approach for your needs.
This file is a must-read for anyone interested in learning more about maintenance and how to apply the right strategy in their facility or organization.
Huge thanks to Erik Hupjé for creating such a valuable and straightforward.
Source: Fady Faried
Source: Credit to Erik Hupjé, https://reliabilityacademy.com/
Rescaté un texto publicado por el diario "El Cronista". La nota tiene más de un año de antigüedad, pero mantiene su vigencia en función de la experiencia práctica que todos tenemos en las oficinas y empresas.
Lo dice Harvard: 7 de cada 10 reuniones no sirven para nada
Una investigación muestra que el 92% de los empleados considera que las reuniones son improductivas
Aunque las reuniones de trabajo pueden ser fundamentales para el correcto desempeño de la vida laboral, cada vez hay más estudios que cuestionan la verdadera utilidad de estas reuniones con respecto a la productividad de los trabajadores.
La revista de la escuela de negocios de la Universidad de Harvard ha abordado esta cuestión a partir de una encuesta realizada entre cientos de ejecutivos y trabajadores. Las conclusiones son reveladoras: hasta el 70% de las reuniones serían prescindibles, en la medida en que generan muchos más problemas que soluciones.
La investigación muestra que el 92% de los empleados considera que las reuniones son improductivas. Y es que, a pesar de lo que pueda pensarse, el nuevo estudio de Harvard señala que durante la pandemia se produjo una disminución del 20% en la duración promedio de los encuentros. Sin embargo, el número de sesiones celebradas aumentó, de media, un 13,5 %.
La revista Forbes ha informado de las conclusiones de diversos empresarios sobre cómo modificar la incidencia negativa que pueden tener las reuniones. Entre las posibles soluciones aportadas están:
1) la introducción de un límite de 20 minutos que actúa como tope a la duración de estas citas
2) la aplicación de una cifra máxima de reuniones diarias o semanales
3) la regla de realizar las reuniones de pie, evitando sentarse y generando así un incentivo para que las conversaciones sean más ágiles.
En las 76 empresas encuestadas se descubrió que la productividad de los empleados era un 71% más alta cuando los encuentros se reducían un 40%. Según los investigadores, esto se debe, en gran medida, a que los empleados se sienten más empoderados y autónomos. Así, en lugar de regirse por el horario, se les permite hacerse cargo de sus listas de tareas pendientes y se responsabilizaron de las mismas, lo que en consecuencia aumentó su satisfacción en un 52%.
Por otro lado, el estudio demuestra que eliminar el 60% de las reuniones aumenta, en estas empresas, la cooperación en un 55%, ya que se da a los trabajadores la posibilidad de hallar mejores formas de conectarse entre los miembros de los equipos a un ritmo adecuado para ellos, a menudo utilizando herramientas de gestión de proyectos, como Slack o Teams, para ayudar en las comunicaciones específicas de cada proyecto. Al hacerlo, el riesgo de estrés disminuyó en un 57%, lo que mejoró el bienestar general de los empleados.
Por último, la comunicación fue un 65% más clara y más efectiva, favoreciendo que hubiera muchos menos malentendidos. Para revisar una tarea o solicitud, las personas revisarían rápidamente una conversación anterior de Slack o el resumen de un proyecto. Así, el uso frecuente de frases como "Pensé que me habías dicho..." o "Tenía la impresión" rara vez se usaban entre estos trabajadores.
Following the discussion about the Dozer Push Method some time aago in my previous post, in this moment, i'll try to give a general overview of the cost and benefits of this method. and next post i'll explain about the planning and implementation to mine scheduling.
The cost-benefit analysis of Dozer Push Method in mining operations primarily arises from reduced dependency on trucks and excavators, leading to lower operating costs. Below is an overview of the cost and benefit considerations:
=> Cost Savings
1. Reduced Fuel Consumption:
• Bulldozers consume significantly less fuel than a fleet of trucks and excavators.
• Example: A standard dozer may use 15-20 liters/hour of fuel, whereas a large mining truck can consume 50-100 liters/hour.
2. Lower Maintenance Costs:
• Trucks and haul roads require frequent maintenance, increasing costs.
• Bulldozers operate in a smaller, more contained area, leading to reduced wear and tear.
3. Reduced Equipment Requirements:
• Fewer trucks and excavators are needed, saving on capital and operating expenses.
• A single dozer can replace multiple trucks for short-distance material movement (typically up to 200 meters).
4. Smaller Workforce:
• Fewer operators are required as the method relies more on dozers than complex truck-excavator systems.
5. Less Road Construction and Maintenance:
• The method eliminates or minimizes haul road construction, which can be costly, particularly in rugged terrains.
=> Benefits
1. Operational Efficiency:
• For short distances, dozers can move material more quickly and effectively than trucks, reducing cycle times.
2. Flexibility:
• Bulldozers can operate in areas where trucks may not be feasible, such as steep slopes or tight spaces.
3. Environmental Benefits:
• Reduced fuel consumption translates to lower greenhouse gas emissions and a smaller carbon footprint.
4. Improved Safety:
• Fewer vehicles on site reduce the risk of collisions and accidents, enhancing overall safety.
=> Potential Costs
1. High Initial Capital for Dozers:
• Purchasing or leasing large bulldozers can require significant upfront investment.
• However, the long-term savings often outweigh this cost.
2. Limited Efficiency Over Long Distances:
• Dozer push is cost-effective only for short distances (typically less than 200 meters). For longer distances, trucks and conveyors are more economical.
3. Steeper Learning Curve:
• Operations may require retraining of personnel to maximize the efficiency of dozer push operations.
=> Conclusion
The Dozer Push Method offers significant cost savings in the right conditions (short distances, suitable slopes) and is particularly effective in shallow mining operations. However, a detailed feasibility study should evaluate specific project conditions to determine the exact cost-benefit ratio.
In theory, it´s possible to calculate an optimum rate of extraction from an ore body, knowledge or precise assumption of the total tonnage and its sequential grades (including the effects of varying the cutoff grade), and of all cost and product prices throughout the project life is required.
💰 The maximized quantity might be total profit, total cash flow, the net present value or the internal rate of return. Thus when allowing for the practical inaccuracies of data, the calculated results cannot be considered critical. Hence, although valid, a highly mathematical approach to mine life determination is seldom of practical use.
🔍 Too low a production rate sacrifices possible economies of scale and defers possible profits too far into the future. Conversely, too high a rate may drive up the project’s capital cost beyond any ability to repay within the shortened life. Too high an output may be unsalable, while too short a life for a large enterprise may be wholly undesirable on social grounds.
In real life, rates of output are strongly limited or influenced by practical problems. One of the most important of these is working space. A mine may be able to increase output as it gets older solely because its ever expanding workings offer more points of attack.
🚚 In an open pit the working space for equipment and hence maximum production rate tends to vary with the area (ft2) exposed while tonnage varies with volume (ft3). Thus one might expect the production rate for groups of more-or-less similarly shaped ore bodies to be proportional to the two-thirds power of the ore body tonnage.
🧮 The life would then be proportional to the cube root of that tonnage (F1). In this equation, it is immaterial whether short or metric tons are used. It is more convenient to use quantities expressed in millions and except for special conditions, the practical range of variation seems to lie within a factor of 1.2 above and below (F2).
Taylor studied many actual projects (some operating and others only planned) involving a wide range of ore body sizes, and shapes (other than thin deposits of very large lateral extent), for which the total ore reserves were reasonably well known before major design commenced. He found that the extraction rates seemed proportional to the three quarters power of the ore tonnage rather than the two-thirds power. The designed lives were proportional to the fourth root of the tonnage.
💡 The rule provides an appropriate provisional output rate for preliminary economic appraisals and will define a range of rates for comparative valuation at the intermediate stage after which a preferred single rate can be selected for use in the feasibility study.
🖼️ The empirical formula (F2) generates the values presented in table.
📜 Reference:
W. Hustrulid, M. Kuchta & R. Martin, Open pit mine planning & design Vol.1 Fundamentals, CRC Press.
Last year’s inaugural State of Critical Minerals report from the Payne Institute addressed the ‘big picture” related to the essential minerals, metals, and materials underpinning modern economies. We discussed the outlook for the dramatic demand growth that is required to enable the world’s decarbonization. We reviewed the geopolitical and national security risks related to China’s dominance of several critical minerals. And, we highlighted the urgent need to diversify and bring greater resilience to our nation’s mineral supply chains.
That urgency and global attention has only increased over the last year.
Various challenges still exist: bolstering domestic mining for minerals, which include obstacles for new mine development; workforce constraints in the U.S. after decades of de-emphasizing domestic mining; and an investment landscape that makes it challenging for mining companies to attract capital.
Additionally, we still do not have agreed principles for engagement with communities and Tribes, which could help show those communities that unlike mining’s legacy, the future can offer vibrant economic development, purpose, and jobs.
It is clear that a dual focus on innovative technologies and techniques, and engagement with communities, Tribes, and wider society will both be foundational to success. Both of these have to be coupled with clear policy and institutional arrangements.
In the hunt for solutions, there is no shortage of ideas from multi-party working groups, and embedded in several pieces of proposed legislation winding their way through Congress. Perhaps the most significant of the latter are also the latest to be introduced. Two bills from Senators Hickenlooper from Colorado and Tillis from North Carolina, announced at our recent Critical Minerals Symposium, seek to redress lack of integration—of strategy, of coordinating agency and of research agenda.
We have no fewer than three critical minerals priorities, produced by the Department of Defense, Department of Energy and the US Geological Survey. We lack a coordinated effort driving domestic mining exploration and its future. This is illustrated by the complexity of having to navigate through upwards of 20 government agencies. And there is a lack of coordination of necessary basic research across mining activities, from exploration through to processing and tailings management.
The School of Mines stands ready to do its part . A coordinating entity, such as the FutureMine Initiative, can synthesize the multiple disciplines involved in the future of mining, including advanced technologies in geophysical imaging, sensing, robotics, controls and artificial intelligence (Copan, 2023).
In this year’s State of Critical Minerals report, we consider how the U.S. is responding to this rapidly changing landscape. We highlight leading work being done on the ground and with the data by the extraordinary School of Mines faculty across disciplines spanning engineering, the social sciences and data science and analytics. Their leadership is offering paths to address challenges that are surely part of our collective way forward.
Morgan Bazilian
1) Gather Your Equipment:
Equipment Needed: Total station, tripod, tribrach, controller, cables, survey stake or nail, and a mallet.
Tip: Ensure all equipment is charged and ready for use.
2) Establish and Mark a Point of Reference:
Identify a fixed point to serve as your survey's point of reference.
Mark it: Secure this point with a stake or nail for visibility.
3) Set Up the Tripod at the Reference Point:
Open the tripod and position it directly over the reference point.
Alignment Tip: Center the tripod approximately over the marked stake.
4) Attach the Tribrach and Coarse Level:
Connect the tribrach and secure it on the tripod.
Initial Leveling: Use the coarse level on the tripod for preliminary adjustments.
5) Adjust as Necessary:
Fine-tune the tripod to get it as close as possible to being level.
Check Alignment: Ensure it is centered over the reference point.
6) Place the Total Station on the Tripod:
Carefully attach the total station to the tripod without disturbing its position.
Balance Tip: Ensure it remains aligned with the reference point.
7) Connect Cables:
Attach the battery pack and connect the controller to the total station.
Ensure Proper Connection: Check that cables are securely connected.
8) Power On and Start Controller:
Turn on the total station and activate the fine-level function on the controller.
Device Check: Confirm that all components are responding correctly.
9) Make Fine Adjustments:
Use the fine-level feature to center the total station precisely over the reference point.
Final Check: Ensure the instrument is perfectly level.
10) You’re Ready to Survey:
Begin taking measurements as required for your project, using the total station’s advanced surveying features.
Source: https://www.engineersupply.com/How-to-use-a-total-station.aspx
Thanks for sharing Ziad Samir
Reconciliation involves the collection of tonnage, grade (quality) and contained metal (product)
data from disparate and hopefully independent sources. Examples are exploration data,
production sampling data from blast holes or draw points, and process plant data. These data
may be compared by means of ratios (factors). The F1 factor usually relates short term (ore
control) model tonnages, grades and metal content to ore reserves depleted. The F2 factor
usually relates received at mill (measured by the mill) tonnages, grades and metal content to
delivered to mill production tonnages, grade and metal content. The F3 factor is F16F2 and
enables a comparison of a mine’s (measured by mine) ability to recover the tonnage, grade and
metal content estimated in ore reserves. The F1 factor measures the accuracy of orebody
knowledge in the ore reserves to the demarcation of ore and waste by ore control (short term
model). The F1 factor may be used to check and calibrate the selectivity of mineral resource
models and/or planned dilution assumed in transfer from mineral resources to ore reserves. The
F2 factor enables a check on unplanned dilution entering the ore stream between ore control and
the mill. By using the factors it is possible to calculate a monetary value on improvements in the
accuracy of orebody knowledge, selectivity and the effects of dilution and ore loss. Reconciliation
should be an implicit part of the mining process, and reconciliation targets should be a key
performance indicator for well run mines.
Source: Solomon Gumbie
Fill Gaps in Spatial Data with Spatial Interpolation !
How do we create smooth, continuous maps from scattered data points?
That’s where Spatial Interpolation comes in, predicting unknown values based on known ones to create a complete picture.
Let’s dive into some powerful techniques used in image processing and remote sensing:
Trend Surface Analysis - Great for seeing broad trends, this method uses a smooth surface to capture general patterns.
Inverse Distance Weighting (IDW) - Values closer together are more alike! IDW uses nearby points to estimate unknowns, perfect for clustered data.
Global Polynomial - Ideal for large areas, this method fits a polynomial to highlight big-picture patterns without detailed local changes.
Kriging - A geostatistical powerhouse, Kriging adapts to both distance and clustering, making it super accurate for complex data.
Natural Neighbor - Relies on the closest points around your target, creating a smooth, natural surface for irregular data.
Spline Interpolation - Creates smooth curves for a realistic surface, making it ideal for terrain modeling.
Each of these techniques has unique strengths, depending on the data and purpose.
Ready to learn more about Interpolation Techniques? Read Attached document!
📢 Coming up next:
Stay tuned! I’ll cover each of these techniques in detail over the next few days, making it simple, one step at a time!
👉 If this post helped you understand Interpolation in Spatial Data, feel free to repost and share the knowledge!
Follow Shehroz Khan and click the 🔔 to stay informed!
(Stand out with passion and strategy)
Asking smart questions shows you're thoughtful, prepared, and truly excited about the role.
It gives you a chance to dive deeper into the company’s goals and how you can contribute.
By asking the right questions it helps you stand out and see if the role fits your career goals.
Here are 9 strategic questions to ask in your next interview:
1️⃣ What recent project is the team most proud of?
↳ Shows you're invested in the company’s successes.
↳ Demonstrates your eagerness to achieve similar successes.
2️⃣ What challenges might come with this role?
↳ Signals you’re ready to tackle obstacles.
↳ Gives insight into what’s expected from day one.
3️⃣ How does the team collaborate on projects?
↳ Helps you assess team dynamics.
↳ See if the work style aligns with your preferences.
4️⃣ What defines success in this role after six months?
↳ Gives you a roadmap for early success.
↳ Shows you're eager to meet expectations.
5️⃣ What qualities help others succeed in this position?
↳ Allows you to match your strengths to the role.
↳ Shows you’re focused on growth and success.
6️⃣ What growth opportunities does the company offer?
↳ Demonstrates you’re serious about personal growth.
↳ Helps gauge if the company invests in employees' futures.
7️⃣ How would you summarize the company culture?
↳ Ensures the company values align with yours.
↳ Culture fit is key to long-term job satisfaction.
8️⃣ What’s a recent challenge the team overcame?
↳ Shows you're interested in problem-solving.
↳ Gives insight into the team’s resilience and collaboration.
9️⃣ What are the next steps in the interview process?
↳ Shows initiative and readiness.
↳ Prepares you for what’s to come.
These thoughtful questions help you assess the role and distinguish you from other candidates.
Remember, interviews are a two-way street—you’re interviewing them as much as they’re interviewing you.
¿Cómo vas a medir su progreso?
Se está acercando el año 2025 y seguramente ya tienes definidas las Prioridades Estratégicas que enfrentará tu área de RRHH o tal vez no.
Hace muy poco, la prestigiosa Consultora hashtag#Gartner, publicó las 5 Principales Prioridades de RRHH para el 2025, según una Encuesta que le realizó a más de 1400 profesionales de 60 países.
En ella destacaba, que la principal prioridad estaba relacionada con el Desarrollo de Managers y Gerentes. También resaltaba a la Cultura Organizacional, la Planificación Estratégica de la Fuerza Laboral, la Gestión del Cambio y la Tecnología de RRHH.
Hoy quiero comentarte sobre la Primera Prioridad que menciona Gartner y sobre cómo puedes medir su progreso en el tiempo:
Prioridad Estratégica para el 2025: Desarrollo de Managers y Gerentes
Si ésta, es también una de tus Prioridades para el 2025, te recomiendo tener en cuenta, al menos, estos 7 Objetivos y KPIs, en tu Estrategia de RRHH.
Obviamente, tanto los Objetivos como las Metas las deberás ajustar a tu situación particular, son solo a modo de ejemplificar.
¿Qué otros Objetivos y KPIs considerarías en tu Estrategia de RRHH en el 2025, relacionado con el Desarrollo de tus Líderes?
Conventionally, strategic planning is carried out following the 7 steps defined below:
1. Defining Key Corporate Objectives, Constraints, Key Performance Indicators
2. Open Pit Optimisation
3. Detailed Pit Design
4. Pushback Optimisation and Selection
5. Strategic Scheduling
6. Material Allocation
7. Economic Evaluation and Analysis
In this article I will be using a dummy gold-copper deposit in order to go through the strategic planning process. It is important to keep in mind that this is a demo dataset and the parameters used are also based on assumptions.
Thabang Maepa
🫵 Peter House Capital hosts Mineomics
Mining Economics Explained was presented to a group of investors and mining executive on Oct 15 at Peter House Capital in London. The mission is to challenge old paradigms, refocus miners on the business of maximising wealth for shareholders.
🫵 Driving new paradigms
Highlighting the primacy of the orebody and explaining the key elements of our proprietary algorithm to rapidly generate multiple Hills of Value to represent the outcomes of alternative strategies is key to driving a new paradigm in the mining industry .
🫵 Show casing orebody DNA and integrating sound economic principles
Recognising that ore deposits are not all borne equal, equipping miners and investors with the means to assess the economic capacity of their orebody portfolio from design through to continuing operations is Mineomics goal.
🫵 Market responding to Mineomics
Demand for Mineomics training sessions is rapidly gaining traction.
GIS is an indispensable tool for solving complex spatial problems and making informed decisions.
However, even seasoned professionals can encounter setbacks due to preventable mistakes.
Whether you're just starting out or have years of experience, it’s crucial to recognize and avoid common errors that can compromise data quality, mislead analysis, or hinder project progress.
From overlooking metadata to relying on outdated data or poorly organizing your layers, small oversights can have big consequences.
By understanding these 16 mistakes and learning how to prevent them, you can streamline your workflows, improve accuracy, and ensure your GIS projects deliver maximum value.
Remember, successful GIS work isn’t just about using the right tools—it’s about applying them thoughtfully and consistently.
🌟 Boost Your Strategic Planning with Essential Business Diagrams 🌟
In today's dynamic business environment, having the right tools is key to making informed decisions. 📊 Whether you’re managing projects, enhancing processes, or optimizing business strategies, having a visual aid can make all the difference!
Here are some must-have business diagrams for strategic planning and analysis:
Affinity Diagram: Perfect for organizing ideas from brainstorming sessions and identifying patterns.
Decision Tree: Helps break down complex problems into manageable steps, leading to optimal decision-making.
Value Stream Map: Ideal for visualizing and improving the flow of materials and information in your processes.
SWOT Analysis: An essential tool for identifying your business’s strengths, weaknesses, opportunities, and threats.
PEST Analysis: Analyze the external macro-environment factors to help your business stay ahead of the curve.
Visual tools like these not only streamline your decision-making process but also foster collaboration and innovation within teams.
Want to make smarter, data-driven decisions? Start leveraging these business analysis tools today!
Source: Mohamed Mohamed Hossam, FMVA®, FTIP™, MBA, PFAD
1. Unsafe Conditions
Physical hazards that can cause accidents (e.g., wet floors, exposed wires).
Measurement:
Inspection frequency
Number of unsafe conditions reported
Resolution rate (how quickly issues are fixed)
2. Unsafe Acts
Employee behaviors that increase risk (e.g., not wearing PPE, ignoring protocols).
Measurement:
Behavior observations
Training participation rates
Reporting of unsafe acts
3. Near Miss
Incidents that almost result in an accident but do not cause injury or damage.
Measurement:
Near miss reporting rate
Investigation rate of near misses
Preventive actions taken after near misses
4. Accident
Unplanned events leading to injury, illness, or property damage.
Measurement:
Total Recordable Incident Rate (TRIR)
Lost Time Injury Rate (LTIR)
Severity rate (average lost workdays per incident)
5. Safety Culture Excellence
Collective beliefs and attitudes about safety within the organization.
Measurement:
Employee safety perception surveys
Participation in safety initiatives
Effectiveness of recognition programs for safe behavior
In the world of mining and construction, blast performance is key to achieving operational efficiency, safety, and cost-effectiveness. But here’s the thing: you can’t improve what you don’t measure. That’s why blast monitoring is so essential—it provides the data necessary for informed decision-making and performance optimization.
Here’s why blast monitoring cannot be overlooked:
1. Accurate Event Recording
Each blast is a unique event with a range of variables, such as vibration, air overpressure, and fragmentation patterns. If these aren’t accurately recorded, you lose the ability to understand the true effects of each blast. Without reliable data, you’re essentially flying blind, making it difficult to identify trends or areas for improvement.
2. Optimization of Blast Design
Through the analysis of blast event data, teams can identify factors like excessive vibration, poor fragmentation, or suboptimal blast timing. With this information, engineers can tweak the blast design—adjusting hole patterns, charge quantities, or delay sequences—to improve performance in subsequent blasts.
3. Environmental and Regulatory Compliance
Blast monitoring ensures that operations stay within legal and safety guidelines. By tracking air overpressure and ground vibration, it becomes easier to comply with environmental regulations and minimize the impact on surrounding communities. Without this monitoring, operators risk fines, delays, or damage to reputation.
4. Continuous Improvement
Monitoring blast performance over time creates a feedback loop—data from previous blasts informs better decisions for future ones. This cycle of continuous improvement drives operational efficiency, reduces costs, and enhances safety, helping to move closer to achieving the ideal blast every time.
5. Safety First
Blast events that aren’t properly monitored could result in undetected issues like excessive vibrations, flyrock, or misfires. These hazards pose significant safety risks to workers and equipment. Effective monitoring ensures these events are recorded, assessed, and mitigated, creating a safer working environment.
In summary, without comprehensive blast monitoring and data recording, you’re missing the foundation for improving blast performance. Every blast is an opportunity to learn, optimize, and evolve your processes.
Let’s embrace technology and data-driven insights to create safer, more efficient, and more cost-effective blasting operations!
Estamos solo hablando de cultura organizacional, o realmente la estamos viviendo y midiendo ?
✅️Nuestra cultura organizacional es el corazón que late y el cerebro que piensa de nuestra empresa. Moldea nuestro ADN, impulsa la innovación y garantiza nuestro éxito a largo plazo.
-------------------------------------
→ 𝐂ó𝐦𝐨 𝐦𝐞𝐝𝐢𝐦𝐨𝐬 𝐬𝐢 𝐞𝐥 𝐀𝐃𝐍 de nuestra organización está sano y fuerte?
Aquí tienes 7 métricas adicionales que pueden complementar las que ya aparecen en la imagen para medir la cultura organizacional:
=>Nivel de integración entre áreas::
Número de proyectos o iniciativas interdepartamentales exitosas / Total de proyectos en un periodo.
=>Tasa de adopción de nuevas tecnologías:
Empleados que adoptan una nueva tecnología / Total de empleados.
=>Índice de diversidad e inclusión:
Porcentaje de empleados que representan diversidad en género, raza, y otros factores / Total de empleados.
=>Tasa de satisfacción del liderazgo:
Puntuación obtenida en encuestas de satisfacción con el liderazgo / Puntuación máxima posible.
=>Índice de capacitación y desarrollo:
Horas promedio dedicadas a la capacitación por empleado / Total de empleados.
=>Tasa de participación en actividades de responsabilidad social:
Número de empleados que participan en actividades de RSE / Total de empleados.
=>Índice de confianza en la dirección:
Puntuación de confianza hacia la dirección obtenida en encuestas / Puntuación máxima posible.
Where are you on the burnout graph? ⬇️
Burnout is a silent but significant problem
that impacts your productivity, creativity,
and overall wellbeing.
It's not just about being overworked.
Burnout has clear signs you need to watch
for before it takes a toll on your health
and career.
Here are the positive signs (green) and
warning signs (red) of burnout:
❌ Rust Out
❌ Frustrated
❌ Bored
✅ Interested
✅ Stimulated
✅ Alert
✅ Decisive
✅ Creative
✅ Effective
✅ Flow
❌ Jaded
❌ Reduced efficiency
❌ Reduced creativity
❌ Difficulty concentrating
❌ Indecisive
❌ Irritable
❌ Anxious
❌ Fatigue
❌ Exhaustion
❌ Burnout
If any of the warning signs sound
familiar, you may be on the path
to burnout.
The good news is, there are effective
ways to prevent burnout and keep
yourself on track:
✅ Set Boundaries:
Define clear work hours and respect
your personal time.
✅ Take Breaks:
Regular short breaks can recharge
your energy.
✅ Prioritise Tasks:
Focus on high-impact tasks first to
prevent feeling overwhelmed.
✅ Delegate Effectively:
Share the workload with your team
to reduce pressure.
✅ Unplug After Work:
Disconnect from work emails and
notifications after hours.
✅ Practice Self-Care:
Make time for physical activity
and mindfulness.
🧠 Remember:
Burnout is preventable when you
take action early.
Pay attention to the warning signs and
take steps to protect your health and
wellbeing before it’s too late.
When was the last time you checked your
own wellbeing? Comment below ⬇️
Digital Elevation Models (DEMs), Digital Surface Models (DSMs), and Digital Terrain Models (DTMs) are essential tools in geospatial analysis, each serving distinct purposes in the representation of terrain and surface features.
While DEMs focus solely on the elevation of the Earth's surface, DSMs include all objects above the ground, and DTMs provide a clear view of the bare earth by excluding features like vegetation and buildings.
Understanding the differences between these models is crucial for selecting the appropriate data for various applications, ranging from hydrological modeling to urban planning.
In summary, DEMs, DSMs, and DTMs each play a vital role in geospatial analysis, offering unique insights into the landscape.
By comprehending their specific characteristics, applications, and the nuances of processing these models, professionals can make informed decisions that enhance research, planning, and resource management.
As advancements in technology continue to evolve, these models will remain indispensable in understanding and visualizing the complexities of our environment.
Because inventory is the lifeblood in supply chain…
This infographic contains the top 23 KPIs in inventory management by category:
✅ SERVICE
1️⃣ OTIF (On Time In Full)
👉 shows how many orders are delivered on time in full
🧮 Number of On Time In Full Deliveries / Total Number of Deliveries X 100
2️⃣ Requested Delivery Date Adherence
👉 indicates how well a supplier or manufacturer meets the requested delivery dates set by the customer
🧮 Number of Orders Delivered on or before Requested Delivery Date / Total Number of Orders X 100
3️⃣ Net Promoter Score
👉 assesses customer satisfaction and loyalty
🧮 (Number of Promoter Scores / Total Number of Respondents) – (Number of Detractor Scores / Total Number of Respondents)
4️⃣ Perfect Order
👉 measures the customer orders that meet the 7 R’s criteria
🧮 Total Number of Perfect Orders / Total Number of Orders X 100
5️⃣ Order Fill Rate
👉 shows the ability of a company to meet customer orders with available stock, without backorders or delays
🧮 Number of Orders Fulfilled Immediately / Total Number of Orders X 100
6️⃣ Line Fill Rate
👉 calculates the % of lines the company can fulfill immediately with the on-hand inventory
🧮 Number of Lines Fulfilled Immediately / Number of Order Lines X 100
7️⃣ SKU Fill Rate
👉 determines the % of SKUs the company can fulfill immediately with the stock on hand
🧮 Number of SKUs Fulfilled Immediately / Total Number of SKUs X 100
8️⃣ Order Accuracy
👉 shows the % of orders shipped free of errors, focusing on the internal aspects of order fulfillment
🧮 Error Free Orders / Total Orders Shipped X 100
9️⃣ Line Order Accuracy
👉 indicates the % of line orders shipped free of errors
🧮 Error Free Line Orders / Total Lines Shipped X 100
1️⃣0️⃣ Customer Order Fulfillment Time
👉 measures the following cycles: order, source, transform, fulfill, return
🧮 Sum of Actual Cycle Times For All Orders Delivered / Total Number of Orders Delivered
✅ EFFICIENCY
1️⃣1️⃣ Inventory Days of Supply
👉 shows the number of days the current inventory will last before it runs out, considering the current rate of sales or consumption
🧮 Current Inventory / Average Daily Usage (or Sales)
1️⃣2️⃣ Days of Forecast Cover
👉 assesses how many days of future demand (as forecasted) can be met with the current inventory on hand
🧮 Current Inventory / Forecasted Daily Demand
1️⃣3️⃣ Inventory Turnover
👉 indicates how fast or slow inventory is moving
🧮 Cost of Goods Sold / Average inventory X 100
1️⃣4️⃣ Average Inventory
👉 determine the mean amount of inventory held over a specific period
🧮 (Beginning Inventory + Ending Inventory) / 2
See 👀 the infographic for the remaining KPIs.
Any others to add?
Les indicateurs de performance (KPIs) pour le service des ressources humaines permettent de mesurer l'efficacité de la gestion du personnel et d'aligner les objectifs RH avec ceux de l'entreprise.
🌟Taux de rotation du personnel (Turnover)
🔸Cet indicateur mesure le pourcentage de salariés qui quittent l’entreprise sur une période donnée.
🌟Taux d'absentéisme
🔸Il évalue le pourcentage de temps de travail perdu à cause des absences non planifiées (maladie, congés non payés, etc.).
🌟Coût de recrutement par employé
🔸Cet indicateur mesure le coût moyen dépensé pour recruter un nouveau collaborateur.
🌟Temps moyen de recrutement (Time to hire)
🔸Cet indicateur mesure le temps moyen nécessaire pour combler un poste vacant.
🌟Taux de rétention du personnel
🔸Il permet de mesurer la capacité de l’entreprise à conserver ses employés sur une période donnée.
🌟Taux de satisfaction des employés
🔸Mesure le niveau de satisfaction des employés en fonction des sondages et des feedbacks internes.
🌟Coût de formation par employé
🔸Cet indicateur permet de connaître le montant moyen investi dans la formation des employés.
🌟Taux de promotion interne
🔸Mesure la proportion de postes pourvus par des promotions internes par rapport aux recrutements externes.
Ces indicateurs permettent aux responsables RH de prendre des décisions éclairées concernant l'efficacité de leurs politiques et pratiques en matière de gestion du personnel.
NB Les formules de calcul de ces ratios disponibles sur la poste publiée.
Merci de mentionner les autres KPIS dans un commentaire.
The purpose of this MLRA Vocabulary is to provide a consistent, shared baseline of terms relevant to declared mine rehabilitation in Victoria.
Language employed around mine rehabilitation and closure is evolving and varies from region to region. A shared vocabulary is a simple and effective way to facilitate better discussions, decision making and, ultimately, better outcomes.
This vocabulary aims to:
• Be a concise, curated reference of terms relevant to declared mines
• Remain a living document, updated as terms evolve and expand
• Serve as a reference for community, industry and government stakeholders
Source : www.mineland.vic.gov.au/
Source: Credits to Mine Land Rehabilitation Authority (MLRA)
=> Application Benchmarks and Operating Techniques
Requirements
Large Wheel Loaders
Hydraulic Front Shovels
Hydraulic Backhoes
Electric Rope Shovels
Large Walking Draglines
Large Mining Trucks
Motor Graders
Track-type Tractors
Wheel Dozers
Wheel Tractor-Scrapers
Drills
=> Cat MineStar™ System
Improvements through Technology
=> Haul Road Design and Maintenance
Design and Maintenance
=> Truck Dump Design and Maintenance
Truck Dump Operation
=> Scale System Benefits
Transcale System Offerings and Benefits
=> Management Review
Strategies
Reference Information
Performance Handbook 42 Specifications
Mine Site Illustrations
El método de ventilación para operaciones de hundimiento por bloques es complejo y crítico debido a varios desafíos inherentes al proceso. Uno de los aspectos más delicados es la gestión de las chimeneas de ventilación, que tienden a perderse o quedar obstruidas por el movimiento continuo de material durante las operaciones.
💡𝐏𝐮𝐧𝐭𝐨𝐬 𝐂𝐫í𝐭𝐢𝐜𝐨𝐬:
**𝙋é𝙧𝙙𝙞𝙙𝙖 𝙙𝙚 𝘾𝙝𝙞𝙢𝙚𝙣𝙚𝙖𝙨:Las chimeneas pueden verse comprometidas por el colapso del material o el cambio de la estructura interna del macizo rocoso, dificultando el flujo de aire y aumentando el riesgo de acumulación de gases peligrosos.
**𝙈𝙖𝙣𝙩𝙚𝙣𝙞𝙢𝙞𝙚𝙣𝙩𝙤 𝘾𝙤𝙣𝙩𝙞𝙣𝙪𝙤: Se requiere un monitoreo constante y mantenimiento frecuente para asegurar que las rutas de ventilación permanezcan operativas y eficientes.
**𝘼𝙙𝙖𝙥𝙩𝙖𝙗𝙞𝙡𝙞𝙙𝙖𝙙 𝙙𝙚𝙡 𝙎𝙞𝙨𝙩𝙚𝙢𝙖:El sistema de ventilación debe ser flexible y ajustarse rápidamente a los cambios en la estructura de la mina para mantener condiciones seguras.
Dado el alto grado de criticidad y complejidad, es fundamental contar con un diseño de ventilación robusto y adaptable, junto con un monitoreo constante para evitar problemas operativos.
Si necesitas optimizar tu sistema de ventilación en condiciones tan desafiantes, visita www.vpsconsulting.com.pe
En 🟡🔵VPS CONSULTING estamos listos para ayudarte.
Source: Frank Mariluz
1. Mean Time Between Failure (MTBF):
What it means: This is the average amount of time a system or piece of equipment operates smoothly before something goes wrong and it breaks down.
Why it matters: It helps you understand how reliable the system is by showing how long it can keep working before a failure occurs. The longer the MTBF, the more dependable the system is.
2. Mean Time To Repair (MTTR):
What it means: This is the average amount of time it takes to repair a system once it has failed and get it back up and running.
Why it matters: Knowing the MTTR helps you gauge how quickly your team or service can fix a problem and restore operations, minimizing downtime.
3. Failure Rate (λ):
What it means: This tells you the chance or likelihood that the system will fail during a certain period, like per hour or per day.
Why it matters: It gives you an idea of how often failures are expected to happen. A higher failure rate means the system is less reliable and more prone to breakdowns.
4. Reliability (R):
What it means: This is the likelihood or probability that the system will keep working without failure for a specific period.
Why it matters: It helps you predict how likely the system is to run smoothly for a set amount of time. A higher reliability means there's a better chance the system will operate without issues over the period you're measuring.
This pictorial periodic table is colorful, fun, and packed with information. In addition to the element's name, symbol, and atomic number, each element box has a drawing of one of the element's main human uses or natural occurrences. The table is color-coded to show the chemical groupings. Small symbols pack in additional information: solid/liquid/gas, color of element, common in the human body, common in the earth's crust, magnetic metals, noble metals, radioactive, and rare or never found in nature. It does not overload kids with a lot of detailed numbers, like atomic weights and valence numbers.
This textual periodic table is packed with even more information. In addition to the element's name, symbol, and atomic number, each element box contains a textual description of the element's physical properties and a list of several of its human uses and/or natural occurrences. The table is color-coded to show the chemical groups, and each group is described in a panel of the same color. Other info panels describe atomic structure, chemical bonding, and radioactivity. It does not overload kids with a lot of detailed numbers, but it does provide some simple rules-of-thumb about atomic weights and valence numbers.
Note: Elements in Pictures and Elements in Words are a set. Either may stand alone, but they work best together.
Source: elements.wlonk.com
I wrote on the fascinating topic of mine reconciliation for North American Mining magazine's July/August issue.
Key takeaway: mine reconciliation is hugely important, not well understood, and challenging to get right. As Maptek's Peter Johnson concluded, mines that "close before the planned end of life have usually failed at some point to reconcile."
Thanks to Peter, Rayleen Hargreaves of Datamine, Rudy Moctezuma of Eclipse Mining Technologies, Nathan Flesher, Patrick McCann, and Karilyn Farmer of McKinsey & Company, and Craig Morley and Ian Glacken of Snowden Optiro for sharing their knowledge and experience.
We started this year by highlighting that global political risk hit a five-year high in early 2023, according to our data covering conflict intensity, civil unrest and government stability.
As we head into the second half of the year, it's clear the world remains in a state of flux. Prolonged economic instability, spiralling geostrategic competition and the impacts of the escalating climate crisis are just a handful of the interconnected risks that companies are having to contend with.
This article pinpoints a few key areas in which this volatility has translated into major shifts in the global risk environment, according to 2023-Q3 data from our suite of 170+ country risk indices.
By Jess Middleton, 3 August 2023
Source: https://www.maplecroft.com/products-and-solutions/geopolitical-and-country-risk/insights/resource-rich-countries-step-up-intervention-in-extractives-sector-in-q2/
I always recommend when modelling truck cycles in a schedule to make sure you do some ad hoc haul path auditing (“sanity check” for speeds achieved in the model). So many mine scheduling engineers don’t!
You might be surprised that the model is NOT doing what you think it is doing. Usually not what it should be doing anyway.
One common problem I see in other peoples’ models (who haven’t looked at the haul path speed vs path segment graph) is an issue of high(ish) speeds modelled around switchbacks.
Mining has always been a labor-intensive and high-risk industry, where productivity and safety are key priorities. The introduction of autonomous haulage systems (AHS) represents a significant shift toward improving both operational efficiency and safety in mining transportation. AHS utilizes self-driving trucks equipped with advanced sensors, artificial intelligence (AI), and data processing technologies to transport ore and other materials without human intervention. These systems are transforming mine sites, leading to optimized operations, cost savings, and reduced risk. This article explores the benefits, challenges, and future potential of autonomous haulage systems in mining transportation.
Accidentes fatales en la minería chilena: Un análisis desde el 2011 al 2023
🛑La principal causa…Golpeado por Roca
Los datos nos proporcionan una visión clara y necesaria sobre los desafíos que enfrentamos, más allá de nuestras opiniones personales y sesgos…
Utilizando datos oficiales de SONAMI, los top 3 son los siguientes:
1️⃣191 fallecidos golpeados por rocas.
2️⃣176 fallecidos por caídas desde altura.
3️⃣101 fallecidos por vehículos motorizados.
Estos números reflejan una realidad que no puede ser ignorada y que lamentablemente nos precede… (para mayor detalles analizar el resumen adjunto)
🔑 Lejos de inmovilizarnos, este debe ser un combustible para seguir implementando controles críticos en terreno.
👉 P.S. ¿Cómo crees que podemos reducir estas cifras? Comparte tus ideas.
Procurement Models - Your Free Guide 🎁
I’ve just read ‘The Procurement Models Handbook’, by Andrea Cordell & Ian Thompson.
It’s an essential resource for Procurement Pros.
In this carousel I’ve simplified it with a picture of every Procurement model and a simple explanation.
Models that explain
➟ Key Processes
➟ Strategic Analysis
➟ Relationship Building
➟ Negotiation Techniques
➟ Management Theories
➟ Organisation Structures
You can use this slide deck as
✅ your personal checklist
✅ an interview revision guide
✅ to share with your team
✅ give it to stakeholders to explain
✅ store it on your intranet as a guide
Has this helped?
Which model is your favourite?
Any model I’ve missed?
Let me know in the comments. 👇
Feel free to ♻️ repost or share this with your network.
____________________
📌 Do you want a hi-res PDF of this carousel and all the other ones I release straight to your inbox?
I’m Tom Mills Procurement Protagonist®️
I simplify Procurement.
Just sign up to my free newsletter here: https://procurebites.com/
You’ll get weekly insights and my PDF cheat sheets for free, released every Monday via the newsletter.
Source: https://www.linkedin.com/posts/tom-mills-procurement_procurement-models-explained-activity-7242868093855707139-XX6t?utm_source=share&utm_medium=member_desktop
The map highlights some of the world's largest mines (excluding coal and salts). I focus on the biggest pits and highest producing assets within each commodity category. The "Other" category includes primarily Nickel, Zinc, Molybdenum, some Silver, and various byproducts.
What stands out is the sheer scale of iron mining compared to other commodities. So, why aren't all the largest mines iron mines? The answer lies in ore grades—the amount of metal extracted per ton of rock moved.
Ore grades can vary significantly. For example, from a ton of iron ore, you might recover 600,000 grams of iron. In contrast, a ton of copper ore yields only about 8,000 grams of copper. This means copper mines need to move much larger volumes of rock to achieve their output, which is why they are often massive, even if their production is much lower than that of iron mines.
Gold represents only a small fraction of total production in terms of volume, gold mines must be tiny right? No. Gold ore grades are extremely low—often 3-5 grams of gold per ton of material mined. Due to its high value, it’s economically viable to operate large mines, digging deep and hard to access the precious metal. Also, thanks to the high value, gold is often a recovered by-product of other mining activities; in fact, 30% of the gold production from the mines listed here comes as by-product from the mines that don’t primarily mine on gold.
I surely have missed some notable mines deserving of inclusion, so feel free to suggest any additions!
SPATIAL INTERPOLATION DEFINED
Spatial interpolation is the process of estimating unknown values at specific geographic locations using data from known points in the same area.
It involves generating a continuous surface (such as temperature, elevation, or pollution levels) from discrete data points by making assumptions about how the values change spatially.
This method is crucial in GIS for visualizing patterns, predicting phenomena, and filling gaps in spatial datasets.
THE 7 TECHNIQUES
1. 📍Inverse Distance Weighting (IDW)
Principle: Nearby points have a greater influence.
Best For: Smooth, gradual surfaces.
👍 Pro: Simple and intuitive.
👎 Con: Can produce unrealistic "bullseye" patterns.
2. 📊 Kriging
Principle: Uses statistical models to account for spatial correlation.
Best For: Data with known spatial relationships.
👍 Pro: Provides accuracy and uncertainty estimates.
👎 Con: Requires assumptions about data variability.
3. 🌀 Spline Interpolation
Principle: Fits smooth curves through data points.
Best For: Smooth and gradually changing phenomena.
👍 Pro: Produces smooth surfaces.
👎 Con: May oversmooth complex datasets.
4. 🌐 Natural Neighbor
Principle: Uses weighted averages of surrounding points.
Best For: Irregularly spaced data.
👍 Pro: No sudden jumps in the output surface.
👎 Con: Sensitive to the spatial arrangement of points.
5. 📈 Trend Surface Analysis
Principle: Fits a polynomial surface over the data.
Best For: Large-scale, broad trends.
👍 Pro: Good for capturing general patterns.
👎 Con: Misses local detail.
6. 🔲 Nearest Neighbor (Thiessen Polygons)
Principle: Assigns unknown points to the nearest known value.
Best For: Categorizing regions.
👍 Pro: Simple and fast.
👎 Con: Produces abrupt changes between zones.
7. 📐 Radial Basis Functions (RBF)
Principle: Uses flexible mathematical functions to interpolate values.
Best For: Complex, non-linear data.
👍 Pro: Produces very smooth surfaces.
👎 Con: Computationally intensive.
🤔 CHOOSING THE RIGHT TECHNIQUE:
🌿 Smooth and Gradual Data? Use IDW or Spline.
📏 Statistical Accuracy? Use Kriging.
⚖️ Irregular Data? Use Natural Neighbor or RBF.
📊 Categorization or Sharp Boundaries? Use Nearest Neighbor
A Project Manager’s Book of Forms is designed to be a companion to A Guide to the Project Management Body of Knowledge (PMBOK ® Guide) – Sixth Edition. The purpose is to present the information from the PMBOK ® Guide – Sixth Edition in a set of forms so that project managers can readily apply the concepts and practices described in the PMBOK ® Guide to their projects. The PMBOK ® Guide identifi es that subset of the project management body of knowledge generally recognized as good practice. It does not describe how to apply those practices, nor does it provide a vehicle for transferring that knowledge into practice. This Book of Forms will assist project managers in applying information presented in the PMBOK ® Guide to project documentation. The Book of Forms does not teach project management concepts or describe how to apply project management techniques. Textbooks and classes can fulfi ll those needs. This book provides an easy way to apply good practices to projects.
Source: Saeed Baqader
The talk will discuss the basic principles of National Instrument 43-101, the Canadian Disclosure Standards for Mineral Projects. This will include some of the ways regulation is done and some of the most common problems people have when making disclosure. The talk will also cover the securities regulatory environment for mining disclosure, some comparisons to S-K 1300, JORC and global developments and some new information about the modernizing of National Instrument 43-101. Questions are most welcome.
By Victoria Yehl, M.Sc., P.Geo
Mining companies love to tell big stories, but investors want more than just promises.
NI 43-101 makes sure mining companies lay everything on the table, giving investors a clear view of what’s actually going on. It forces companies to back up their bold claims with hard data.
This all started after the Bre-X scandal in the ‘90s, when a company claimed they’d found a massive gold deposit in Indonesia. Stock prices soared, and investors piled in, thinking they were onto a sure thing. But it turned out to be a complete fabrication. The market tanked, and people lost everything. To stop something like that from happening again, Canadian regulators introduced NI 43-101, a rule that says any public information about a mining project has to be verified and based on solid facts, not hype.
=> What NI 43-101 reports are (and what they’re not)?
NI 43-101 reports sum up the technical and scientific info investors need to see. These reports aren’t meant to drown people in data but to give them a clear, straightforward view of a company’s findings.
If a company drills 40 holes, investors don’t want to sift through every little detail. NI 43-101 makes sure companies give the highlights—the stuff that matters, like the quality and quantity of the minerals found.
The investor only wants to know what the actual results of the drilling are. You’re getting the key points, not the raw, unfiltered data. But don’t confuse these reports with full feasibility studies—they aren’t a deep dive into every aspect of the project. NI 43-101 reports are designed to give you just enough to make informed decisions without being overwhelmed.
=> When do mining companies need an NI 43-101 report?
Mining companies have to file an NI 43-101 report in a few key situations:
- when they first get listed on a Canadian exchange,
- when they release major assessments like PEAs or Feasibility Studies, or
- when something big changes, like new drilling data that alters their resource estimates.
This rule isn’t just for Canadian companies either. Many mining companies around the world use NI 43-101 standards to build investor trust because it’s become the gold standard for disclosure.
=> Who prepares NI 43-101 reports?
These reports must be written or approved by a Qualified Person (QP)—someone who knows what they’re doing. For smaller, junior mining companies, the report has to be prepared by an independent QP to make sure there’s no bias. These juniors depend on that independence to win investor confidence. Bigger companies don’t always need an independent QP unless something significant happens, like finding a new mineral zone or buying a new property. In some cases, in-house QPs can handle it, but if a major change happens, independence becomes key.
=> When does an NI 43-101 report become invalid?
Here’s something important—NI 43-101 reports don’t have an expiration date, but they can become outdated if things change. Maybe commodity prices shift, or new drilling data comes in, changing the outlook of the project. When that happens, the company needs to update the report. Sometimes the stock exchange steps in and says, “You need to give us fresh numbers.” It’s about keeping everything current and making sure investors are getting the most accurate data.
=> Why NI 43-101 matters for investors?
NI 43-101 is a tool that makes sure investors know what they’re dealing with. It protects them from inflated numbers and empty promises. Without it, companies could talk up their projects all day long, and investors would have no way of knowing what’s real.
NI 43-101 keeps mining companies accountable and builds trust with investors. It’s the line that separates the hype from the facts, and in the mining world, that’s everything.
Only 38% of employees get weekly 1-on-1s,
but those who do are 300% more engaged! (Gallup)
The secret? Transformative 1-on-1 meetings.
Studies show that regular, meaningful 1-on-1s can:
- Increase employee performance by up to 39%
- Reduce burnout by 43%
- Boost engagement scores by 67%
But here's the catch: Not all 1-on-1s are created equal.
The difference lies in the questions you ask.
That's why I've created a comprehensive guide with 101 powerful questions to transform your 1-on-1s into performance-boosting powerhouses.
🎯 Here's what makes these questions different:
• Tailored to unlock hidden potential
• Designed to align personal goals with company vision
• Crafted to inspire innovation at every level
🔍 Sneak peek of what you'll discover:
1. Mind-opening ice breakers
2. Deep-dive performance boosters
3. Career-accelerating visioning questions
4. Innovation-sparking challenges
5. Trust-building reflection prompts
Don't let your 1-on-1s be part of the 62% that fall flat.
Junior Mining Network (a publication of Gold Royalties LLC) provides users with an innovative platform that features up-to-the-minute press releases, detailed intraday market data and free stock quotes for nearly 2,000 publicly traded resource sector stocks, ranging from micro-cap junior exploration to large-cap mining companies.
Did you know?
A recent survey from IRS revealed that 40% of SMEs incur penalties due to incorrect payroll filing.
This underscores the critical importance of accurate payroll reporting not just for compliance but as a strategic business practice.
🔑 Why Payroll Reporting Matters:
It's more than just issuing paychecks! Effective payroll reporting encompasses understanding and managing labour costs, ensuring compliance, and utilising data for strategic decisions.
It's about gaining insights into one of your biggest expenses and optimising for efficiency and strategic growth.
📊 Key Components:
1️⃣ Earnings and Deductions: Understand each element that contributes to net pay.
2️⃣ Tax Obligations: Stay on top of varying tax rates and regulations.
3️⃣ Benefit Contributions: Monitor employer and employee contributions to benefits.
4️⃣ Time and Attendance: Align actual hours worked with payroll data.
🚀 Strategic Insights:
✅ Budgeting and Forecasting: Use payroll data to make informed budget and growth plans.
✅ Operational Efficiency: Identify trends to streamline processes and enhance productivity.
✅ Compliance: Ensure adherence to tax laws and labour regulations across different jurisdictions.
🛠️ Best Practices:
➡️ Automate where possible to reduce errors.
➡️ Regularly update your knowledge of regulations.
➡️ Choose a reliable payroll system or outsourcing partner for seamless integration.
With the right approach, payroll reporting becomes more than a routine task—it's a strategic asset for sustainable growth.
Did you know?
A staggering 29% of startups fail due to a cash crisis, with poor cost management being a major culprit.
It is essential for all business leaders to understand and implement effective cost-control strategies to survive.
❓ What is Cost Control?
Cost control is the process of managing and optimising your business expenses to maximise profitability without compromising on quality or growth potential.
🔑 Why Cost Control Matters:
Efficient cost management leads to a healthier cash flow, giving your business a robust defence against market fluctuations and economic uncertainties.
📊 Understanding Business Costs:
1️⃣ Fixed Costs:
These are the costs that don't fluctuate with business activity. Think of rent or full-time salaries.
2️⃣ Variable Costs:
Costs like raw materials or commission-based salaries vary with production volume.
3️⃣ Semi-Variable Costs:
A mix of both fixed and variable, like some utility bills.
4️⃣ Direct Costs:
Directly linked to production, such as raw materials or direct labour.
5️⃣ Indirect Costs:
Necessary but not directly tied to production, like maintenance and administrative expenses.
📈 Best Practices in Cost Control:
✅ Regularly perform variance analysis to keep budgets aligned with spending.
✅ Review your Cost of Goods Sold (COGS) to identify savings in material or production processes.
✅ Consider strategic outsourcing, especially for complex, non-core tasks (e.g. Accounting, Payroll, Tax etc.)
✅ Employ continuous improvement techniques to boost efficiency and cut waste.
🚀 Strategic Value of Cost Control:
📍Financial Stability: Solid cost control is the backbone of a healthy cash flow.
📍Profit Maximisation: Cutting unnecessary expenses directly fattens the bottom line.
📍Budget Adherence: Sticking to your budget prevents financial indiscipline and cost overruns.
📍Investment in Growth: The savings from cost control can be channelled into growth and innovation.
Empower your financial decision-making with robust Cost Control strategies.
It's not just about cutting costs—it's about making every dollar work towards your business's scalability and market leadership.
With only 8 days to go until the Paris2024 Olympic Games kick off, we're excited to introduce our latest publication: 30 Things: Sports Edition. This book showcases the crucial role minerals and metals play in the sports we love.
From the nickel and aluminium in the Olympic torch to the glimmering gold and sparkling silver in the medals presented to the athletes - it all starts with minerals.
Whether you're diving into the pool 🏊, racing down the track 🚴, or reaching for gold, the Australian minerals industry is behind you every step of the way.
Best of luck to our Aussie Olympians!
Source: https://minerals.org.au/
The demand outlook for minerals and metals has undergone the biggest shift in history as the world transitions to net zero emissions by 2050. Global demand for critical minerals has doubled over the past five years to $320 billion driven by the growth of clean energy technologies and EVs.
By 2030, 120 new lithium, nickel and cobalt mines will be needed to supply the materials required to meet demand for battery storage. And much of the estimated 6.5 billion tonnes of end use materials required up to 2050 will be steel, copper and aluminium. This makes the minerals and raw materials produced by resource-rich countries increasingly critical over coming decades.
It also presents an unprecedented opportunity for Australia. A Minerals-plus investment strategy that encourages more discoveries, reactivation of mothballed mines, expansion of existing mines and development of new mines, can place Australia at the forefront of global decarbonisation e«orts.
Source: https://minera.ls/minplus
After a few requests from colleagues interested in the reconciliation topic, I've combined all my posts into one PDF (to download it go to full screen and you will see a download button there). Please find it attached. I hope you find it useful, and thank you again for your interest in mining geology 😉
--
Aleksandr Mitrofanov
linkedin.com/in/aleksandr-mitrofanov-phd-pgeo-9473ba6a
Back to the Basics - 04: Dilution management in surface mines
We move the dirt to extract ore that pays to all.
Mining is a business run through engineering and both should be economically sound. From the operational viewpoint, dilution management is the primary task to maximise the profit of the mine. The document explains various strategies and technologies to mitigate dilution in open-pit mining. I hope this document helps you understand both traditional and recent technologies in dilution management.
Source: Credit to Hyondoo Tom JANG, Hanwha Mining Services
Below is a huge list of Excel keyboard shortcuts you can use to work faster. Scroll through the list or use the Index to quickly go to the section you want.
How To Read The List
Where shortcut keys must be pressed together they will be shown like this
Ctrl + P
which means press CTRL and P together.
Where keys must be pressed one after the other they will be shown like this
Alt + H , A C
which means press Alt and H together, then release those keys and press A, then C.
Source: Mohamed Elhanbaly
In mineral resource estimation, particularly when employing block models for resource estimation, ordinary kriging (OK) is a widely used geostatistical interpolation method. However, while kriging is powerful in providing unbiased estimates, it comes with an inherent smoothing effect that must be understood, especially when the cutoff grade is high relative to the mean grade of the deposit.
=> Une méthode de conception du tableau de bord en 5 étapes et 15 outils.
=> Les clés pour construire un tableau de bord avec Microsoft Excel en 5 temps et 15 fi ches pratiques. Toutes les versions Excel 2003, 2007, 2010 et 2013 sont prises en charge.
=> Tous les exemples, ainsi qu’un tableau de bord cadre complet, sont disponibles sur le site dédié de l’auteur (www.tableau-de-bord.org). Chaque chapitre est directement relié au site dédié : vous pourrez y consulter les compléments, les références (livres et sites) et les mises à jour.
La méthode proposée reprend les principes les plus récents de conception des tableaux de bord pour les adapter aux besoins des managers. Rapidité, simplicité et faible coût de réalisation en sont les priorités.
La première partie de cet ouvrage développe concrètement, avec exemples à l’appui, les phases fondamentales de la conception d’un tableau de bord e¬ cace : défi nition des axes de progrès, identifi cation des indicateurs clés, composition des écrans.
La seconde partie est orientée réalisation. Les fonctionnalités de Microsoft Excel nécessaires à la réalisation sont présentées et expliquées. Nul besoin d’être un expert, ce livre vous guide pas à pas pour réaliser votre tableau de bord de pilotage opérationnel.
Source: MAHDI B.
The potential we’re missing is enormous.
The cost to our goals is too high to ignore this.
We've all been there:
There's a lot that competes for our attention.
Days that feel scattered and unproductive.
Leaving us questioning our efficiency.
These days often become a blur.
Rather than clear, focused efforts.
Research shows that having a structured daily routine can boost productivity by 200%.
❓ Ready to turn things around?
Use my Productivity Checklist to see where you're currently at.
Then think about what you need to:
✅ Stop doing
✅ Start doing
✅ Do more of
✅ Do less of
❓Do you think this could help you and others?
Welcome to The Business English Vocabulary Builder.
Business idioms in English can be a confusing and intimidating territory even to the best language student, which is why a concise dictionary such as this one is such a useful and beneficial acquisition. Whenever you hear an unfamiliar phrase, you can check its definition within these pages, and reinforce the knowledge in your mind for the next time it pops up in conversation.
Within this book you’ll find hundreds of new ways to express yourself in every business situation that you can imagine! While some of the idioms in this book can be applied outside of a business context too, ALL of them can be used to improve your fluency and understanding when at work, and in other professional settings.
English is a rich and versatile language – we’ve provided at least one example for each idiom, but we recommend that you practice using them by forming your own examples and testing them in real conversations. Don’t be afraid of making mistakes in spoken English – that’s how we learn!
Nothing improves communication more than actually communicating, and this book will help you to become more comfortable and fluent in native and natural English-speaking situations, both inside and outside of the boardroom. Your confidence will build, leading you to feel more at ease and less overwhelmed.
As you use this book, you’ll notice some phrases highlighted in bold throughout the explanations on each page. These are other idioms and useful phrases for a business environment. If the meaning of the phrase is unclear, then you will be able to check its definition in the appropriate place in the book. We have alphabetized the whole book – over two hundred idioms in total! This makes it easier for you to find the right place when looking for a specific meaning.
Idioms, phrasal verbs, and other English terms and phrases are often described as being the most difficult aspect of the language to grasp. With this book, we’ve swapped difficulty with interesting facts! Where possible, we’ve tried to give you some linguistic knowledge on the roots of the idioms and phrases discussed. Sometimes, understanding something at a deeper level can help with knowledge retention.
Some tips before you get started:
• Use each new phrase as soon as possible – practice makes perfect!
• Keep this book in your bag – you’ll want it close at hand in times of need!
• Don’t be afraid of making mistakes – you’re on a learning curve!
So, what are you waiting for?
Delve into the interesting world of English phrases that don’t mean what they seem and become the fluent language student that you were born to be!
Source: Mohamed Elhanbaly
1. GPS Data Collection:
During a drone flight, the UAV is equipped with a Global Navigation Satellite System (GNSS), which includes GPS receivers to capture positioning data.
The GPS receivers record the drone's coordinates and other relevant information during the entire flight.
2. In-Flight Kinematics:
The drone's flight dynamics, including its position, orientation, and velocity, are continuously recorded by the onboard sensors.
3. Post-Processing:
After the drone completes its mission, the collected GNSS data and in-flight kinematics data are downloaded to a computer for post-processing.
Specialized software is used to precisely synchronize the GPS data with the in-flight kinematics data.
4. Base Station Corrections:
PPK often involves the use of a ground-based reference station with known coordinates as a base station.
The corrections from the base station are applied to the drone's GNSS data, compensating for errors introduced by factors such as atmospheric conditions and satellite signal delays.
5. Centimeter-Level Accuracy:
By post-processing the data and incorporating corrections, PPK achieves significantly higher accuracy compared to real-time kinematics (RTK) methods.
The resulting drone survey data can reach centimeter-level accuracy in terms of spatial positioning.
6. Reduced Reliance on Real-Time Corrections:
Unlike Real-Time Kinematics (RTK), which requires continuous communication with a base station during the flight, PPK eliminates the need for real-time corrections. This allows for more flexibility in flight planning and remote location mapping.
7. Applications:
PPK is widely used in applications such as photogrammetry, surveying, mapping, and precision agriculture.
It enhances the accuracy and reliability of geospatial data collected by drones, making it invaluable for industries that demand high-precision mapping.
In summary, the PPK method is a powerful technique that enhances the accuracy of drone mapping by carefully post-processing GNSS data, correcting for errors, and achieving centimeter-level precision in the final geospatial outputs.
Image: heliguy.com
The valuation of a mine can make or break its future.
But understanding the key methods for valuing assets isn’t always simple. That’s why we’re breaking it down—plain and simple.
Here are the top mining asset valuation methods you should know:
Net Present Value (NPV)
Discounted Cash Flow (DCF)
Internal Rate of Return (IRR)
Decoupled Net Present Value (DNPV)
Real Options Valuation (ROV)
=> A Noisy Dashboard Makes for a Silent Strategy
With so much data at our fingertips and endless analytics tools at our disposal, it can be easy to become overwhelmed and paralyzed by the sheer volume of information. Businesses are constantly being told that they need to measure their performance, but when everything becomes a KPI, the actionable insights become lost in the noise. Instead of moving forward with confidence, companies often freeze, unsure of where to focus their attention. Too many metrics lead to confusion, not clarity, making it difficult to stay on track.
We’ve probably all heard the expression (often wrongly attributed to Peter Drucker), “If you can't measure it, you can't manage it.” While there’s truth in that statement, the reality is far more complex. What you choose to measure will dictate your focus, your resources, and ultimately, your success.
Here are the five biggest mistakes companies make when selecting KPIs and, more importantly, specific tips to avoid falling into these traps.
1. Measuring What’s Easy, Not What’s Important
The Problem: Raise your hand if you’ve ever picked a KPI because it was easy to track. Don’t worry, you’re not alone. Many businesses fall into the trap of measuring what’s convenient instead of what’s critical. Just because you have mountains of data at your fingertips doesn’t mean it’s all worth tracking. For example, tracking website visits? Fun. But is it telling you how engaged your audience really is?
Tips:
Start with Objectives, Not Data: Begin by defining your strategic goals and then work backward to determine what data you need. Don’t let the availability of data dictate what you measure.
Focus on Actionable Metrics: Ask yourself, “If this metric changes, can we take action based on it?” If the answer is no, it’s not a useful KPI.
Limit KPIs to Key Priorities: Focus on a few high-impact KPIs that are directly aligned with your business goals, rather than trying to track everything. The fewer KPIs you have, the more focused and actionable your strategy will be.
Test for Impact: Before fully adopting a new KPI, run a pilot to see if it drives valuable insights. If not, discard it and try another.
2. Getting Too Cozy with Lagging Indicators
The Problem: We all love a good success story, but when it comes to KPIs, focusing only on what’s already happened—those lagging indicators—makes you a bit of a historian. While it’s nice to know your revenue last quarter, wouldn’t you rather know how you’re shaping up for the next one? Lagging indicators are safe and cozy because they give you clear results, but they also lull you into a false sense of security.
Tips:
Incorporate Leading Indicators: Use a mix of leading and lagging indicators. Leading indicators, such as customer engagement or sales pipeline metrics, give you insights into future performance and can help you make proactive adjustments.
Balance Short-Term and Long-Term: Select leading indicators that can inform immediate actions (like the number of sales calls made) as well as long-term results (like customer retention or product development milestones).
Track Trends, Not Just Snapshots: Set up tools that allow you to monitor trends in leading indicators over time. This will help you anticipate changes and respond before lagging indicators signal trouble.
Automate Alerts: Implement tools that notify you when leading indicators deviate from expected patterns, allowing for quicker course corrections.
3. KPIs: Disconnected from Reality (and Strategy)
The Problem: Have you ever been on a road trip with no destination in mind? That’s what happens when your KPIs don’t align with your business strategy. You’re measuring things, sure, but none of them are helping you get closer to where you want to be. When KPIs aren’t tied to what the business is trying to achieve, you risk losing focus and wasting resources on activities that don’t contribute to long-term success.
Tips:
Tie Every KPI to a Goal: Every KPI should be explicitly linked to a business objective. For example, if the goal is to increase customer loyalty, a useful KPI might be the Net Promoter Score (NPS). If a KPI doesn’t support a goal, it doesn’t belong on your dashboard.
Use Strategic Mapping: Develop a strategy map that clearly links KPIs at different levels of the organization to the overarching business strategy. This ensures alignment from the executive level down to individual teams.
Regularly Review Alignment: Set up quarterly or annual reviews to ensure that your KPIs still align with evolving business objectives. As strategies change, your KPIs should evolve to reflect new priorities.
Communicate the “Why” to Teams: Make sure that everyone in your organization understands how their KPIs connect to the broader strategy. This alignment fosters accountability and ensures that everyone is moving in the same direction.
4. Turning KPIs Into Personal Incentive Traps
The Problem: There’s nothing wrong with rewarding employees for hitting KPIs, but when KPIs become too linked to personal incentives, things can get messy. People start gaming the system. When a KPI becomes the sole focus because it’s tied to a bonus or reward, it often misses the bigger picture and may even encourage counterproductive behavior.
Tips:
Use a Balanced Scorecard: Include a variety of KPIs in performance evaluations to ensure that no single metric dominates. For example, balance financial metrics with customer satisfaction and operational efficiency.
Incorporate Qualitative Metrics: Pair quantitative KPIs with qualitative feedback to ensure that employees are incentivized to think about the bigger picture. For example, sales teams might be measured on both revenue and customer feedback to ensure a balanced approach.
Avoid Short-Term Focus: Design KPIs and incentives that encourage long-term thinking. For instance, incentivize customer retention or product quality rather than just quarterly revenue numbers.
Monitor for Unintended Consequences: Regularly assess whether the incentive structures are leading to gaming of the system or other counterproductive behaviors. If so, adjust the KPI mix to better reflect holistic success.
5. Letting KPIs Go Stale
The Problem: KPIs are not set-and-forget metrics. Yet, many companies treat them like family heirlooms, never to be touched or adjusted. But just like that ancient fruitcake Aunt Martha sends every Christmas, KPIs can go stale if they’re not regularly revisited and refreshed. Business evolves, markets change, and so should your KPIs.
Tips:
Schedule Regular KPI Reviews: Set up a recurring schedule to review your KPIs—at least once a year, but ideally quarterly. During these reviews, assess whether each KPI is still providing value and relevance to your current strategy.
Use Feedback Loops: Solicit feedback from teams on the ground to identify whether KPIs are still driving the right actions. Teams working directly with the data will have insights into which metrics are useful and which have become outdated.
Replace or Refresh Outdated KPIs: Don’t hesitate to drop KPIs that no longer serve a purpose. Replace them with new metrics that better reflect your current objectives and market conditions.
Adjust Targets as Necessary: KPIs often start as educated guesses. As more data becomes available, recalibrate targets to ensure they are both challenging and realistic, reflecting current business circumstances.
=> Final Thoughts: Cut the Noise, Amplify the Strategy
KPIs are there to guide you, but too many, or the wrong ones, are just static on the line. If your dashboard is crammed with meaningless metrics, it’s time for a refresh. Less is more when it comes to KPIs. Prioritize simplicity, relevance, and actionability.
The right KPIs won’t just measure success—they’ll help drive it. So, clear the noise, focus on the signals that matter and let your strategy sing.
Source: https://www.jeffwinterinsights.com/insights/dashboard-overload
DEPRECIATION 🚗 🤖 🏭
An accounting method used to allocate the cost of tangible assets (such as buildings. machinery, and vehicles) over their useful lives. It represents the systematic reduction in the value of an asset due to wear and tear, obsolescence, or other factors.
Depreciation happens to TANGIBLE Assets (you CAN touch them)
Examples:
→Car 🚘
→Equipment 🤖
→Buildings 🏭
3 DEPRECIATION METHODS
1️⃣ STRAIGHT - LINE
The most common and easiest method to calculate depreciation. To use this method of depreciation, you need to divide the cost of an asset by the useful life of an asset (in years).
🔎 FORMULA: Cost / Useful Life
2️⃣ DECLINING BALANCE
Used to calculate large depreciation expenses or assets that quickly lose value. Multiply the opening book value by the depreciation rate.
🔎 FORMULA: Opening book value x (100% / Useful Life of asset)
3️⃣ SUM OF THE YEARS DIGITS
An accelerated depreciation method makes the expense higher in the early years and lower in the latter years. Multiply the cost of an asset by its useful life over the sum of the years digits.
🔎 FORMULA: Cots x ( Useful life / Sum of the Years digits)
See the infographic for examples!
Follow Brian Feroldi for more content like this.
The mining industry, one of the cornerstones of modern civilization, is undergoing a transformative shift as it embraces the power of Artificial Intelligence (AI). This revolutionary technology is poised to revolutionize every aspect of the mining sector, from exploration and extraction to supply chain optimization and worker safety. In this comprehensive introduction, we will delve into the profound impact of AI on the mining industry, uncovering the challenges, opportunities, and cutting-edge applications that are shaping the future of this vital sector.
Source : Ali Abou El fadl Mohamed
Make yourself 2x more productive in Excel
100 shortcuts ranked from Basic, Intermediate, Advanced, and Underrated
Like, Bookmark this and Share it.
Thousands of hours will be saved!
You want the High Resolution PDF?
👉 Here is the link: https://lnkd.in/eYYzweAi
If you think you know well Excel, I bet you will still learn something new in the Advanced table (items 51 to 75).
What do we cover?
A list of essential Excel shortcuts for professionals.
Here is a preview:
🟠 Basic
1. How to copy text?
Ctrl + C
2. How to cut text?
Ctrl + X
3. How to paste?
Ctrl + V
4. How to undo?
Ctrl + Z
5. How to redo?
Shift + F11
(get the answers 6-25 in the Cheat Sheet below)
⚪ Intermediate
26. How to autosum?
Alt + =
27. How to fill down?
Ctrl + D
28. How to fill right?
Ctrl + R
29. How to do flash fill?
Ctrl + E
30. How to insert hyperlink?
Ctrl + K
(get the answers 31-50 in the Cheat Sheet below)
⚫ Advanced
51. How to show / hide ribbon?
Ctrl + F1
52. How to create custom view?
Alt + W + C
53. How to paste special (values only)?
Ctrl + Alt + V > V
54. How to change font format?
Ctrl + Shift + F
55. How to goal seek?
Alt + A + W + G
(get the answers 56-75 in the Cheat Sheet below)
🔵 Underrated
76. How to move to the next open workbook window?
Ctrl + F6
77. How to move to the previous open workbook window?
Ctrl + Shift + F6
78. How to insert current date and time?
Ctrl + Shift + :
79. How to paste values & formatting only?
Ctrl + Alt + V > T
80. How to apply or remove cell wrap?
Alt + H + W
(get the answers 81-100 in the Cheat Sheet below)
Source : Nicolas Boucher, LinkedIn
www.nicolasboucher.online
Your company may have a haul road/pit design
manual – use it if it exists.
For those that do not have a design manual, or only have
limited guidelines, then this article may help you in the
process of designing your first pit.
Source: https://www.deswik.com/wp-content/uploads/2018/03/Guidelines-Considerations-for-Open-Pit-Design.pdf
This pdf teaches you the core of accounting
Here's what you'll learn:
• The Accounting Equation
• Debits and Credits
• Accounting Cycle
• T-Account
• Journal Entry
• General Ledger
• Adjusting Entries
• And much more!
Source : https://compounding-quality.ck.page/1f650114df
Copper is one of the most versatile and essential metals in today’s world. With applications ranging from electrical wiring to renewable energy infrastructure, its demand remains robust.
Some important highlights for the copper mining industry during 2023:
=> Chile remains as the world copper leader producer.
=> DRC became the second world largest copper producer for 2023, displacing Peru from the location it held for many years.
=> New projects that started in the previous years have increased their copper production for 2023 obtaining strong copper production marks. Among these we have Quellaveco (Peru) and Kamoa-Kalula (DRC).
=> The shutdown of the Cobre Panama mine, the tenth biggest copper mine for 2023, located in Panama.
Refined copper consumption will be supported by demand from sectors linked to the energy transition. Some of its uses are listed below:
=> To help connect batteries to electric vehicle (EV) powertrains
=> For use in electric motors in the EV charging infrastructure
=> Solar energy and wind power applications
World copper demand is expected to grow at a steady rate of 1.5% per year. Therefore, to catch up with these estimated requirements, new mines are required to be developed. There are several world-class copper deposits around the world like: Pebble, Resolution, Udokan, Reko Diq, La Granja, Tampakan, El Pachon, Los Azules, Taca Taca, Cascabel, Baimskaya, Vizcachitas, Michiquillay, Rio Blanco, Galore Creek, among others.
✨1. Choose the Right Drone:
Select a drone with high-precision GNSS receivers and a well-calibrated inertial measurement unit (IMU). Ensure the drone's specifications align with the desired mapping accuracy.
✨2. Use High-Resolution Cameras:
Opt for cameras with high-resolution sensors to capture detailed imagery. Higher resolution allows for better feature identification and measurement accuracy in the resulting maps.
✨3. Implement Ground Control Points (GCPs):
Strategically place GCPs across the survey area to georeference the drone data. GCPs serve as ground truth points and significantly enhance spatial accuracy.
✨4. RTK/PPK GPS Technology:
Utilize Real-Time Kinematic (RTK) or Post-Processing Kinematic (PPK) GPS technology. These systems provide centimeter-level accuracy, especially when used in conjunction with high-precision base stations.
✨5. Plan for Overlapping Imagery:
Plan drone flight paths to ensure sufficient overlap between images. Overlapping imagery aids in accurate image stitching and 3D reconstruction.
✨6. Consider Ground Sampling Distance (GSD):
Adjust the drone altitude to achieve an appropriate Ground Sampling Distance (GSD). A smaller GSD allows for higher-resolution data and improved mapping accuracy.
✨7. Control Environmental Conditions:
Fly the drone under optimal weather conditions to minimize distortions. Avoid mapping during adverse weather, strong winds, or extreme temperatures that could affect data quality.
✨8. Calibrate Sensors Regularly:
Regularly calibrate the drone's sensors, including the camera and IMU. Calibration ensures accurate data collection and minimizes errors in the mapping process.
✨9. Leverage Drone Software:
Use specialized drone mapping software that supports accurate georeferencing, image stitching, and generation of 3D models. These tools streamline data processing and enhance mapping precision.
✨10. Conduct Checkpoint Analysis:
Include checkpoints in your survey area to assess the accuracy of the mapping results. Checkpoint analysis provides valuable feedback on the reliability of your drone data.
✨11. Post-Processing of GPS Data:
If using PPK, conduct post-processing of GPS data to further refine the accuracy of the drone's positioning information.
✨12. Regular Training and Monitoring:
Train drone operators on best practices for mapping accuracy and regularly monitor and assess the quality of the collected data. Ongoing training and quality control are key to maintaining high standards.
✨13. Stay Informed about Regulations:
Stay updated on local regulations regarding drone operations. Compliance with regulations ensures safe and legal drone mapping activities.
By combining these strategies and paying attention to each aspect of the drone mapping workflow, you can significantly enhance the accuracy of your mapping data, making it suitable for a wide range.
Image credit: propelleraero.com
🎯Accuracy means how close a map is to the real world. It's about having good data and finding mistakes in a group of information. In GIS data, accuracy can talk about where things are (like a place on a map), or it can talk about details and ideas.
🎯Precision is about being very exact when describing information. But even if we're really careful with details, precision doesn't always mean everything is right. Sometimes, mistakes by a surveyor or errors when saving data can make things not accurate. It's like a balancing act we need to be aware of.
Image credit: yellowscan.com
A business is considered "asset-heavy" when it requires substantial investment in capital such as factories, machinery, and processing plants to generate revenue. In contrast, "asset-light" businesses have minimal need for such investments.
I analyzed the financials of the top 40 companies in mining—the ultimate asset-heavy industry—and compared them to a selection of popular asset-light companies. So, what can we learn?
In asset-heavy businesses like mining, a significant portion of revenue goes toward keeping core operations running (cost of revenue). This includes running machinery, processing plants, and ensuring the continuous flow of products. On the other hand, companies like Google and Facebook require far fewer resources to keep their product (well…ads) going.
However, the trade-off for asset-light companies is the need for large bureaucracies of administrators, salespeople, and engineers to stay competitive. As a result, their administrative and general expenses, including R&D, are substantial.
Not surprisingly, asset-heavy companies like miners face high depreciation and amortization costs as they must pay off the mines, exploration projects, and equipment essential to their operations.
At the end of the day, successful asset-light companies often capture more profit than their asset-heavy counterparts. What might interest investors even more is the return on capital invested. Asset-light companies, the successful ones anyway, tend to generate a very high return on assets thanks to the relatively small amount of capital they deploy.
So why would anyone invest in mining or other asset-heavy industries? Here are my top three reasons:
1. A barrier to entry: The high capital requirements in asset-heavy industries create a significant barrier to entry, effectively protecting against competition. Building and operating a mine is an enormous undertaking, while a tech startup could be created in a dorm room. This makes asset-heavy industries less prone to disruption.
2. Reliable demand: A mining company producing copper, gold, or iron is almost guaranteed to find a market for its products. The likelihood of a sudden and large drop in global demand is low. By contrast, asset-light companies face the constant risk of rapid disruption, which can jeopardize revenue streams. Mining companies, therefore, tend to enjoy more stable revenue.
3. Cost flexibility: Cost of revenue is often highly variable, meaning it can be adjusted in response to demand fluctuations. For example, a mining company can scale back operations or even put a mine on "care and maintenance" with minimal costs if times are bad. Asset-light companies, however, must manage slower-moving fixed costs, such as engineering teams and attractive office space, which makes it harder to quickly adapt when demand declines. Instead, they must absorb losses or seek additional capital to stay afloat.
By ZVENIA Mining: in mining, and especially in reserve calculation, we are always confronted with the challenge of accurately forecasting costs. Proper estimation of these costs is crucial to ensuring the feasibility and profitability of projects, as any deviation can significantly impact decision-making and long-term planning.
Article by Bojan Radojicic:
𝗧𝗥𝗘𝗡𝗗 𝗔𝗡𝗔𝗟𝗬𝗦𝗜𝗦
Involves examining historical data to identify patterns or trends over time. Simple, cost-effective, but may not account for unexpected changes.
𝗧𝗜𝗠𝗘 𝗦𝗘𝗥𝗜𝗘𝗦 𝗔𝗡𝗔𝗟𝗬𝗦𝗜𝗦
Analyzing a sequence of data at specific time intervals. The primary goal is to identify one-offs, seasonal variations, and cycles to forecast future values.
𝗦𝗘𝗔𝗦𝗢𝗡𝗔𝗟 𝗗𝗘𝗖𝗢𝗠𝗣𝗢𝗦𝗜𝗧𝗜𝗢𝗡
Breaks down time series data into seasonal, trend, and residual components. Suitable for data with strong seasonal patterns.
𝗘𝗫𝗣𝗘𝗥𝗧 𝗝𝗨𝗗𝗚𝗠𝗘𝗡𝗧
Using insights, intuition, and experience of individuals or groups with deep knowledge in a specific area to forecast future events or trends.
𝗘𝗫𝗣𝗢𝗡𝗘𝗡𝗧𝗜𝗔𝗟 𝗦𝗠𝗢𝗢𝗧𝗛𝗜𝗡𝗚
A weighted moving average method where more recent data points have a higher influence. Effective for short-term.
𝗥𝗘𝗚𝗥𝗘𝗦𝗦𝗜𝗢𝗡
It models the relationship between a dependent variable and one or more independent variables. Used when a relationship between variables is suspected.
𝗠𝗢𝗡𝗧𝗘 𝗖𝗔𝗥𝗟𝗢 𝗦𝗜𝗠𝗨𝗟𝗔𝗧𝗜𝗢𝗡
A probabilistic forecasting technique that uses random sampling to simulate a range of possible outcomes. Ideal for assessing risk and uncertainty.
𝗠𝗢𝗩𝗜𝗡𝗚 𝗔𝗩𝗘𝗥𝗔𝗚𝗘𝗦
This method smooths out fluctuations in data by averaging past data points over a specific period. Ideal for short-term forecasting.
𝗠𝗔𝗖𝗛𝗜𝗡𝗘 𝗟𝗘𝗔𝗥𝗡𝗜𝗡𝗚
Uses algorithms that learn from data to predict future outcomes. Can identify non-linear relationships and complex patterns.
𝗛𝗜𝗦𝗧𝗢𝗥𝗜𝗖𝗔𝗟 𝗚𝗥𝗢𝗪𝗧𝗛 𝗥𝗔𝗧𝗘𝗦
Involve using the growth rate of a particular variable (e.g., revenue, sales, market size) from past periods as a basis for forecasting future growth.
The JORC Code Exposure Draft is currently out for consultation. A key area for consideration since last update in 2012 is the role of Modifying Factors.
Modifying Factors can impact project viability and profitability. Factors such as cultural heritage clearance, land access (e.g. Native Title), approvals, local content considerations, the Global Standard on Tailings Management, decarbonisation targets, climate resilience disclosures, sovereign risk and political instability have gained recognition as material considerations.
Check out a recent AusIMM article to learn more around the crucial role of Modifying Factors in resource disclosure and project deliverability.
China, with its huge manufacturing sector, is by far the biggest consumer of copper.
Currently, 70% of copper used in China is imported. As a result, the country has invested heavily in copper mines to secure future supply.
This graphic uses exclusive data from our partner, Benchmark Mineral Intelligence, to compare copper output from the top three global producers with Chinese miners. Since some of the mining operations have shared ownership, this graphic takes into consideration only the portion of production relative to the company’s stake in each mine.
Chinese Miners Set to Overtake Major Producers by 2025
In 2010, Chinese miners produced a total of 1.2 million tonnes of copper. In that same year, the top producer, Chilean state miner Codelco, produced 1.8 million tonnes, while the world’s largest miner and second-largest copper producer, BHP, produced 1 million tonnes.
Over the years, however, Chinese output has surged while major miners have faced challenges. In 2023, Codelco’s production fell to its lowest level in a quarter of a century due to operational problems and project delays.
🇨🇳 China
🌐 Rest of World
Year/millions of tonnes Zijin CMOC MMG Tongling Other China BHP Freeport Codelco
2010 0.059 0.000 0.001 0.007 1.090 1.021 0.979 1.760
2011 0.061 0.000 0.001 0.006 0.956 0.959 0.959 1.796
2012 0.082 0.000 0.046 0.007 1.070 1.070 0.975 1.805
2013 0.104 0.003 0.184 0.007 1.530 1.129 1.046 1.791
2014 0.116 0.014 0.149 0.007 1.753 1.126 1.074 1.841
2015 0.126 0.040 0.199 0.007 1.810 1.085 1.230 1.891
2016 0.134 0.047 0.374 0.007 1.984 1.023 1.388 1.827
2017 0.178 0.155 0.422 0.011 1.978 0.995 1.222 1.842
2018 0.212 0.127 0.383 0.019 1.967 1.161 1.239 1.807
2019 0.299 0.140 0.315 0.031 2.046 1.197 1.104 1.706
2020 0.377 0.173 0.272 0.066 2.290 1.147 1.081 1.727
2021 0.518 0.192 0.235 0.093 2.378 1.068 1.328 1.728
2022 0.750 0.226 0.214 0.123 2.440 1.180 1.327 1.553
2023F 0.828 0.329 0.236 0.134 2.298 1.283 1.302 1.442
2024F 0.886 0.460 0.301 0.121 2.421 1.423 1.421 1.414
2025F 0.980 0.467 0.309 0.158 2.441 1.471 1.342 1.531
2026F 1.031 0.467 0.332 0.206 2.477 1.513 1.369 1.591
2027F 1.036 0.568 0.332 0.255 2.467 1.383 1.345 1.600
2028F 1.058 0.698 0.332 0.255 2.467 1.186 1.286 1.580
Meanwhile, China’s biggest copper producer, Zijin Mining, saw its production rise from 0.059 million tonnes in 2010 to 0.8 million tonnes last year.
Combined, Chinese companies produced 3.2 million tonnes of copper in 2023, compared to the combined production of 4 million tonnes by Codelco, Freeport-McMoRan (the biggest copper producer in the U.S.), and BHP.
According to Benchmark Mineral Intelligence data, Chinese miners are forecasted to surpass the three top producers in 2025, with a combined production of 4.4 million tonnes compared to 4.3 million tonnes from Codelco, BHP, and Freeport.
𝗣𝗿𝗼𝗰𝘂𝗿𝗲𝗺𝗲𝗻𝘁 𝗣𝗿𝗼𝘀: 𝗔𝗿𝗲 𝗬𝗼𝘂𝗿 𝗠𝗲𝘁𝗿𝗶𝗰𝘀 𝗧𝗲𝗹𝗹𝗶𝗻𝗴 𝘁𝗵𝗲 𝗙𝘂𝗹𝗹 𝗦𝘁𝗼𝗿𝘆? 📊
Ever feel like you're drowning in data, but still thirsty for insights? Procurement is a numbers game, but it's not just about crunching them – it's about understanding what they mean for your bottom line and strategic goals.
That's why I've put together this handy cheatsheet carousel, breaking down the essential metrics across different procurement categories:
𝗖𝗔𝗣𝗘𝗫 𝗣𝗿𝗼𝗰𝘂𝗿𝗲𝗺𝗲𝗻𝘁: Uncover the hidden costs beyond the price tag.
𝗣𝗿𝗼𝗰𝘂𝗿𝗲𝗺𝗲𝗻𝘁 𝗳𝗼𝗿 𝗣𝗿𝗼𝗷𝗲𝗰𝘁𝘀: Keep your projects on track and under budget.
𝗗𝗶𝗿𝗲𝗰𝘁 𝗠𝗮𝘁𝗲𝗿𝗶𝗮𝗹𝘀 𝗣𝗿𝗼𝗰𝘂𝗿𝗲𝗺𝗲𝗻𝘁: Optimize your supply chain for efficiency and cost savings.
𝗣𝗿𝗼𝗰𝘂𝗿𝗲𝗺𝗲𝗻𝘁 𝗳𝗼𝗿 𝗠𝗲𝗿𝗰𝗵𝗮𝗻𝗱𝗶𝘀𝗶𝗻𝗴: Balance inventory, demand, and profitability.
𝗦𝗲𝗿𝘃𝗶𝗰𝗲𝘀 𝗣𝗿𝗼𝗰𝘂𝗿𝗲𝗺𝗲𝗻𝘁: Measure the true value and cost of your service providers.
𝗟𝗼𝗴𝗶𝘀𝘁𝗶𝗰𝘀 𝗮𝗻𝗱 𝗧𝗿𝗮𝗻𝘀𝗽𝗼𝗿𝘁𝗮𝘁𝗶𝗼𝗻: Track your shipments and control your freight costs.
𝗠𝗲𝘁𝗿𝗶𝗰𝘀 𝗮𝗿𝗲 𝗷𝘂𝘀𝘁 𝘁𝗵𝗲 𝗯𝗲𝗴𝗶𝗻𝗻𝗶𝗻𝗴. 𝗧𝗵𝗲 𝗿𝗲𝗮𝗹 𝗺𝗮𝗴𝗶𝗰 𝗵𝗮𝗽𝗽𝗲𝗻𝘀 𝘄𝗵𝗲𝗻 𝘆𝗼𝘂 𝘂𝘀𝗲 𝘁𝗵𝗲𝗺 𝘁𝗼 𝗱𝗿𝗶𝘃𝗲 𝗱𝗲𝗰𝗶𝘀𝗶𝗼𝗻𝘀, 𝗻𝗲𝗴𝗼𝘁𝗶𝗮𝘁𝗲 𝗯𝗲𝘁𝘁𝗲𝗿 𝗱𝗲𝗮𝗹𝘀, 𝗮𝗻𝗱 𝗯𝘂𝗶𝗹𝗱 𝘀𝘁𝗿𝗼𝗻𝗴𝗲𝗿 𝘀𝘂𝗽𝗽𝗹𝗶𝗲𝗿 𝗿𝗲𝗹𝗮𝘁𝗶𝗼𝗻𝘀𝗵𝗶𝗽𝘀.
Me complace compartir con ustedes un artículo sobre la Gestión de Cierre de Minas en el Perú, elaborado como parte del Programa de Especialización en "Gestión Integral de Planes de Cierre" de la Escuela de Postgrado GERENS.
Espero que lo encuentren interesante y valioso. Agradezco de antemano sus comentarios😊
In this ebook, we describe simple, yet crucial, techniques to help you clean your data effectively. In case you wish to apply this learning in the future, we have incorporated a number of examples and exercises to give you hands-on learning. All you need is Microsoft Excel (versions 2007 or above). Don’t worry if you are unfamiliar with Excel — each chapter will teach you everything you need to know.
Source: Mitesh Bhatt
Have you ever been part of a professional "meeting culture," sometimes described as an "overly 'meeting-centric' culture"? You know, where decreased productivity, inefficiency, and low morale reign supreme.
Everyone experiences 'meeting fatigue' and complains about going to too many meetings. Still, holding and managing effective meetings is a significant responsibility and a large part of every leader's job.
In his 2004 book, "Death by Meeting," Patrick Lencioni emphasizes the importance of structuring and conducting meetings "to align with the organization's goals, encouraging productive communication and decision-making, rather than letting meetings become time-wasting ordeals."
His approach emphasizes the importance of structure, purpose, and team dynamics in making meetings more effective. By implementing these principles, leaders can transform meetings from time-wasting events into valuable tools for communication, decision-making, and problem-solving within their organizations.
Here's how you can hold better meetings as a leader:
1) Always Define the Purpose. By clearly articulating the purpose of each meeting, you ensure that everyone understands why the meeting is necessary and what its expected outcomes are.
2) Create a Compelling Agenda. Having a well-structured agenda that outlines the topics to discuss and the time allocated to each, focuses us on critical issues and avoids unnecessary one-off conversations that can distract us from what we need to do.
3) Utilize Different Meeting Types. Choose among daily check-ins, to weekly team meetings, monthly individual progress meetings, and quarterly off-sites. Varying your meeting types lets people know it's OK to meet differently and still be able to accomplish work objectives.
4) Be Ruthless in Your Management of Time. Priorities get accomplished when sticking to a scheduled agenda, starting and ending on time, and allocating the most time to the most critical issues.
5) Encourage Healthy Conflict. When we create an environment where open debate and creative friction occur more frequently, we help team members feel comfortable expressing their opinions and engaging in challenging conversations.
6) Focus on Results. Every discussion, decision, and action becomes vital when they're outcome-driven. We accomplish this by clarifying and documenting agreed-upon actions at the close of each meeting.
And the best meeting recommendation of all?
Lead by example. As a leader, set the tone for all meetings by being punctual, engaged, and committed to the meeting process, reinforcing their purpose and importance in executing organizational priorities.
Meetings are necessary for our business success and should be considered a helpful tool and resource for leaders to lead their people with; they don't have to suck.
As a leader, you must take ownership of everything that happens in your meetings.
Why not start today?
Source: Credits to Meetingsift & Monte Pedersen
Hod Lipson, Columbia University professor and award-winning robotics researcher, shares with Dr Anna the one item he can’t live without - his Graphics Processing Unit (GPU).
The conversation reveals how much GPUs underpin our electronic world, and how one somewhat unsung element - boron - is at the heart of making them work.
Our Chief Executive Minerals Sinead Kaufman unpicks what boron is, how it’s extracted, and what needs to be done to keep us having the electronic devices so many of us rely on.
We also look at how AI might have a role to play in the future of mining, why boron is “the WD-40 of the world” and what’s being done to help sustainability by “robots eating robots”.
The World Steel Association (worldsteel) is a non-profit organisation with headquarters in Brussels, Belgium. A second office in Beijing, China, opened in April 2006.
worldsteel is one of the largest and most dynamic industry associations in the world, with members in every major steel-producing country. worldsteel represents steel producers, national and regional steel industry associations, and steel research institutes. Members represent around 85% of global steel production.
It was founded as the International Iron and Steel Institute on 10 July 1967. It changed its name to the World Steel Association on 6 October 2008. The association celebrated its 50th anniversary in 2017.
This was originally posted on our Voronoi app. Download the app for free on iOS or Android and discover incredible data-driven charts from a variety of trusted sources.
Silver is one of the world’s most precious metals, holding an important position as a tradeable commodity and an essential part of many industrial processes and necessary technologies such as the next-generation photovoltaics helping power the transition to clean energy.
So, for this graphic, we used data from the Silver Institute’s World Silver Survey 2024 to rank the top silver-producing companies of 2023.
Who Produces the Most Silver in 2023?
In 2023, silver mining companies collectively produced 831 million ounces of silver with the top 20 companies contributing 43% of that total—371 million ounces.
Here’s how this breaks down on a per-company basis:
Rank Company HQ Country Region Production (Moz)
1 Fresnillo 🇲🇽 Mexico N. America 54
2 KGHM Polska Miedź 🇵🇱 Poland Europe 46
3 Hindustan Zinc Ltd 🇮🇳 India Asia 24
4 Pan American Silver 🇨🇦 Canada N. America 20
5 Glencore 🇨🇦 Canada N. America 20
6 CODELCO 🇨🇱 Chile S. America 19
7 Industrias Peñoles 🇲🇽 Mexico N. America 19
8 Southern Copper 🇺🇸 U.S. N. America 18
9 Newmont 🇺🇸 U.S. N. America 18
10 Solidcore Resources* 🇰🇿 Kazakhstan Asia 18
11 Volcan Cia Minera 🇵🇪 Peru S. America 15
12 Hecla Mining 🇺🇸 U.S. N. America 14
13 South32 🇦🇺 Australia Oceania 13
14 BHP 🇨🇦 Canada N. America 12
15 Boliden 🇸🇪 Sweden Europe 10
16 Nexa Resources 🇱🇺 Luxembourg Europe 10
17 Coeur Mining 🇺🇸 U.S. N. America 10
18 First Majestic Silver 🇨🇦 Canada N. America 10
19 SSR Mining 🇺🇸 U.S. N. America 10
20 Hochschild Mining 🇵🇪 Peru S. America 10
Grand Total 371
*Polymetal Intl. changed its name to Solidcore Resources following an acquisition in June 2024
North America is home to 11 of the world’s top 20 silver mining companies, including Mexican company Fresnillo, which produced the most silver last year, at 54 million ounces.
Silver Industry Trends
Global production of silver dropped by 1% between 2022 and 2023, mainly driven by industry events that disrupted production, impacting several key silver-producing nations.
For example, between Q2 and Q3 of 2023, industrial action saw the suspension of the Newmont Peñasquito mine, and Argentina, as a whole, produced a lower grade of silver than expected in 2023.
However, many companies in smaller silver producers, such as Chile, have partially offset this loss through increased production.
Silver in 2024
Despite the challenges, there is hope for a potential production recovery from Mexican and U.S. mines in 2024. However, The Silver Institute expects total output from silver mining companies to fall by less than 1% again in 2024, with forecasts predicting an output of approximately 824 million ounces.
This expected production fall can be attributed to a drop in local production in Peru, where many productive mines have been temporarily closed.
The data for this visualization was sourced from the World Silver Survey 2024, a publication by one of our data partners, The Silver Institute. Our data partnerships are commercial agreements that may or may not include compensation, and partners are not involved with our editorial or graphical processes in any capacity.
Source: visualcapitalist
EN: In the month of mining, the Fundacion Minera de Chile wanted to spread these educational graphics about the everyday things that mining makes possible in your life.
ES: En el mes de la minería, la Fundacion Minera de Chile ha querido difundir estas gráficas educativas respecto a las cosas cotidianas que la minería hace posible en tu vida.
Source: Francisco Javier Lecaros M.
September 22 to 26, 2025, in Arequipa, Peru.
PERUMIN, the most important mining convention in Latin America, is an event organized by the Peruvian Institute of Mining Engineers, which enables the meeting of multiple national and international actors to analyze the latest developments in mining, involve the industry with the socioeconomic reality of the country and strengthen links between mining companies, suppliers, civil organizations, multilateral agencies, national and regional authorities, academia, among others.
Under the slogan "Building together a greater Peru", PERUMIN 37 stands as a platform for consensus between the State, the private sector and citizens to discuss and agree on mechanisms for sustainable territorial development for a more equitable, modern, organized and transparent country. And for the sake of this determination, to evaluate the most pressing demands and coordinate actions to meet them.
Thus, this great mining meeting will put under the spotlight the role of mining as a leading industry in the application of first-class technologies, compliance with environmental protection standards and, mainly, its contribution to the progress of the nation and the welfare of the population.
PERUMIN 37th Mining Convention has an attractive agenda of activities in line with the reality of our mining industry and the country’s context, involving the participation of representatives of world-class companies, investors, foreign authorities, representatives of multilateral organizations, etc. All of this, consolidated in the programs of the Mining Summit, the Technology, Innovation and Sustainability Forum (TIS Forum), Extemin, the International Meeting, PERUMIN Hub, PERUMIN Inspira, among others.
With all this, we ratify our commitment to the mining industry, which has become the spearhead of Peru's progress over the last 30 years, our country thus receiving the admiration and praise of the entire world.
You are all welcome!
Darío Zegarra
President of the Peruvian Institute of Mining Engineers
Source: https://perumin.com/perumin37/public/en
This results in billions of hours lost.
Let me help you avoid this.
Sharing meeting tips from top entrepreneurs:
1. Elon Musk: Be Super Prepared
Ensure thorough preparation for meetings.
Be ready to answer any follow-up questions.
Maintain high standards and efficiency.
2. Steve Jobs: Keep Meetings Small
Limit the number of attendees.
Remove unnecessary participants.
Enhance simplicity and productivity.
3. Larry Page: Immediate Decision-Making
Make decisions without waiting for meetings.
Designate a decision-maker for every meeting.
Increase agility and reduce delays.
4. Satya Nadella: Long Leadership Meetings
Hold extended weekly leadership meetings.
Use performance dashboards to align efforts across units.
Ensure alignment and coordination among senior leaders.
5. Ben Horowitz: One-to-One Meetings
Hold structured one-on-one meetings.
Employee sets the agenda; manager listens 90% of the time.
Encourage upward communication and idea sharing.
6. Marissa Mayer: Aggressive Vetting
Thoroughly vet ideas during meetings.
Ask detailed questions about research and methodology.
Ensure well-thought-out proposals.
7. Alfred Sloan: Follow-Up Memos
Send follow-up memos post-meeting.
Summarize discussions, set deadlines, and assign accountability.
Ensure clarity and action post-meeting.
8. Sheryl Sandberg: Strict Agendas
Use a strict agenda with action items.
Cross off items one by one; end the meeting early if the agenda is completed.
Keep meetings focused and concise.
Remember this advice:
Make sure your meetings are never wasted.
P.S. What do your meetings look like?
I am thrilled to announce the release of the guideline I developed, "Initial Project Evaluation Manual for the Mining Industry"! 🎉 This guide is designed to try to assist both new and existing players in the mining sector in conducting preliminary evaluations for investment decisions regarding mining projects.
Why This Manual?
Mining is a cornerstone of our global push towards sustainability, green energy, and net-zero initiatives. With critical minerals becoming increasingly essential in our daily lives, it is more important than ever to develop the mining industry efficiently and responsibly.
What’s Inside?
🔍 Step-by-Step Guidance: From resource and reserve quality to market conditions, regulatory frameworks, community relationships, and economic viability, this manual covers all key aspects of initial project evaluation.
📊 Informed Decision-Making: Learn how to quickly determine whether a project warrants further inspection or due diligence, saving you valuable time and resources.
🌍 Global Insights: Drawing from my extensive experience across Africa, Latin America, the Caribbean, Europe, and North America, this manual incorporates lessons learned from both successful projects and those with room for improvement.
🤖 Efficiency and Innovation: By integrating traditional wisdom with innovative tools, this manual helps you navigate the complexities of the mining industry effectively.
Key Benefits:
✅ Assess the economic potential and viability of mining projects
✅ Identify critical risks and challenges early
✅ Align project opportunities with your strategic objectives
✅ Make informed decisions to optimize resource allocation
Who Is It For?
Whether you are an industry veteran or a newcomer, this manual is designed to be user-friendly and accessible. It demystifies mining concepts, ensuring that more people from diverse backgrounds can contribute to the industry's growth.
Feel free to reach out if you have any questions or need further information. Let’s make informed, impactful decisions in the mining sector!
Esta colección de “CHARLAS DE CINCO MINUTOS” representan algunas de las cosas que el Supervisor puede presentar a su personal para adelantar campañas contra los accidentes laborales.
En estas charlas se han acentuado los aspectos de carácter general y de conducta personal de los trabajadores, porque consideramos que, a pesar de tratarse de asuntos y ocurrencias obvias, es conveniente recalcarlos en toda campaña de seguridad.
Además; se han seleccionado algunas con el propósito de ayudar a reducir los accidentes que ocurren en:
- El manejo de carga
- Caídas de las personas
- Maquinaria
- Herramientas manuales
- Electricidad
- Incendios
- Vehículos
- Manejo defensivo
- Bloqueo y señalización
Estas son las causas más importantes de accidentes y lesiones de trabajo, según la experiencia y para cumplir nuestro deseo de aumentar la defensa contra las que constituyen la mayor amenaza de lesión y daño que existe hoy en el trabajo.
No es necesario conservar el orden riguroso de estas charlas, sino que deben utilizarse de acuerdo con las necesidades que presente la realidad misma de la empresa y los oficios que se desempeñan, sirviéndose de la oportunidad para su mejor resultado.
Source: Martin Gamarra Estupiñan
Source: Credits to: Consejo Interamericano de Seguridad (CIAS)
Fundamental Analysis
Learn how to evaluate a business like a pro
• Introduction to Financial Analysis
• Financial Statements
• Financial Ratios
• Ratio Analysis
• Forecasting
• Budgeting
Source: Pieter Slegers
How does the saying go…Nothing is certain except death, taxes, and meetings?
We spend a lot of our life in meetings, so we might as well learn how to lead them well.
I’ve learned a lot about meetings over 25 years at Microsoft.
One thing that is special to callout is that I’ve only led remote teams, except for one year at Microsoft.
What that means is that I have a couple decades of mastering remote teams, remote work, and driving innovation around the world using hybrid teams, remote work, and asynchronous collaboration.
In this guide, you can learn some of the most effective ways to lead teams that change the world.
A team's success isn't just about their talent.
It also takes:
— Trust
— Safety
— Leadership
— Commitment
Every great team was once a group of individuals.
They didn't know much about each other.
They had to learn to trust each other.
They had to find common ground.
A great leader's job is to turn a group into a team.
Want a high-performing team?
14 tips to get them there:
1. Provide growth opportunities
2. Create a safe environment
3. Offer and seek feedback
4. Encourage collaboration
5. Set clear expectations
6. Encourage innovation
7. Communicate openly
8. Celebrate small wins
9. Admit your mistakes
10. Build connections
11. Recognize efforts
12. Lead by example
13. Show empathy
14. Be transparent
A high-performing team isn't built overnight.
But with strong leadership, it will happen.
Your team has the potential.
Unlock it.
This e-book teaches you everything you need to know
Here are my 5 favorite ratios as a teaser:
1️⃣ Gross margin (GM)
🎯 What?
Company's gross profit compared to its revenue
💡 Formula?
Sales - COGS / Sales
2️⃣ EBIT Margin
🎯What?
What percentage of sales remains as profit before tax and interest
💡 Formula?
EBIT / Sales
3️⃣ Debt-to-Assets
🎯What?
The total amount of debt a company has relative to its assets
💡 Formula?
Debt / Assets
4️⃣ Debt-to-Equity
🎯What?
Ratio used to calculate a company's financial leverage
💡Formula?
Debt / Equity
5️⃣ CAPEX/Sales
🎯What?
Measures the capital intensity of a company
💡 Formula?
Capital Expenditures / Sales
Source: Corporate Finance Institute
Understanding the nuanced differences between senior and junior mining companies is paramount for investors seeking to navigate the intricacies of the mining industry. While senior miners offer stability, dividends, and a diversified production base, juniors present the allure of exploration upside and the potential for explosive growth. Crafting a successful investment strategy often involves a balanced approach, with seniors providing stability and income, while juniors contribute the potential for significant capital appreciation. Investors should carefully assess their risk tolerance, investment goals, and market conditions when considering exposure to either or both segments of the mining industry.
You looking to improve your procurement process?
I made a detailed and simple-to-understand flowchart that outlines the end-to-end procurement process.
Source: Procurement Executives - Best in class
In Finance, we do a lot of analysis.
Most is built on statistics, but do you know statistics?
Here's a simple glossary of statistics that you can use to enrich the analysis you're doing...
It reminded me of an analysis I once did and probably the coolest time I used statistics in my career.
We had a situation where labor costs were increasing faster than we could increase the revenue in one of our major contracts.
However, we didn't have a good understanding of the relationship between the development in contract rates in the market and the development in labor costs.
As a result, we were not effective when negotiating contracts with our clients and our margins always ended up eroding over time.
To solve this and help inform the commercial team to make better pricing decisions, I did a correlation study between contract rates in the market and the development in the central labor index.
The results weren't too surprising but it was still cool to see how a correlation analysis could help device the best possible escalation clauses in a contract.
I found that in the short run there was little correlation between rates and labor costs but in the long run the correlation was high.
Knowing this we could now calculate the variance on the labor cost and suggest a quite exact multiplier we would need in the contracts for them to remain profitable over time.
The commercial team used these insights in ongoing negotiations for two new contracts and managed to secure an additional $5M in revenue.
Now if you thought statistics was boring all you need to do is re-read this example and take the simple glossary to heart!
How are you using statistics in your work?
Radiant uranium
While spot uranium prices have retreated back below the triple digit prices hit in January, the combined market cap of the sector is still up 42% from last year this time and together now surpasses that of the lithium counters in the ranking.
The world’s largest uranium producers – Cameco and Kazatomprom – only made the top 50 in 2021 with the Saskatoon-based company and state-owned Kazakh producer spending years in the wilderness post the Fukushima disaster in Japan.
None of the smaller uranium companies led by Canada’s Nexgen Energy, valued at a shade over $4 billion, is likely to make it into the top 50 by themselves, but combinations among the rank and file may well be in the offing as interest in the sector and mining M&A in general grows.
Kazatomprom dual-listed in London and Astana in 2018 and Uzbekistan is readying an IPO for Navoi Mining and Metallurgy Combinat – the world’s fourth largest gold mining company and significant uranium producer later this year.
Navoi would join the ranks of gold producers in the top 50 thanks to ownership of the world’s largest gold mine, Muruntau, and annual production of 2.9 million ounces at grades the envy of the sector. Navoi will also bring to five the number of companies with exposure to the nuclear fuel in the ranking.
Sources
Image: MiningVisuals
Text: Mining.com
This study investigates lead times from discovery to production for a unique data set of gold and copper discoveries worldwide during 1950–2014.
The study employs standard parametric and nonparametric duration analysis. The results suggest an important role for copper prices; for instance, an upswing at the time of discovery can hasten the development of the mine by two to three years in low-income countries. There appears to be a similarly beneficial impact on lead times of sounder macroeconomic policies and quality of governance.
Source: https://documents1.worldbank.org/
Tehmina Khan, Trang Nguyen, Franziska Ohnsorge and Richard Schodde
Most people think KPIs are just numbers.
But the truth is, KPIs drive success.
• We use them to guide decisions.
• We use them to measure progress.
• We use them to motivate teams.
• We use them to grow our businesses.
• We use them to achieve our goals.
So we can tell ourselves:
"KPIs don’t matter."
Or we can learn to use them effectively.
I’ve compiled "100 KPIs for Project Managers."
It’s packed with metrics to help you navigate your projects.
But it’s up to you to turn them into impact.
Master the tool we all rely on every day:
KPIs.
Sustainable profits create sustainable mines.
Mine is losing money?
It means it’s not accounting for all costs, including sustaining capital (SustEx).
Many mines only consider operating costs (OpEx) when setting cut-off grades.
This might make the deposit look larger and more profitable initially, but it’s misleading.
Using just OpEx ignores the ongoing capital expenses required to keep the mine running.
For example, when mines set a lower cut-off grade, they include lower-grade material, which reduces overall margins and cash flow. Imagine a mine with a total cost of $150 per tonne and a gold value of $50 per gram.
Setting a cut-off at 3 grams per tonne gives a decent margin if the average grade is 5 grams per tonne. But if 20% of the material is only 2 grams per tonne, the average grade drops, slashing margins and cash flow by 30%.
Mines that don’t include SustEx in their cost basis often find themselves in a cash flow crunch, unable to fund necessary environmental protections. In Central America, one mine lowered its cut-off so much that all operating profits went just to meet SustEx needs, breaking even with no returns for investors. This lack of funds also means they can’t afford proper environmental measures, leading to both financial and environmental failure.
Including all-in-sustaining costs (AISC) in financial planning ensures that only profitable material is mined, improving overall margins and cash flow.
This allows the mine to remain financially healthy and capable of funding environmental measures.
This approach aligns with economic and environmental sustainability, supporting both profitable operations and responsible mining practices.
It’s why the industry now sees AISC as the best practice for reserve estimation and life-of-mine planning.
Companies are made by people and the role of the CEO is quintessential.
If you are an investor, it's important to look at the CEO because they determine the future of the business for a big part. But how can you recognize a great CEO?
Here are 7 traits of exceptional CEOs:
1. Visionary: Sets a clear and overly ambitious goal. e.g. Matthew Prince at Cloudflare: "To make the internet better."
2. Communicator: Articulates ideas, strategies, and performance transparently for investors. e.g. Jeff Green at The Trade Desk.
3. Accountable: Takes responsibility for the company’s performance, good or bad. e.g. @Sundar Pichai after Google's demo blunders.
4. Adaptive: Responds effectively to industry changes and market disruptions. e.g. Mark Zuckerberg at Meta, reacting to TikTok with more video focus.
5. Stakeholder Oriented: Thinks of customers, employees, and shareholders, in that order. e.g. Jeff Bezos at Amazon.
6. Innovative: fosters a culture of innovation and invests in future growth. e.g. @Elon Musk at Tesla.
7. Planner: Prioritizes long-term success over short-term gains. e.g. Mark Leonard at Constellation Software Inc.
Amigo de la seguridad : ❞𝐓𝐞 𝐜𝐨𝐦𝐩𝐚𝐫𝐭𝐢𝐦𝐨𝐬 𝟓𝟒 𝐜𝐡𝐚𝐫𝐥𝐚𝐬 𝐝𝐞 𝐬𝐞𝐠𝐮𝐫𝐢𝐝𝐚𝐝❞
🚧🔍 ¡La seguridad empieza antes de comenzar! 🔍🚧
En cualquier entorno de trabajo, las charlas de seguridad antes del inicio de labores son esenciales. 🛠️💡 Estas sesiones no solo preparan a los trabajadores para enfrentar riesgos, sino que también fomentan una cultura de prevención y cuidado. 👷♂️👷♀️
¿Por qué son tan importantes? 🤔
1️⃣ Conciencia de riesgos: Identificamos y analizamos los peligros potenciales. ⚠️
2️⃣ Procedimientos claros: Todos conocen los pasos a seguir en caso de emergencia. 🚒
3️⃣ Prevención activa: Disminuimos accidentes y mejoramos la seguridad general. 📉
Gestión Integral HQSE 🇵🇪
Source: WILMER ARTURO PAREDES QUISPE
Stop disappointing your team by avoiding these 5 common mistakes:
❌ Canceling On Your Best People
I get it. We have more to do than hours in a day, so we triage to focus on what’s urgent. We know our best people have us covered, so we nudge their 1:1 to next week.
But nothing says “you’re not important” quite like removing the one meeting each week that’s about supporting them.
❌ Keeping Your Distance
Read the common wisdom about management, and it’ll steer you clear of personal topics. I’m sorry, this just isn’t human.
We spend more time with our teams than our families. Get to know your directs personally. It’s a prerequisite for caring.
❌ Getting Status Reports
If your entire meeting involves transmitting data that could have been an email, you’re doing it wrong.
Get them to maintain a dashboard that you can review before the meeting. Then, use the time to probe, coach, and support.
❌ Sitting Still
Want to raise the energy of this meeting? Change your environment:
– Meet up at a high-energy coffee shop.
– Hop up and start riffing on a whiteboard.
– Get outside and cover critical topics on a walk.
❌ Going Long
Parkinson’s Law states that work will fill the space you give it.
If your 1:1s feel drawn out, try cutting the time in half.
💡DEM (Digital Elevation Model):💡
A DEM is a digital representation of the Earth's surface that depicts the elevation of terrain features. It is typically represented as a grid, with each cell in the grid containing a value that represents the elevation at that location.
DEMs are widely used in various applications, such as geographic information systems (GIS), environmental modeling, and terrain analysis.
💡DTM (Digital Terrain Model):💡
A DTM is a specific type of DEM that represents the bare Earth's surface without any features like buildings, vegetation, or other structures. It provides a more accurate representation of the natural topography by filtering out cultural features.
DTMs are essential in applications like hydrology, landform analysis, and terrain modeling where the focus is on understanding the natural terrain without the influence of human-made structures.
💡DSM (Digital Surface Model):💡
A DSM represents the Earth's surface, including both the natural terrain and any overlying structures or vegetation. It includes all objects on the Earth's surface, such as buildings, trees, and other features.
DSMs are often used in urban planning, forestry, and other applications where a comprehensive understanding of the surface, including man-made structures and vegetation, is necessary.
💡DFM (Digital Feature Model):💡
DFM is a more general term that can encompass both natural and man-made features on the Earth's surface. It includes information about the elevation of terrain as well as the representation of specific features like buildings, roads, and other structures.
DFM is useful in applications where a comprehensive representation of the entire environment, including both natural and artificial features, is required.
In summary, DEM represents the elevation of the Earth's surface, DTM focuses on the bare natural terrain, DSM includes both natural and man-made features, and DFM is a broader term encompassing digital models of various features on the Earth's surface.
Image: researchgate.net
67,517 tU = 79,619 t U3O8
Operable = Connected to the grid.
Under Construction = First concrete for reactor poured.
Planned = Approvals, funding or commitment in place, mostly expected to be in operation within the next 15 years.
Proposed = Specific programme or site proposals; timing very uncertain.
Source: https://world-nuclear.org/information-library/facts-and-figures/world-nuclear-power-reactors-and-uranium-requireme#related-information
A free e-book teaching you everything you need to know
1. Business model
2. Capability of management
3. Sustainable competitive advantage
4. Attractiveness of the industry
5. Main risks
6. Balance sheet
7. Capital intensity
8. Capital allocation
9. Profitability
10. Historical growth
11. Usage of Stock-Based Compensation (SBCs)
12. Outlook
13. Valuation
14. Owner’s earnings
15. Historical value creation
El magazine internacional se imprime nuevamente 𝗲𝗻 𝗹𝗮 𝟭𝗿𝗮 𝘀𝗲𝗺𝗮𝗻𝗮 𝗱𝗲 𝗼𝗰𝘁𝘂𝗯𝗿𝗲 𝗰𝗼𝗻 la entrevista 2024 a 𝗡𝗶𝗰𝗸 𝗕𝗮𝗿𝘁𝗼𝗻, 𝘁𝗿𝗮𝗯𝗮𝗷𝗼𝘀 𝘁𝗲́𝗰𝗻𝗶𝗰𝗼𝘀 del Congreso TM2024 realizado del 3-5 de julio en Lima, 𝗽𝗿𝗼𝘆𝗲𝗰𝘁𝗼𝘀 𝗲𝗻 𝗔𝗿𝗴𝗲𝗻𝘁𝗶𝗻𝗮, 𝗖𝗼𝗹𝗼𝗺𝗯𝗶𝗮, 𝗖𝗵𝗶𝗹𝗲, 𝗣𝗲𝗿𝘂́, 𝗠𝗲́𝘅𝗶𝗰𝗼, y un especial de los eventos: XIX Seminario Andino de Túneles en Armenia y de las XIV Jornadas en Argentina.
Source:Elí Torres Lugo
99% of Procurement teams undersell their value.
Here's exactly how you should do it (with a template you can copy).
Every value analysis my teams create have just 3 sections:
1. Supplier Spend Analysis
2. Cost Savings Analysis
3. Value Beyond Savings Tracker
Each slide must then include:
1. KPIs your C-suite cares about
2. Visually impactful graphs & charts
3. Progress monitoring (YOY/ Month by Month)
Every single business, I follow those rules.
I don't always have fancy Procure Tech to do it (it helps if you do)
But I follow the above religiously.
Procurement value is all about relatability and clarity.
To grow your Procurement reputation you need both.
Don't overcomplicate, simplify instead.
Your Procurement Team's visibility will be 100x if you do.
Source: https://www.linkedin.com/feed/update/urn:li:activity:7235617737794818049/
Even under today’s policy settings, demand for critical minerals is set to continue rising strongly as energy transitions accelerate.
And though the market is currently well-supplied, continued vigilance is needed to avoid strains in the future
Source: Credits to International Energy Agency (IEA)
World Mineral Production covers the majority of economically important mineral commodities. For each commodity constant efforts are made to ensure that as many producing countries as possible are reported. For some commodities, where statistics on production are not publicly available, estimates are made. Users of this compilation are advised that more statistical information than can be included in a publication of this nature is held in the British Geological Survey files and is available for consultation. Historical data (from 1913 for many commodities) can be obtained from the predecessors to this series entitled World Mineral Statistics and the Statistical Summary of the Mineral Industry.
Copies of these publications are available in the World Archive section of the website: www.mineralsUK.com.
Source: www2.bgs.ac.uk/mineralsuk/statistics/worldStatistics.html
There are so many reasons you should be monitoring your haul roads why did we limit our discussion to 3? Simple, article length.
The three reasons we chose: 1. Constant Change, 2. Safety, 3. Compliance.
Empowering Human Intelligence with AI
Strayos AI for Mining
Source: Kimberly Sahu
This food hygiene inspection checklist allows you to evaluate if your employees maintain good personal hygiene and follow proper food preparation, handling, and storage procedures. You can use this checklist to:
- Verify the cleanliness of food rooms and equipment
- Inspect how food products are kept in storage areas
- Observe if employees follow proper food handling and personal hygiene practices
- Check if the premises are kept tidy and free from pests
- Confirm if all food hygiene checks are documented thoroughly and accurately.
Your data is only as good as your ability to understand and communicate it, which is why choosing the right visualization is essential.
If your data is misrepresented or presented ineffectively, key insights and understanding are lost, which hurts both your message and your reputation. The good news is that you don’t need a PhD in statistics to crack the data visualization code. This guide will walk you through the most common charts and visualizations, help you choose the right presentation for your data, and give you practical design tips and tricks to make sure you avoid rookie mistakes. It’s everything you need to help your data make a big impact.
In mining, resources estimations, finance, we do a lot of analysis.
Most is built on statistics, but do you know statistics?
Here's a simple glossary of statistics that you can use to enrich the analysis you're doing...
It reminded me of an analysis I once did and probably the coolest time I used statistics in my career.
We had a situation where labor costs were increasing faster than we could increase the revenue in one of our major contracts.
However, we didn't have a good understanding of the relationship between the development in contract rates in the market and the development in labor costs.
As a result, we were not effective when negotiating contracts with our clients and our margins always ended up eroding over time.
To solve this and help inform the commercial team to make better pricing decisions, I did a correlation study between contract rates in the market and the development in the central labor index.
The results weren't too surprising but it was still cool to see how a correlation analysis could help device the best possible escalation clauses in a contract.
I found that in the short run there was little correlation between rates and labor costs but in the long run the correlation was high.
Knowing this we could now calculate the variance on the labor cost and suggest a quite exact multiplier we would need in the contracts for them to remain profitable over time.
The commercial team used these insights in ongoing negotiations for two new contracts and managed to secure an additional $5M in revenue.
Now if you thought statistics was boring all you need to do is re-read this example and take the simple glossary to heart!
How are you using statistics in your work?
Welcome to the Draft JORC Code Survey, where JORC are asking for your feedback on the draft JORC Code (‘the draft Code’).
The JORC Committee has been updating the draft Code after feedback from the 2021 Survey, contribution from key stakeholders, input from JORC Code Review Working Groups and the Joint Competent Person Taskforce.
The draft JORC Code documents are now available, and the JORC Committee is seeking feedback from all stakeholders. The survey allows for responses to be tailored to those elements of the Code with which you have the most interaction, experience and interest and can be completed by both individuals and/or organisation entities. If your organisation submits a response we encourage you to submit an individual response as well.
This graphic shows global silver production in 2023, broken down by nation.
Key takeaways
831 million ounces of silver were mined globally in 2023.
Mexico was the world's top producer of silver at 24%.
The data for this visualization was sourced from the World Silver Survey 2024, a publication by one of our data partners, The Silver Institute. Our data partnerships are commercial agreements that may or may not include compensation, and partners are not involved with our editorial or graphical processes in any capacity.
Dataset
Top Silver Producing Nations 2023 (million ounces)
Rank Nation Region 2023 YoY % Change
1 Mexico N. America 202 -5%
2 China Asia 109 -2%
3 Peru S. America 107 0%
4 Chile S. America 52 24%
5 Bolivia S. America 43 10%
6 Poland Europe 43 0%
7 Russia Europe 40 -3%
8 Australia Oceania 34 -8%
9 United States N. America 32 -3%
10 Argentina S. America 26 -16%
11 India Asia 24 6%
12 Kazakhstan Asia 17 8%
13 Sweden Europe 13 -14%
14 Indonesia Asia 10 -1%
15 Morocco Africa 9 1%
16 Rest of World 71
Data sources
Figures rounded to the nearest whole number. CIS = Commonwealth of Independent States
https://www.silverinstitute.org/world-silver-survey-2024/
Tunnel failure catalogue is a valuable resource for engineers and anyone involved in tunnel construction case histories of tunnel failures around the world by studying these failures, engineers can learn from their mistakes and improve their own tunneling practices.
Source: Syed Shah
Source: Credits to Civil Engineering and Development Department
Are you struggling with messy data in Excel? 🤯 Don't worry, this guide will help you! 🛠️
In this carousel series, we'll unveil essential tools and techniques to tidy up your data and unleash its full potential for analysis and reporting.
Each slide has practical advice, from removing duplicates to handling text variations. 🚀 Let's dive in and transform your data chaos into clarity! 💡
If you like it, please save and share. Follow me for more content.
𝗘𝘅𝗰𝗲𝗹 𝗗𝗮𝘁𝗮 𝗖𝗹𝗲𝗮𝗻𝗶𝗻𝗴 𝗩𝗶𝗱𝗲𝗼:
https://youtu.be/EG1yJCLrUNY?si=RntuGwj6ESdq1XSu
𝗦𝘂𝗯𝘀𝗰𝗿𝗶𝗯𝗲 𝘁𝗼 𝗺𝘆 𝗬𝗼𝘂𝗧𝘂𝗯𝗲 𝗰𝗵𝗮𝗻𝗻𝗲𝗹:
How to Learn Excel:
The average mine lead time continues to trend upward, reaching 17.9 years for mines coming online in 2020–23 compared with 12.7 years for mines that started up 15 years ago.
In this update of our previous article studying the lead time of mines — the interval from discovery to production — we have included several mines that started in 2023 and backfilled information on mines that started earlier. This study includes gold, copper, nickel and lithium mines that have begun production since 2000.
All the main points that we presented in our previous study have held true in this iteration. It takes an average of approximately 16 years for a mine to go from discovery of a deposit to startup. Open-pit mines have a longer average lead time than underground mines due to the longer exploration and permitting phases. Nickel mines have the longest lead time due to a longer construction period, amplified by several mines discovered in the mid-1980s and 1990s when lower nickel prices may have caused tighter access to capital.
Our research confirms the industry belief that lead times are getting longer. The average lead time for mines from 2005 to 2009 was 12.7 years, which has grown steadily up to the present. From 2020 to 2023, the average lead time jumped to 17.9 years, fueled by a longer exploration, permitting and studies phase and a longer period between the end of feasibility studies and the start of construction, which can be attributed to time spent obtaining financing and construction permits.
An example is the Bystrinskoye copper mine in Russia, which took 32 years from its discovery in 1986 to its startup in 2018. The mine completed its feasibility study in 2011, but being a public-private partnership between PJSC Norilsk Nickel, Chinese investors and the Russian government, it encountered several delays in securing funds. The Celestial mine in the Philippines was discovered in 1993 but did not begin production until 2022. The project underwent several ownership changes over the years and was delayed by difficulties in accessing capital.
Source: S&P Global Market Intelligence
Paul Manalo
Because time is money and we know this too well in supply chain...
This infographics contains the top 10 ⏰ time supply chain metrics as follows:
✅ Metric #1 On Time Delivery
👉 Meaning: shows how many orders are delivered on time
🧮 Calculation: (Number of On Time Deliveries/ Total Number of Deliveries) X 100
✅ Metric #2 Lead Time
👉 Meaning: measures the average time from order placement to order delivery
🧮 Calculation: Delivery Date – Order Date
✅ Metric #3 Cycle Time
👉 Meaning: measures the average time that it takes to complete a product
🧮 Calculation: Net Production Time/ Number of Units Produced
✅ Metric #4 Takt Time
👉 Meaning: measures the rate by which a manufacturer must complete a product to meet customer demand
🧮 Calculation: Potential Production Hours/ Units Required (Customer Demand)
✅ Metric #5 Throughput Time
👉 Meaning: shows the time that it takes a product to move through processes
🧮 Calculation: (Processing time + Move time + Queue time)/ Number of Units Produced
✅ Metric #6 Warehouse Receiving Time
👉 Meaning: measures how efficient the goods receipt process is
🧮 Calculation: (Number of Items Received and Inspected)/ Total Time Taken
✅ Metric #7 Put-Away Time
👉 Meaning: shows how long it takes between an item’s arrival and its storage
🧮 Calculation: Total Time from Receiving to Storage/ Number of Items
✅ Metric #8 Pick Rate
👉 Meaning: measures how efficient the picking process is
🧮 Calculation: Number of Items Picked/ Total Number of Hours in Picking
✅ Metric #9 Machine Uptime
👉 Meaning: measures the time that a machine is available and operational
🧮 Calculation: (Time the Machine is Operational/ Time Observed) X 100
✅ Metric #10 Unplanned Downtime
👉 Meaning: shows the time that the asset is down due to an unexpected disruption or failure or process
🧮 Calculation: (Time Asset is Down due to Unexpected Event/ Total Time) X 100
What other metrics would you add?
I have had the opportunity to participate in many finance restructurings, define roles and responsibilities, and develop the required skill set for each role.
I am taking all those 20+ years of corporate experience and helping SMEs structure their finance teams with precise roles and responsibilities and the skills needed to perform duties.
Based on that, I have compiled a list of 10 entry-level accounting roles with the key responsibilities, skills, and qualifications required for each.
Whether you are a job seeker or a hiring manager, you will find the information helpful.
The most important part is the list of qualifications and certifications you can consider. I have done thorough research to save you hours of work. Capitalize on it!
Some of them are Canadian-focused, but you can always find an equivalent course within your region.
Would you like a similar guide for other finance roles? Let me know in the comments.
The following topics are covered in the guide:
➖ 10 Key Responsibilities
➖ Technical, Soft & Systems Skills
➖ Number of Years of Experience Required
➖ Potential Progression
➖ Qualification & Certifications including:
🔸 CMA and/or CPA Canadian & US Designation
🔸 Certified Bookkeeper offered by the Certified Professional Bookkeepers of Canada (CPB Canada) and the American Institute of Professional Bookkeepers
🔸 Certified Accounts Payable Professional offered by the Institute of Financial Operations & Leadership
🔸 Certified Credit Professional (CCP) offered by the Credit Institute of Canada.
🔸 Certified Receivables Compliance Professional offered by Receivables Management Association International.
🔸 Payroll Compliance Practitioner offered by the Canadian Payroll Association
Accounting Roles Included:
✅ Accounting Clerk
✅ Accountant Payables
✅ Accountant Receivables
✅ Bookkeeper
✅ Accountant Payroll
✅ Junior Accountant
✅ Financial Data Entry Specialist
✅ Billing Coordinator
✅ Expense Analyst
✅ Tax Assistant
What other roles can you add to the list?
70% of leaders fail to lead and are considered toxic:
They don't know how or want to leverage the power of a team.
They focus on themselves, and not others, but this is a failure of leadership.
Did you know that effective teamwork can:
• Boost productivity and revenue per employee by 30% (Foundr, 2023).
• Reduce Staff Turnover because collaborative work environments see a 30% lower staff turnover rate (Foundr, 2023).
• Experience Higher Job Satisfaction since employees in collaborative settings are over 50% more effective at completing tasks (UC Today, 2023).
• Increase profits by 29%; businesses with effective collaboration are 30% more innovative (DeskBird, 2023).
Let's become part of the 30% and focus on effective teamwork.
Outlined below are some key takeaways from prominent team models:
• Cultivate trust, accountability, and commitment within the team.
• Establish unambiguous goals, norms, and expectations from the outset.
• Provide ample support, resources, and foster a climate of support.
Reflecting on these models, which have you implemented, and do you have a favorite?
Creating a true orthophoto involves a series of steps to ensure that the resulting image provides a true top-down view, free from any perspective distortions, including the correction of terrain relief, camera angles, and building lean. Here's an overview of the process:
✅1-Aerial Image Acquisition:
Aerial imagery is captured using specialized cameras mounted on drones. These cameras capture images of the area of interest from different angles and altitudes(with 80% frontcoverage and 60% side coverage or more).
✅2-Image Preprocessing:
Raw images are preprocessed to correct for lens distortion, vignetting, and other optical aberrations. This step is crucial to ensure the accuracy of subsequent processing.
✅3-Photogrammetric Processing:
Photogrammetry is used to determine the spatial relationship between the images and the ground. This involves identifying common features in multiple images (tie points) and using these to calculate camera positions, orientations, and a point cloud representing the terrain.
✅4-Digital Surface Model (DSM) Generation:
A Digital Surface Model is created using the point cloud data, which represents the Earth's surface including buildings, vegetation, and terrain relief.
✅5-Digital Terrain Model (DTM) Generation:
The Digital Terrain Model represents the bare Earth surface without buildings and vegetation. It's derived from the DSM by filtering out structures and other above-ground features.
✅6-Orthorectification:
The orthorectification process corrects the image for relief displacement by using the DSM and DTM. Each pixel in the image is transformed to its true ground position, removing the effects of terrain and camera perspective.
✅7-Building Vectorization:
Using the orthorectified imagery and additional processing, buildings and other vertical features are detected and vectorized to create accurate building footprints.
✅8-True Orthophoto Generation:
The orthorectified imagery is further processed to create a seamless true orthophoto. This involves blending and combining the orthorectified images while ensuring that building facades and other vertical features are removed, resulting in a true top-down view.
✅9-Quality Assessment:
The final true orthophoto is rigorously evaluated for accuracy, completeness, and visual quality. Any remaining distortions or inaccuracies are addressed and corrected.
🔍Specialized software and expertise in photogrammetry, remote sensing, and geospatial analysis are critical for successfully creating high-quality true orthophotos. Additionally, accurate ground control points, precise camera calibration, and quality aerial imagery are essential components of this intricate process.
Work backwards. Always!
It has always worked for me to build a budget calendar.
I have helped three clients build their budget calendars this year alone. Two of them said they had never considered the process this way.
During my corporate career, I worked with a CFO who was super flexible how I did my work, but super strict with deadlines.
That's how I have been trained to prepare and adhere to deadlines.
You can do that too.
Your budget calendar may look different from mine, and that is okay.
By following this process, you will arrive at the calendar that fits your and your organization's needs.
Start by asking these questions and working backward:
Q1: When is the budget meeting for the Board's approval?
Q2: Do you need to present it first to the Executive Committee?
Q3: If yes, when is the Executive Committee meeting set?
Q4: How many days before your CFO wants to review the budget before the Executive Committee's meeting?
Q5: When does the CFO want to review the first draft?
Q6: How long do you need to consolidate the budget?
Q7: How long does the department typically take to complete the departmental budget?
Q8: How long do you need to prepare budget guidelines, assumptions, templates etc.?
Q9: How long do you need to plan for the budget
How do you prepare and plan for your budget?
1- Global Coordinate System: WGS84
Geographic Basis:
WGS84 (World Geodetic System 1984) is a three-dimensional geographic coordinate system that uses the Earth as a reference. It is based on a geodetic model that includes an ellipsoid, a mathematical model approximating the Earth's shape.
Definition:
Positions are defined using latitude and longitude relative to the WGS84 ellipsoid. Geographic lines represent angles between the location and the Earth's center, where positions are determined with geographic coordinates (Latitude, Longitude).
Applications:
This system serves as the foundation for position determination in the **Global Positioning System (GPS)**, and it is used in global mapping, navigation applications, and Geographic Information Systems (GIS).
2- Coordinate System: UTM
Geographic Basis:
UTM (Universal Transverse Mercator) is a two-dimensional metric coordinate system based on the Transverse Mercator projection. The Earth is divided into 60 longitudinal zones, each extending 6 degrees in longitude, and the Transverse Mercator projection transforms geographic locations into rectangular coordinates (X, Y) within each zone.
Definition:
In the UTM system, geographic coordinates (latitude and longitude) are converted into metric coordinates representing locations within a specified zone. The coordinates are expressed as Easting and Northing relative to a metric coordinate system for each zone.
Applications:
It is primarily used for applications requiring high accuracy over small to medium scales, such as detailed mapping, geographic surveying, and civil engineering planning.
3- Local Coordinate Systems
Geographic Basis:
A local coordinate system is any coordinate system tailored for a specific project or area. It can be metric or angular and may use a local reference framework.
Definition:
Positions in this system are defined based on a local reference frame specific to a location or project. This system can involve vector coordinates or specific projections for the site.
Applications:
It is used in applications requiring detailed project planning, such as building design, environmental monitoring systems, or civil engineering projects. It is useful for applications needing precise coordinates within a localized geographic area.
The reliability of project cost estimates at every stage in the project development process is necessary for responsible fiscal management. Reliable cost estimates result in effective programming and budgeting and will aid in staffing and budgeting decisions as well as effective use of department resources. Communication with decision makers on critical budget issues is also impacted by the quality of the estimate.
This guide provides instruction to design staff and project managers for a consistent approach to cost estimating. At the same time, it provides guidance on how to treat the common and recurring challenges encountered in the estimating process.
Source: Mitesh Bhatt
Source: Credits to IDAHO TRANSPORTATION DEPARTMENT
Underground Mining:
Mine Life:
- Underground mines typically last longer than open pit mines because they can access deeper ore deposits, have continuous orebodies at depth, and allow for selective mining of high-grade zones.
Mining Methods:
1. Room and Pillar Mining:
Leaving rooms while extracting ore pillars to support the roof. Common for coal and salt mining.
2. Longwall Mining:
Extracting long panels of coal or ore in a single slice. Efficient for coal and sedimentary deposits.
3. Cut and Fill Mining:
Mining horizontal slices of ore and filling voids with waste material. Suitable for irregular ore bodies.
4. Sublevel Caving:
Blasting ore to collapse under gravity into a collection point. Suitable for large, uniform ore bodies.
5. Block Caving:
Allowing ore to collapse under its weight. Suitable for large, low-grade ore bodies.
6. Shrinkage Stoping:
Mining horizontal slices with collapsing roofs. Suitable for narrow, steeply dipping ore bodies.
7. Room and Pillar with Retreat Mining:
Combining room and pillar mining with retreat mining to extract more ore.
Open Pit Mining:
Mine Life:
- Open pit mines generally have shorter mine lives due to high stripping ratios, infrastructure costs, and environmental regulations.
Mining Methods:
1. Bench Mining:
Developing in horizontal layers, progressing downwards.
2. Strip Mining:
Removing overburden to expose the ore body. Common for surface deposits.
3. Quarrying:
Extracting construction materials like limestone and granite by drilling and blasting.
4. Placer Mining:
Extracting minerals from loose sediments like sand and gravel, often for gold and platinum.
5. Heap Leaching:
Extracting metals from low-grade ore by applying a leaching solution.
6. Dredging:
Extracting minerals from underwater deposits using specialized equipment.
Which of these 12 methods will you focus on to motivate your team this week?
Original post below:
------
Motivating a team is challenging.
12 Proven Methods to Level Up Your Team: 🏆
1. 𝗦𝗲𝘁 𝗰𝗹𝗲𝗮𝗿 𝗴𝗼𝗮𝗹𝘀
➟ Don't be vague about the target.
2. 𝗣𝗿𝗼𝘃𝗶𝗱𝗲 𝗰𝗼𝗻𝘀𝘁𝗿𝘂𝗰𝘁𝗶𝘃𝗲 𝗳𝗲𝗲𝗱𝗯𝗮𝗰𝗸
➟ Avoid feedback that is not actionable or specific.
3. 𝗦𝗵𝗼𝘄 𝗮𝗽𝗽𝗿𝗲𝗰𝗶𝗮𝘁𝗶𝗼𝗻
➟ Remember to acknowledge their efforts.
4. 𝗦𝘂𝗽𝗽𝗼𝗿𝘁 𝗮 𝗽𝗼𝘀𝗶𝘁𝗶𝘃𝗲 𝗲𝗻𝘃𝗶𝗿𝗼𝗻𝗺𝗲𝗻𝘁
➟ Avoid creating a negative or stressful atmosphere.
5. 𝗟𝗲𝗮𝗱 𝗯𝘆 𝗲𝘅𝗮𝗺𝗽𝗹𝗲
➟ Don't behave in a way that contradicts your expectations.
6. 𝗘𝗻𝗰𝗼𝘂𝗿𝗮𝗴𝗲 𝗽𝗿𝗼𝗳𝗲𝘀𝘀𝗶𝗼𝗻𝗮𝗹 𝗱𝗲𝘃𝗲𝗹𝗼𝗽𝗺𝗲𝗻𝘁
➟ Don't neglect their career growth and learning opportunities.
7. 𝗜𝗻𝘃𝗼𝗹𝘃𝗲 𝘁𝗵𝗲𝗺 𝗶𝗻 𝗱𝗲𝗰𝗶𝘀𝗶𝗼𝗻𝘀
➟ Encourage and value their input.
8. 𝗣𝗿𝗼𝗺𝗼𝘁𝗲 𝘄𝗼𝗿𝗸-𝗹𝗶𝗳𝗲 𝗯𝗮𝗹𝗮𝗻𝗰𝗲
➟ Don't forget their need for personal time and rest.
9. 𝗕𝗲 𝘁𝗿𝗮𝗻𝘀𝗽𝗮𝗿𝗲𝗻𝘁
➟ Avoid holding relevant important information.
10. 𝗖𝗲𝗹𝗲𝗯𝗿𝗮𝘁𝗲 𝘀𝘂𝗰𝗰𝗲𝘀𝘀
➟ Remember to recognize and celebrate their achievements.
11. 𝗦𝗵𝗼𝘄 𝗲𝗺𝗽𝗮𝘁𝗵𝘆
➟ Avoid being dismissive of their feelings or struggles.
12. 𝗘𝗺𝗽𝗼𝘄𝗲𝗿 𝘁𝗵𝗲𝗺
➟ Don't micromanage or undermine their authority.
Published by Infographic Insights
#barbablaster
Underground mining carries several risks associated with blasting, which is essential for mineral extraction. Here are the five main risks:
1. Uncontrolled Explosions:
- Description: Explosions can get out of control, causing structural damage and endangering personnel.
- Mitigation: Rigorous design and execution procedures for blasting, along with the use of advanced technology to monitor the precision of explosive charges.
2. Release of Toxic Gases:
- Description: Blasting generates toxic gases such as carbon monoxide and nitrogen dioxide, which can be hazardous if not properly ventilated.
- Mitigation: Efficient ventilation systems and continuous monitoring of air quality.
3. Rockfalls:
- Description: Blasting can cause instability in the walls and roof of tunnels, leading to rockfalls.
- Mitigation: Constant inspection of rock stability and the use of support techniques such as rock bolts and wire mesh.
4. Vibrations and Noise:
- Description: Blasting-induced vibrations can affect the structural integrity of tunnels and nearby structures, as well as cause annoyance and damage to hearing.
- Mitigation: Monitoring vibrations and using controlled blasting techniques to keep them within safe limits.
5. Failure of Detonation Systems:
- Description: Malfunctions in the detonation system can cause misfires or unintended detonations.
- Mitigation: Use of highly reliable detonation systems and continuous training of personnel in the safe handling of these systems.
It is crucial to follow strict protocols and conduct regular audits to minimize these risks.
- DEC: Decline
- INC: Incline
- ACC: Access
- VD: Vent drive
- VRA: Vent rise access
- SP: Stock pile
- XC: Cross cut
- DDH: Diamond drill holes
- DDC: Diamond drill cuddy
- CMS: Cavity monitoring systems
- LHD: Bogger
- N, S, E, W: The directions (North, South, East, West)
- F/S: Front sight
- B/S: Back sight
- C/L: Center line
- G/L: Grade line
- LHW: Left hand wall
- RHW: Right hand wall
- COD: Change of direction
- COG: Change of gradient
- EOD: End of design
- EOW: End of week
- EOM: End of month
- R: Production Ring
- L: Laser of Production Ring
- UG: Underground
- ROM: Run of Mine
- MRE: Mineral Resource Estimate
- O: Ore
- W: Waste
- LOM: Life of Mine
- D&B: Drill and Blast
- UGD: Underground Development
- RC: Reverse Circulation
- PPE: Personal Protective Equipment
- HSE: Health, Safety, and Environment
- LHOS: Long Hole Open Stoping
En una detonación con explosivos se distinguen principalmente 3 zonas:
💣Primaria, que es el epicentro de la explosión y se considera una zona de muerte, pues en esta zona la probabilidad de vivir a una detonación es prácticamente nula.
💣Secundaria, es una zona en la que se produce la proyección de roca u objetos gran velocidad, dependiendo de la distancia de separación con la zona de detonación, podría haber la posibilidad de sobrevivencia. Pueden existir personas con heridas muy graves e inclusive muertos.
💣Terciaria, es la periferia de la explosión, zona en la que podrían existir heridos pero pueden trasladarse por sus propios medios.
La onda de la explosión es tan fuerte e intensa que puede desgarrar un tejido, una explosión menos intensa puede dañar los tímpanos, los pulmones y el abdomen.
Las medidas preventivas, entre otras, son las siguientes:
1️⃣ Determinar zonas seguras: Medir la distancia de seguridad alrededor de la zona de detonación (subterránea o superficial) y señalizar dichas distancias tanto para personas como para equipos.
2️⃣ Evacuación rápida: Desarrollar y practicar el plan de evacuación hacia las zonas seguras ya determinadas, controlar tiempos de evacuación y verificación del personal en dichas zonas.
3️⃣ Construcción de refugios resistentes: Si por las condiciones del ambiente de la mina, no fuese posible evacuar a las distancias medidas, se deben construir refugios y estructuras reforzadas que puedan soportar la onda expansiva y proteger a las personas en su interior.
4️⃣ Educación y entrenamiento: Capacitar a todo el personal sobre los riesgos y medidas preventivas con explosivos.
Hay que tener claro que los explosivos pueden detonar de acuerdo con el acróstico FISH por sus siglas en inglés:
🅵 = Friction = Fricción
🅸 = Impact = Impacto
🆂 = Static = Estática
🅷 = Heat = Calor
Geostatistics provides tools to model variables located in space (usually three dimensional) and takes advantage of their spatial structure (continuity) to improve the prediction at locations that have not been sampled and to characterize their spatial texture as a way to assess the uncertainty linked to the limited knowledge provided by the samples.
It is founded in statistical theory and shares many concepts and methods with statistical inference, pattern recognition and other related disciplines.
In this set of notes, we review the main concepts and try to provide both intuitive explanations to the different concepts and detailed implementation parameters and examples, to understand the mechanics to operate these techniques.
We will cover concepts related to probabilistic theory, statistical inference, spatial analysis, estimation and simulation. Further to these, we will explain some of the issues linked to constraining the models with geological knowledge, extending these theories to the case of multiple variables, expanding the notions of spatial continuity to pattern statistics, link with classical statistical methods and with machine learning and deep learning techniques.
1️⃣ Gross margin (GM)
🎯 What?
The company's gross profit compared to its revenue
💡 Formula?
Sales - COGS / Sales
2️⃣ EBIT Margin
🎯What?
What percentage of sales remains as profit before tax and interest
💡 Formula?
EBIT / Sales
3️⃣ Debt-to-Assets
🎯What?
The total amount of debt a company has relative to its assets
💡 Formula?
Debt / Assets
4️⃣ Debt-to-Equity
🎯What?
Ratio used to calculate a company's financial leverage
💡Formula?
Debt / Equity
5️⃣ CAPEX/Sales
🎯What?
Measures the capital intensity of a company
💡 Formula?
Capital Expenditures / Sales
6️⃣ Return On Equity (ROE)
🎯What?
Indicates how profitable a company is in relation to its equity
💡 Formula?
Net Income / Equity
7️⃣ Return On Invested Capital (ROIC)
🎯What?
Shows you how efficiently a company is allocating capital
💡 Formula?
NOPAT / Total Inv. Capital
8️⃣ Earnings Per Share (EPS)
🎯What?
How much money a company makes for each share outstanding
💡 Formula?
Net Income / Shares Outstanding
9️⃣ Free Cash Flow Realization
🎯What?
Measures how much earnings are translated into free cash flow
💡 Formula?
Free Cash Flow / Net Income
🔟 Price-to-Earnings Ratio (P/E)
🎯What?
Ratio that compares a company's share price to its earnings per share
💡Formula?
Price Per Share / Earnings Per Share
Which ratio would you add?
⚡A ventilation audit is a systematic, documented, periodic and productive evaluation of how well our system is working according to regulatory requirements and commitments. As a ventilation leader, we have to establish minimum requirements to protect persons underground from hazardous conditions specific to the mine.
⚡ I have extensive experience dealing with governmental audits related to ventilation mining operations. As a ventilation engineer, I have worked closely to ensure that all regulations were being followed according to mandatory standards. I strongly believe this helps us to compliance with legislative requirements and give us opportunity for improvement.
⚡One requirement consists on ventilation plans, which have to be updated at intervals not exceeding of six months (time depends on country regulatory), I recommend to have a monthly update showing location of fans, doors, directions and volumes of air flows: intake air – blue, exhaust air – red.
The Future of Global Coal Production Visualized
Coal is the world’s most affordable energy fuel, and as such, the world’s biggest commodity market for electricity generation.
Unfortunately, that low-cost energy comes at a high cost for the environment, with coal being the largest source of energy-related CO2 emissions.
Despite its large footprint, coal was in high demand in 2021. As economies reopened following the start of the COVID-19 pandemic, countries struggled to meet resurgent energy needs. As a readily available low-cost energy source, coal filled the supply gap, with global coal consumption increasing by 450 million tonnes or around +6% in 2021.
This graphic looks at the IEA’s coal production forecasts for 2024, and the specific countries projected to reduce or increase their production over the next few years.
Which Countries Are Increasing (or Reducing) Coal Production?
Global coal production was a topic of scrutiny at the COP26 conference held in November of 2021, where 40 countries pledged to stop issuing permits and direct government support for new coal-fired power plants.
However, many of the top coal-producing countries did not commit to the pledge. China, the U.S., India, Russia, and Australia abstained, and of those five, only the U.S. is forecasted to reduce coal production in the next two years.
Country Coal Production (2021) Coal Production (2024F) Share (2024F) Change (2021–2024F)
🇨🇳 China 3,925 Mt 3,982 Mt 50% +57 Mt
🇮🇳 India 793 Mt 955 Mt 12% +162 Mt
🇮🇩 Indonesia 576 Mt 570 Mt 7% -6 Mt
🇺🇸 United States 528 Mt 484 Mt 6% -44 Mt
🇦🇺 Australia 470 Mt 477 Mt 6% +7 Mt
🇷🇺 Russia 429 Mt 445 Mt 5% +16 Mt
🇪🇺 European Union 329 Mt 247 Mt 3% -82 Mt
🌐 Other 839 Mt 855 Mt 11% +16 Mt
Source: IEA
With 15 EU countries signing the pledge, the European Union is forecasted to see the greatest drop in coal production at 82 million tonnes, along with the greatest forecasted reduction in coal consumption (101 million tonnes, a 23% reduction).
Reducing Coal-Fired Power Generation in the U.S.
The U.S. and Indonesia are the other two major producers forecasted to reduce their reliance on coal. The U.S. is projected to cut coal production by 7.5% or 44 million tonnes, while Indonesia’s reduction is forecasted at 6 million tonnes, or just a 1% cut of its 2021 production.
Despite not joining the COP26 pledge, the U.S. is still noticeably pursuing short and long-term initiatives to reduce coal-fired power generation.
In fact, 85% of U.S. electric generating capacity retirements in 2022 are forecast to be coal-fired generators, and there are further plans to retire 28% (59 GW) of currently operational coal-fired capacity by 2035.
Coal Makes Energy Ends Meet in China and India
Modern consumption and production are instead focused in Asia.
China and India produce almost 60% of the world’s coal, and are expected to increase their production by more than 200 million tonnes per year, collectively. All this coal goes towards meeting the insatiable energy demands of both nations.
While China has pledged to start cutting down coal consumption in 2026, the country also announced the construction of 43 new coal-fired power plants to meet energy demand until then. Part of the additional production is driven by a need to reduce the country’s dependence on coal imports, which are expected to drop by 51 million tonnes or 16% from 2021–2024.
By 2024, China’s coal consumption is forecasted to rise by 3.3% and India’s by 12.2%, which would make the two countries responsible for two-thirds of the world’s coal consumption.
Visualizing the Size of Mine Tailings
On January 25th, 2019, a 10-meter tall wave traveling 120 km/h, washed 10 million m3 of mining waste from the Brumadinho tailings dam over the Brazilian countryside killing somewhere between 270 and 320 people.
This was a manmade disaster, made from mining the materials we use daily. Every copper wire in your house, steel frame in an EV, or any modern appliance comes from mining.
Mining leaves behind waste in the form of tailings stored in dams or ponds around the world. This infographic takes a look at the estimated size of one part of this waste, tailings, visualized next to the skyline of New York City as a benchmark.
Quantifying Mining’s Material Impact
In the wake of the Brumadinho tailings failure, the International Council on Mining and Metals (ICMM) began a review with institutional investors and the United Nations Environment Programme (UNEP), to survey tailings facilities around the world.
The Global Tailings Review tracked a total of 1,743 unique facilities containing 44,540,000,000 m3 of tailings. This dataset represents only 30.2% of global commodity production.
However, the review estimated the total number of active, inactive, and closed facilities is around 8,500. If we use the assumptions for the 1,743 estimate to calculate for the 8,500 facilities, a total of 217,330,652,000 m3 of tailings are in storage globally.
What are Tailings?
Not all rock that comes out of the ground is metal. Miners find, remove, and refine rocks that carry a small amount of metal we need.
According to the USGS, 72 billion tonnes of material produced just over 10 billion tonnes of ore. Only 14% mined material makes it to processing for metals.
Waste rock (tonnes) Material Sent to Mill (tonnes) Ore Produced (tonnes) Tailings (tonnes)
72,000,000,000 18,800,000,000 10,180,000,000 8,850,000,000
Tailings are what is left over after mills separate the metal from the mined rock. The processed material “tailings” comes from the “tail” end of a mining mill and comprise fine particles mixed with water forming a slurry. Mining companies will store this waste in dams or ponds.
REAL ASSETSVisualizing the Size of Mine TailingsPublished 3 years ago on May 15, 2021
By Nicholas LePan
Tweet
Share
Share
Reddit
Email
VCE Mine Tailings V2
Use This Visualization
Visualizing the Size of Mine Tailings
On January 25th, 2019, a 10-meter tall wave traveling 120 km/h, washed 10 million m3 of mining waste from the Brumadinho tailings dam over the Brazilian countryside killing somewhere between 270 and 320 people.
This was a manmade disaster, made from mining the materials we use daily. Every copper wire in your house, steel frame in an EV, or any modern appliance comes from mining.
Mining leaves behind waste in the form of tailings stored in dams or ponds around the world. This infographic takes a look at the estimated size of one part of this waste, tailings, visualized next to the skyline of New York City as a benchmark.
Quantifying Mining’s Material Impact
In the wake of the Brumadinho tailings failure, the International Council on Mining and Metals (ICMM) began a review with institutional investors and the United Nations Environment Programme (UNEP), to survey tailings facilities around the world.
The Global Tailings Review tracked a total of 1,743 unique facilities containing 44,540,000,000 m3 of tailings. This dataset represents only 30.2% of global commodity production.
However, the review estimated the total number of active, inactive, and closed facilities is around 8,500. If we use the assumptions for the 1,743 estimate to calculate for the 8,500 facilities, a total of 217,330,652,000 m3 of tailings are in storage globally.
What are Tailings?
Not all rock that comes out of the ground is metal. Miners find, remove, and refine rocks that carry a small amount of metal we need.
According to the USGS, 72 billion tonnes of material produced just over 10 billion tonnes of ore. Only 14% mined material makes it to processing for metals.
Waste rock (tonnes) Material Sent to Mill (tonnes) Ore Produced (tonnes) Tailings (tonnes)
72,000,000,000 18,800,000,000 10,180,000,000 8,850,000,000
Tailings are what is left over after mills separate the metal from the mined rock. The processed material “tailings” comes from the “tail” end of a mining mill and comprise fine particles mixed with water forming a slurry. Mining companies will store this waste in dams or ponds.
Not All Minerals Are Equal: Tailings Contribution by Commodity
Not all minerals are equal in their contribution to tailings. The grade, quantity, and the process to extract the valuable metals affect each metal’s material impact.
Search:
Mineral % Contribution to Global Tailings
Copper 46%
Gold 21%
Iron 9%
Coal 8%
Phosphate 4%
Lead and Zinc 3%
Nickel 2%
Platinum Group Elements 1%
Bauxite 1%
Uranium <1%
Total 100%
Showing 1 to 10 of 19 entriesPreviousNext
A renewable future will be mineral intensive and will inevitably produce more mining waste, but growing awareness around mining’s true cost will force companies to minimize and make the most of their waste.
Turning a Liability into an Asset
While tailings are waste, they are not useless. Researchers know there remains economic value in tailings. Natural Resources Canada estimated that there is $10B in total metal value in Canadian gold mining waste.
Rio Tinto has produced borates from a mine in the Mojave Desert which has left behind more than 90 years’ worth of tailings. The company was probing the tailings for gold and discovered lithium at a concentration higher than other U.S. projects under development.
According to UBC’s Bradshaw Initiative for Minerals and Mining professor Greg Dipple, the mining industry could help society store carbon. For over a decade, he has researched a process in which tailings naturally draws CO₂ from the air and traps it in tailings.
A Material World
While the majority of mining companies manage tailing dams safely, the issue of the material impacts of mining on Earth remains.
Mining of metal has grown on average by 2.7% a year since the 1970s, and will continue to grow. The importance of the size of tailings is critical to address proactively, before it comes rushing through the front door, as it did in Brazil.
Published by Nicholas LePan
Estimados amigos y colegas, a través de la presente les remito el trabajo denominado: "Estimation of Ore Reserves Applying Mathematical Algorithms - A Holistic Approach", este trabajo fue presentado para la Society for Mining, Metallurgy & Exploration-UNI (SME-UNI)
Sufficient uranium resources exist to support continued use of nuclear power and significant growth in nuclear capacity for electricity generation and other uses (e.g. heat, water, hydrogen) in the near to long term. Identified recoverable resources, which include reasonably assured and inferred resources combined, at a cost category of <USD 260/kgU (equivalent to USD 100/lb U3O8), are sufficient for more than 130 years, considering the uranium requirements of the year 2020.
At the end of the reporting period for this edition of the “Red Book”, when early 2021 uranium market prices were about USD 30/lb U3O8 (USD 78/kg U), only 25% of the recoverable resource base outlined in this edition of the “Red Book” could be economically brought into production, since resources with estimated mining costs greater than 80 USD/kgU cannot be profitably mined at such prices. Hence, given those market and economic conditions, identified recoverable resources at a cost category of <USD 80/kgU (equivalent to USD 30/lb U3O8, the average price of uranium in early 2021) would be sufficient for only about 30 years of global reactor-related uranium requirements, considering 2020 uranium requirement figures. At average market prices of about USD 50/lb U3O8 (USD 130/kg U), beginning in mid-2021 and sustained through the beginning of 2023, approximately 75% of the recoverable resource base could be economically brought into production, representing about 100 years of uranium requirements. Favourable prices would need to be sustained – and significant timely investment and technical expertise will be required – to turn these resources into refined uranium ready for nuclear fuel production.
Global uranium demand is expected to continue to increase in the next several decades to meet large population needs, particularly in emerging economies. Since nuclear energy produces competitively priced, low-carbon baseload electricity and enhances the security of energy supply, it is projected to remain an important component in the mix of low carbon energy supply.
The abundance of low-cost natural gas in North America and the risk-averse investment climate have reduced the competitiveness of nuclear power plants in some liberalised electricity markets. Government and market policies that recognise the benefits of low-carbon electricity production and the security of energy supplied by nuclear power plants could help alleviate these competitive pressures.
In 2021 and 2022, the perception of nuclear energy as a strategic resource for energy independence has started to change in many countries, as reflected by recent government nuclear energy policy changes. Noting that this was also due to the dramatic European energy crisis of 2022 brought by the shifting geopolitical situation, the 2024 edition of the “Red Book” will aim to provide a fuller picture of the implications of these developments on uranium demand and supply.
After a period of reductions in uranium production, slowed investment and comparatively low prices, it remains to be seen whether the quickly evolving market and policy environment will provide incentives for the uranium market to expand substantially in the coming decades.
Source : International Atomic Energy Agency (IAEA)
www.oecd-nea.org/upload/docs/application/pdf/2023-04/
Source: Creditis to : International Atomic Energy Agency (IAEA)
Risks in the mining industry are well documented, but which are the most prominent, and how have those ranked highest evolved over the past decade? I've created the Periodic Table of Top 10 Mining Risks to introduce just a few of the trends, but what do you see as being the Top 10 Mining Risks for the coming year?
A Few Guidelines of 8 simple principles for email etiquette and
maintaining ultimate professionalism when communicating and emailing professionally!
Source: Mitesh Bhatt
I get requests for these cards on a frequent basis, so I thought it best to post directly. Definitely not perfect but at least they are logical. Printed on A4 paper, cut (horizontal) fold (vertical) and plastify ... and you should have a set of cards ready to go.
My linked in page has comments on how to use the codes, rock and drill hole log forms and perhaps a few more odd's and sods which I have forgotten about.
Minerals and metals are indispensable for countless economic activities.
The energy transition is set to increase the demand for materials, and numerous industries are expected to require more minerals in the near future.
This, combined with a renewed focus on sustainability, makes the mining and metals industry ripe for a transformation whose implications will extend beyond the immediate sector to a myriad of industries and processes essential to everyday life.
Source: Discovery Group
This document presents a comprehensive applied approach to the estimation of mineral resources/reserves with particular emphasis on :
• The geological basis of such estimations
• The need for and maintenance of a high-quality assay data base
• The practical use of a comprehensive exploratory data evaluation
• The importance of a comprehensive geostatistical approach to the estimation methodology
Source : https://www.geokniga.org/bookfiles/geokniga-appliedmineralinventoryestimation.pdf
Alejandro Jaimez Fuentes
Source: Credits to ALASTAIR J. SINCLAIR and GARSTON H. BLACKWELL
All the Metals We Mined in One Visualization
This was originally posted on Elements. Sign up to the free mailing list to get beautiful visualizations on natural resource megatrends in your email every week.
Metals are a big part of our daily lives, found in every building we enter and all devices we use.
Today, major industries that directly consume processed mineral materials contribute 14% of the United States economy.
The above infographic visualizes all 2.8 billion tonnes of metals mined in 2022 and highlights each metal’s largest end-use using data from the United States Geological Survey (USGS).
Iron Ore Dominance
Iron ore dominates the metals mining landscape, comprising 93% of the total mined. In 2022, 2.6 billion tonnes of iron ore were mined, containing about 1.6 billion tonnes of iron.
Metal/Ore Quantity Mined in 2022 (tonnes) % of Total
Iron ore 2,600,000,000 93.3%
Industrial metals 185,111,835 6.6%
Technology and Precious Metals 1,500,008 0.05%
Total 2,786,611,843 100%
Percentages may not add up to 100 due to rounding.
Iron ores are found in various geologic environments, such as igneous, metamorphic, or sedimentary rocks, and can contain over 70% iron, with many falling in the 50-60% range.
Combined with other materials like coke and limestone, iron ore is primarily used in steel production. Today, almost all (98%) iron ore is dedicated to steelmaking.
The ore is typically mined in about 50 countries, but Australia, Brazil, China, and India are responsible for 75% of the production.
Because of its essential role in infrastructure development, iron ore is one of the most crucial materials underpinning urbanization and economic growth.
Industrial Metals
Industrial metals occupy the second position on our list, constituting 6.6% of all metals mined in 2022. These metals, including copper, aluminum, lead, and zinc, are employed in construction and industrial applications.
Aluminum constituted nearly 40% of industrial metal production in 2022. China was responsible for 56% of all aluminum produced.
Industrial Metals 2022 Mine Production (tonnes) % of Total
Aluminum 69,000,000 37.3%
Chromium 41,000,000 22.1%
Copper 22,000,000 11.9%
Manganese 20,000,000 10.8%
Zinc 13,000,000 7.0%
Titanium (mineral concentrates) 9,500,000 5.1%
Lead 4,500,000 2.4%
Nickel 3,300,000 1.8%
Zirconium Minerals (Zircon) 1,400,000 0.8%
Magnesium 1,000,000 0.5%
Total 185,111,835 100.00%
PreviousNext
In the second position is chromium, which plays a primary role in rendering stainless steel corrosion-resistant. South Africa led chromium production, accounting for 44% of the total mined last year.
Technology and Precious Metals
Despite representing less than 1% of all the metals mined, technology metals have been on the news over the last few years as countries and companies seek these materials to reduce carbon emissions and improve productivity.
Technology and Precious Metals 2022 Mine Production (tonnes) % of Total
Tin 310,000 20.7%
Rare Earth Oxides 300,000 20.0%
Molybdenum 250,000 16.7%
Cobalt 190,000 12.7%
Lithium 130,000 8.7%
Vanadium 100,000 6.7%
Tungsten 84,000 5.6%
Niobium 79,000 5.3%
Silver 26,000 1.7%
Cadmium 24,000 1.6%
Total 1,500,008 100%
PreviousNext
They include lithium and cobalt, used in electric vehicles and battery storage, and rare earths, used in magnets, metal alloys, and electronics. Many of them are considered critical for countries’ security due to their role in clean energy technologies and dependency on other nations to supply domestic demand.
However, despite increasing interest in these metals, they are still behind precious metals such as gold and silver regarding market size.
The gold market, for example, reached $196 billion in 2022, compared to $10.6 billion of the rare earth market.
Published by Bruno Venditti
Rare Earths Elements: Where in the World Are They?
This was originally posted on Elements. Sign up to the free mailing list to get beautiful visualizations on natural resource megatrends in your email every week.
Rare earth elements are a group of metals that are critical ingredients for a greener economy, and the location of the reserves for mining are increasingly important and valuable.
This infographic features data from the United States Geological Society (USGS) which reveals the countries with the largest known reserves of rare earth elements (REEs).
What are Rare Earth Metals?
REEs, also called rare earth metals or rare earth oxides, or lanthanides, are a set of 17 silvery-white soft heavy metals.
The 17 rare earth elements are: lanthanum (La), cerium (Ce), praseodymium (Pr), neodymium (Nd), promethium (Pm), samarium (Sm), europium (Eu), gadolinium (Gd), terbium (Tb), dysprosium (Dy), holmium (Ho), erbium (Er), thulium (Tm), ytterbium (Yb), lutetium (Lu), scandium (Sc), and yttrium (Y).
Scandium and yttrium are not part of the lanthanide family, but end users include them because they occur in the same mineral deposits as the lanthanides and have similar chemical properties.
The term “rare earth” is a misnomer as rare earth metals are actually abundant in the Earth’s crust. However, they are rarely found in large, concentrated deposits on their own, but rather among other elements instead.
Rare Earth Elements, How Do They Work?
Most rare earth elements find their uses as catalysts and magnets in traditional and low-carbon technologies. Other important uses of rare earth elements are in the production of special metal alloys, glass, and high-performance electronics.
Alloys of neodymium (Nd) and samarium (Sm) can be used to create strong magnets that withstand high temperatures, making them ideal for a wide variety of mission critical electronics and defense applications.
End-use % of 2019 Rare Earth Demand
Permanent Magnets 38%
Catalysts 23%
Glass Polishing Powder and Additives 13%
Metallurgy and Alloys 8%
Battery Alloys 9%
Ceramics, Pigments and Glazes 5%
Phosphors 3%
Other 4%Source
The strongest known magnet is an alloy of neodymium with iron and boron. Adding other REEs such as dysprosium and praseodymium can change the performance and properties of magnets.
Hybrid and electric vehicle engines, generators in wind turbines, hard disks, portable electronics and cell phones require these magnets and elements. This role in technology makes their mining and refinement a point of concern for many nations.
For example, one megawatt of wind energy capacity requires 171 kg of rare earths, a single U.S. F-35 fighter jet requires about 427 kg of rare earths, and a Virginia-class nuclear submarine uses nearly 4.2 tonnes.
Global Reserves of Rare Earth Minerals
China tops the list for mine production and reserves of rare earth elements, with 44 million tons in reserves and 140,000 tons of annual mine production.
While Vietnam and Brazil have the second and third most reserves of rare earth metals with 22 million tons in reserves and 21 million tons, respectively, their mine production is among the lowest of all the countries at only 1,000 tons per year each.
Country Mine Production 2020 Reserves % of Total Reserves
China 140,000 44,000,000 38.0%
Vietnam 1,000 22,000,000 19.0%
Brazil 1,000 21,000,000 18.1%
Russia 2,700 12,000,000 10.4%
India 3,000 6,900,000 6.0%
Australia 17,000 4,100,000 3.5%
United States 38,000 1,500,000 1.3%
Greenland - 1,500,000 1.3%
Tanzania - 890,000 0.8%
Canada - 830,000 0.7%
South Africa - 790,000 0.7%
Other Countries 100 310,000 0.3%
Burma 30,000 N/A N/A
Madagascar 8,000 N/A N/A
Thailand 2,000 N/A N/A
Burundi 500 N/A N/A
World Total 243,300 115,820,000 100%
While the United States has 1.5 million tons in reserves, it is largely dependent on imports from China for refined rare earths.
Ensuring a Global Supply
In the rare earth industry, China’s dominance has been no accident. Years of research and industrial policy helped the nation develop a superior position in the market, and now the country has the ability to control production and the global availability of these valuable metals.
This tight control of the supply of these important metals has the world searching for their own supplies. With the start of mining operations in other countries, China’s share of global production has fallen from 92% in 2010 to 58%< in 2020. However, China has a strong foothold in the supply chain and produced 85% of the world’s refined rare earths in 2020.
China awards production quotas to only six state-run companies:
China Minmetals Rare Earth Co
Chinalco Rare Earth & Metals Co
Guangdong Rising Nonferrous
China Northern Rare Earth Group
China Southern Rare Earth Group
Xiamen Tungsten
As the demand for REEs increases, the world will need tap these reserves. This graphic could provide clues as to the next source of rare earth elements.
Published by Nicholas LePan
Visualizing Cobalt Production by Country in 2023
This was originally posted on our Voronoi app. Download the app for free on iOS or Android and discover incredible data-driven charts from a variety of trusted sources.
Cobalt is a critical mineral used in numerous commercial, industrial, and military applications. In recent years, it has gained attention as it is also necessary for batteries used in cell phones, laptops, and electric vehicles (EVs).
This graphic illustrates estimated cobalt production by country in 2023 in metric tons. The data is from the most recent U.S. Geological Survey (USGS) Mineral Commodity Summaries, published in January 2024.
The DRC Produces 74% of Global Cobalt
The Democratic Republic of Congo (DRC) accounts for 74% of the world’s cobalt output. Although the metal is found on a large scale in other parts of the world, like Australia, Europe, and Asia, the African nation holds the biggest reserves by far. Of the 11,000,000 metric tons of worldwide reserves, it is estimated that 6,000,000 metric tons are located in the DRC.
Country metric tons Percentage
🇨🇩 DRC 170,000 74%
🇮🇩 Indonesia 17,000 7%
🇷🇺 Russia 8,800 4%
🇦🇺 Australia 4,600 2%
🇲🇬 Madagascar 4,000 2%
🇵🇭 Philippines 3,800 2%
🌍 Other Countries 21,100 9%
Total 229,300 100%
Since around 20% of the cobalt mined in the DRC originates from small-scale artisanal mines, often employing child labor, the extraction of the metal has been a point of intense debate. With a long history of conflict, political upheaval, and instability, the country is often listed among the poorest nations in the world.
Today, the EV sector constitutes 40% of the overall cobalt market.
China is the world’s leading consumer of cobalt, with nearly 87% of its consumption used by the lithium-ion battery industry.
In the U.S., 50% of cobalt consumed is used in superalloys, mainly in aircraft gas turbine engines.
Learn More About Critical Minerals From Visual Capitalist
If you enjoyed this post, be sure to check out The Critical Minerals to China, EU, and U.S. National Security. This visualization shows which minerals are essential to China, the United States, and the European Union.
Published by Bruno Venditti
The estimation of mineral resources is an important task for geoscientists and mining engineers. The approaches to this challenge have evolved over the last 40 years. This book presents an overview of established current practice. The book is intended for advanced undergraduate students or professionals just starting out in resource estimation.
Source: Alejandro Jaimez Fuentes
Source: Credits to Mario E. Rossi and Clayton V. Deutsch
Simple Schematic done up showing the Drill and Blast team general responsibilities throughout a Development and Production Mining Cycle in Underground Mining.
Presented during the Technical Team Knowledge Sharing Session
Dentro de la formulación para obtener el costo horario de un equipo, esta es una manera práctica de las muchas que pueden haber. Me gusta porque utiliza la base científica y empìrica con lo que actualizando precios puede ser una buena estimaciòn, en este caso para un Jumbo S1D en minería subterránea.
At the end of the first quarter 2024, the MINING.COM TOP 50* ranking of the world’s most valuable miners had a combined market capitalization of a shade under $1.4 trillion, down $13 billion since the start of the year.
The historic gold run and copper’s comeback, now up 14% and 12% so far in 2024, only kicked into a higher gear after the end of the March quarter, but copper and gold counters nevertheless dominate the best performer list for Q1.
The lacklustre combined performance of the sector’s majors came despite the revival in the bellwether metals, but the broader market has been a mixed bag in 2024.
Aluminium is trading not far off 52-week highs, but zinc seems unlikely to breach $3,000 a tonne any time soon and cobalt is bobbing along historic lows below $30,000 a tonne.
Nickel has been bumped up after lows in the mid-$15,000s last year, but remains firmly stuck in bear territory and lithium’s 2024 good fortune also looks in danger of petering out.
Sentiment towards PGMs has hardly improved with both platinum and palladium drifting lower in 2024. Even iron ore prices back above $100 a tonne – the bread and butter of the diversified majors – was not enough for investors to jump back into the sector.
Gold, copper boost
First Quantum Minerals with market valuation up 58% in US dollar terms, made a welcome return at position 44 after dropping out at the end of last year following the closure of its Panama mine.
Amman Mineral continued its astounding run – the Indonesian copper and gold miner has added 380% in value since its July listing and could soon vie for a place in the 10.
Lundin Mining joins the top 50 for the first time jumping five places to 48 and is already climbing thanks to the red metal approaching 14-month highs. Lundin’s 25% rise in 204 also restores Vancouver as the number one location among top 50 headquarters after Pilbara Minerals’ exit this quarter.
Anglogold Ashanti re-entry boosts the number of precious metals miners in the top tier to 10 and their collective value to $183 billion.
China’s Yintai Gold, which in February picked up Canada’s Osino Resources, could also challenge for a position in the upper echelon from its current 54th position should gold continue to rally, but long term top 50 participant, KGHM has a hill to climb to make it back despite shares in the Polish mining company rising 15% year to date.
Pan American Silver, like its primary metall, could ride gold’s coattails to become the only silver-focused miner in the top 50 following Fresnillo’s exit more than a year ago. Silver is now the best performing metal year to date, up more than 18%.
Diversified drubbing
While the top 50 mining companies as a whole drifted sideways during the quarter, the largest diversified companies faced headwinds going into 2024 and uncharacteristically some of the biggest names in mining feature on the worst performer list for the quarter.
The only $100bn companies in the ranking – BHP and Rio Tinto – were both down by double digits at the end of Q1 and Glencore’s rerating over the past couple of years went into reverse with declines of 9% in 2024.
Vale’s pullback from its valuation at the end of 2023 places the stock firmly in bear territory with losses of nearly 24% in US dollar terms. The Brazilian giant sold 13% of its base metals unit for $3.4bn to amongst others the Saudi Arabia’s sovereign wealth fund, but given the performance of nickel a separate listing seems off the table for now.
Anglo American stock had a fairly uneventful Q1 2024 after the sharp H2 2023 sell-off sparked by copper guidance, PGM and South African power woes, and despite the bad news from its Woodsmith fertiliser project in England.
Nevertheless the counter has dropped below a $30 billion market cap for the first time since the outset of the pandemic and losses for the past 12 months top 30%. Rumours that Glencore may be interested after the Swiss behemoth’s bid for all of Teck Resources fell through have died down, probably for the right reasons.
The ranking remains top heavy, but as a group the historic top five diversified mining companies share of the MINING.COM Top 50’s overall valuation fell to a new low of 29%, down from 36% at the end of 2022.
China cheer
The historic top 5 diversifieds should in fairness be expanded to seven and include Saudi Arabia’s Ma’aden and Zijin Mining, the highly acquisitive Chinese firm is up over 30% so far this year and appears to be well ensconced in the top 10.
Xiamen-based Zijing at the end of Q1 fell just short of a $60bn market worth (indeed gold and copper’s run in the first week of Q2 has now lifted the stock above that milestone).
On the best performer list for the quarter Zijin sits just behind CMOC Group, formerly China Molybdenum and for years before being overtaken by Zijin the most valuable middle kingdom mining stock, and ahead of Jiangxi Copper which jumps 9 places to 41 in Q1.
The 10 Chinese companies in the ranking collectively are worth $192bn or 14% of the overall value, up from 8 companies valued at $115bn and 9% of three years ago.
Lithium loss
Three counters dropped out of the top 50 during the first quarter. Brazil’s CSN Mineração, an iron ore miner, China’s Huayou Cobalt and Australian lithium producer Pilbara Minerals.
Pilbara Minerals only just lost out to Kinross Gold for the last spot as at end-March and lithium prices have recovered somewhat this year, but probably not enough for the lithium sector to outperform gold stocks in Q2.
The merger of Livent and Allkem to form Arcadium Lithium also did not result in an increase in lithium mining’s representation in the ranking. Arcadium Lithium has been hammered down to below a $5bn valuation this year.
From its height of a collective $119bn valuation at the end of the second quarter of 2022, the combined value of the lithium stocks in the top 50 has now fallen to $59 billion.
Source: https: www.mining.com/top-50-biggest-mining-companies/
Everyone is going crazy about AI and big data mining these days. Nvidia has rapidly become one of the most valuable companies in the world thanks to their innovation on AI chips. To make these chips, you need tungsten, copper, tin, aluminum, and gold.
I got curious on how the market values the data mining vs. material mining and compared market capitalizations including the largest mining companies in the world. Unfair? :)
From Ciro Alegre : Dear friends and colleagues, I would like to share with you the article "Underground Mine Planning Applying Mining Software" which I wrote for the Mining Magazine of the IIMP (Instituto de Ingenieros de Minas del Perú).
It is impossible to dispute the genuine value of a well-built and reliable resource model. Developed on a solid geological foundation, with a comprehensive understanding of estimation domains and reinforced by robust geostatistics, the resource model serves as an excellent foundation for long-term mine planning. Moreover, it serves as the starting point for the reconciliation process. At the end of the day, the corporate financial teams typically focus on a single number, F3, which is closely tied to the performance of the resource model. This performance is just as crucial as the operational practices and hard work put in by the metallurgists at the plant.
But what if your resource model isn't willing to cooperate and reflect the similar in-situ reality that your grade control model shows (assuming you are in the meat of your mineralization and having good representative volume for the comparison)? This scenario applies, of course, if your grade control model makes sense (see the Recon #4 Post), although generally, it is less sensitive and more difficult to mess up given the quantity of data. I'm not inclined to delve into the intricacies of all the best practices applied to resource modelling (Erik Ronald already has an excellent series of posts on the topic). Instead, let's focus on the key reasons why your resource model may not behave and consistently disrupt your reconciliation results.
Datasets
1) Start by ensuring that your datasets convey the same picture. Easily achieve this by compositing your exploration dataset at the blasthole length and conducting pair analysis for closely spaced samples (perhaps 3-10 meters, depending on your drilling grids). A QQ plot will likely reveal any biases in your data.
2) For a more sophisticated approach, consider twinning some exploration holes with blastholes. Collect samples of the same size; though more labor-intensive, this method may yield more representative results. The same principle applies to the RC grade control method.
3) If bias is detected, unravelling the reasons behind it and eliminating them becomes a paramount task for any mining geologist. Both datasets can suffer from deficiencies in the drilling process (e.g., flushing fine gold with water), sample collection (when was the last time you checked the quality of the sample cone cutting in the pit?), sample preparation (ranging from sloppy splitting to consistent contamination), and analytical methods (have you considered differences in digestion methods? is you mine lab as reliable as the certified one?).
Domains
1) Once you've confirmed that the data is clear, the next major culprit is the interpretation or the quality of your resource estimation domains. Depending on the deposit type and style of mineralization, they may be either too broad or too restrictive, developed with only geology in mind or as sterile grade shells, the possibilities are numerous.
2) However, while interpretations can vary (two geos – three opinions 😊), a simple visualization of your estimation domains versus the grade control data can provide insights into how your long-term interpretation aligns with dense drilling (it should!). Naturally, domains developed from sparse drilling may not precisely match the grade trends from blastholes, but they also shouldn't differ significantly. If they do, understanding the reasons and considering possible remodelling should help address the issue.
Estimation
1) If your data is OK and the narrative conveyed by your domains aligns with that revealed by blastholes, you likely already have a close alignment in your Resource/Grade Control Model metrics. However, if consistent differences persist, it may be time to scrutinize the details of the estimation assumptions.
2) You can do this simply by visually comparing sections of the block models (typically, the resource model provides a story at a coarse scale while the GC model offers a full HD) or by putting effort into overlapping the models and calculating grade differences (usually, the block size for the GC model is smaller, requiring upscaling to account for the change-of-support effect).
3) Once you identify the areas causing the most issues, the focus shifts to uncovering the underlying reasons. There could be various factors at play: overly aggressive (or conservative) capping, insufficient drilling density leading to high-grade bleeding (consider adjusting capping and/or using restricted search), or a search that is either too smooth or too variable. Once the reason is pinpointed, tweaking the estimation parameters may be justified to better reflect the observed patterns in the GC model.
These practical tips provide guidance on addressing persistent biases between the models. Feel free to share your experiences or challenges in the comments.
Source: https://www.linkedin.com/posts/aleksandr-mitrofanov-phd-pgeo-9473ba6a_mining-mininggeology-resourcegeology-activity-7157433534163402752-uDWJ?utm_source=share&utm_medium=member_desktop
En esta primera editorial de la Revista Minería & Planificación, en donde se encuentran las memorias del IV Seminario Internacional de Minería y Planeamiento Minero 2023 (IV SIMPM 2023) “Hacia una minería como pilar de la transición energética”.
Implementing an effective grade control process in open pit mines involves several key steps and considerations to ensure accurate delineation of ore and waste material. Here’s a structured approach:
1.Geological Understanding:
•Geological Model: Develop a detailed geological model of the deposit, including orebody geometry, mineralization styles, and geological structures.Drill Program: Conduct a systematic drill program to gather data for the geological model. Use various drilling techniques (e.g., RC, diamond drilling) for accurate sampling.
2.Sampling and Assaying:
•Sampling Protocols: Establish rigorous sampling protocols to ensure representative samples are collected. Consider factors like sample spacing, orientation, and sample size.
•Assaying Quality Control: Implement strict quality control measures for assay results. This includes duplicate samples, standards, and blanks to monitor assay accuracy and precision.
3.Data Integration and Validation:
•GIS and Data Management: Utilize Geographic Information Systems (GIS) for spatial data integration. Manage data using a centralized database system for easy access and validation.
•Statistical Analysis: Apply statistical methods to analyze assay data, such as variogram analysis for spatial continuity and interpolation methods (e.g., kriging) for resource estimation.
4.Modeling and Block Modeling:
•Grade Estimation: Use geostatistical methods to estimate grades across the deposit. Validate models through cross-validation techniques.
•Block Modeling: Develop a block model to represent the distribution of ore and waste in 3D space. Consider factors like block size, estimation parameters, and geological boundaries.
5.Pit Design and Optimization:
•Pit Optimization: Integrate the geological model and block model into pit optimization software to design optimal pit shells. Consider economic parameters (e.g., commodity prices, mining costs) to maximize project profitability.
•Sensitivity Analysis: Conduct sensitivity analyses to assess the impact of geological uncertainty on pit design and economic outcomes.
6.Operational Implementation:
•Grade Control Drilling: Implement a grade control drilling program to validate the geological model and provide real-time data for mining operations.
•Sampling During Production: Continuously sample and assay material during production to adjust mining plans and ensure adherence to grade control targets.
7.Monitoring and Feedback Loop:
•Performance Monitoring: Establish regular monitoring of grade control performance against geological models and mine plans.
•Continuous Improvement: Implement a feedback loop to continuously improve grade control processes based on operational data and geological insights.
Designing a blast involves the consideration of multiple parameters, and achieving the desired blasting outcome necessitates a thorough understanding of the interplay and interdependence of these factors to avoid unsafe, inefficient, or wasteful blasting results. Table 1 provides an outline of the relevant blast design parameters, along with their respective descriptions.
Table 1. Blast Parameter Descriptions (de Graaf, 2011)
• Blasthole: A hole that is drilled for explosives placement either in rock or other material.
• Hole Diameter (D): The diameter of a blasthole.
• Free Face: A rock surface exposed to air that provides a space for the rock to expand to upon fragmentation.
• Burden (B): The distance (perpendicular) between two adjacent blasthole rows, or between the nearest parallel (main) free face and a blasthole.
• Spacing (S): The distance (perpendicular to the burden) between two adjacent blastholes in any row of blastholes parallel to the free face
• Crest: The line connecting the highest points on the top of a free face.
• Toe: The line connecting the lowest points on the bottom of a free face.
• Bench Height (H): The vertical distance between the Toe and the crest of the bench.
• Toe Burden: The distance between the blasthole and the free face at the grade or floor level.
• Floor/Grade: The floor level determined by the mine design and the surveyor.
• Stemming (T): The inert material, such as drill chippings or crushed stone aggregate, used in the collar portion of a blasthole to confine the gaseous products of detonation.
• Charge Length (L): Length of the changed explosives column measured from the floor/grade to the starting position of the stemming material.
• Sub-Drill (U): The portion of the blasthole drilled below the planned floor/grade level.
• Total Charge length: The total charge length is the portion of the blasthole combining the charge length and the Sub-Drill length.
Blast Design Parameters
When designing a blast, several parameters are considered, including bench height, hole diameter, rock type, and explosive type. The fundamental principles of blasting are closely tied to hole diameter and burden, forming the foundation of the initial design process. The following guide outlines the design process:
1. Calculate the linear charge mass (the amount of explosives used, mass per meter in the hole).
2. Determine the required burden (the distance between the blasthole and the free face of the rock).
3. Calculate the hole spacing based on the selected burden-to-spacing ratio (either staggered or square pattern).
4. Compute the technical powder factor (the amount of explosive mass per blasted rock mass/volume).
5. Calculate the necessary stemming length (the material placed on top of the explosives in the blasthole).
6. Apply sub-drill design if required (adjustments to the hole depth).
7. Calculate the actual powder factor after design adjustments.
8. Design the timing sequence (the pattern or sequence in which individual holes detonate/propagate).
Blast Design At A Mine
It’s important to note that this process may vary depending on the available information during the design phase and should not be considered an industry standard.
Figure 1 provides schematics of a simplified blast bench layout and illustrate the blast parameters listed in Table 1. Please note that these schematics are not drawn to scale, and terminology may vary between countries and industries. A high resolution copy of the below diagram can be downloaded here.
A brief summary of mining methods used in underground mines, which vary depending on the type of mineral and geological conditions involved. These methods play a crucial role in extracting valuable minerals and natural resources from deposits located underground. It is relevant to highlight that many of these deposits have unique characteristics, often requiring the combination or adaptation of mining techniques to fit each situation. The ability of engineers to apply this flexibility and adaptation is what makes their role essential in the world of underground mining.
Ground support has been used to stabilise underground excavations in rock since Roman times. In a review of the evolution of ground support and reinforcement, Brown (1999) refers to De Re Metallica (Agricola 1556), which describes timbering in shafts, tunnels and drifts used as a means of protection against collapse and risk of injury. Stabilisation of the immediate boundary of a rock mass surrounding an excavation is often referred to as ‘local support’. Until the 1950s, timbering remained one of the main means of local support. Since then, it has gradually been replaced by internal reinforcement techniques, such as dowels installed inside a drilled hole.
Source: ACG Australian Centre for Geomechanics
Alejandro Gonzalez Borja, LinkedIn
Source: Credits to Yves Potvin & John Hadjigeorgiou
Most countries require an environmental impact assessment (EIA) before giving the green light to a mining project. EIA processes provide a valuable opportunity for citizens to participate in decisions about mines. The problem is, project proponents often submit long, complex EIA documents that are incomprehensible to lay people.
The Guidebook for Evaluating Mining Project EIAs will help public interest lawyers, grassroots advocates, and community members understand mining EIAs, identify flaws in mining project plans, and explore ways that mining companies can reduce the public health hazards associated with mining.
Source: Alpha Bayo
Source: Credits to Environmental Law Alliance Worldwide (ELAW)
It’s simple, Ask for it.
Salary negotiations can be daunting.
Most people don’t negotiate: studies show that only 37% of employees negotiate their salaries [Source: Salary.com].
If you want to be paid your worth, you need to ask for it.
Here are my 11 tips for your next salary discussion:
Before The Discussion:
1/ Choose a Good Time
2/ Get Other Job Offers
3/ Check Average Salaries
4/ Practice Your Talking Points
During The Discussion:
5/ Be Ambitious
6/ Explain Your Value
7/ Consider The Benefits
8/ Don’t Make the First Offer
After The Discussion:
9/ Follow Up in Writing
10/ Take Time to Respond
11/ Be Willing to Walk Away
Use these tips to get paid what you’re worth.
P.S. What is your top negotiation tip?
The UNFC is a system that classifies resources like minerals, fossil energy based on three main factors: economic and environmental viability, technical feasibility, and confidence in the geological knowledge.
It uses specific categories (E1, E2, E3 for economic and environmental viability; F1, F2, F3 for technical feasibility; and G1, G2, G3, G4 for geological confidence) to help governments, companies, and investors understand the potential and readiness of these resources for development. This system helps in making informed decisions about resource management and investment.
____
1.
1. E Axis (Economically Viable and Environmentally Acceptable):
E1 - High Environmental-Socio-Economic Viability:
Resources classified as E1, where the development is economically viable and environmentally acceptable. The projects are typically approved and have a high probability of going into production soon.
E2 - Moderate Environmental-Socio-Economic Viability:
Resources in the E2 category have a reasonable potential for economic viability and environmental acceptance, but some uncertainties remain. These projects may require further studies, approvals, or additional development efforts before they can become fully viable.
E3 - Low Environmental-Socio-Economic Viability:
E3 resources have a low economic viability or face significant environmental and socio-economic challenges. These projects may not be feasible with current economic and regulatory conditions. Further exploration, technological advances, or changes in market conditions would be necessary to improve their viability.
____
2.
2. F Axis (Confidence in Technical Feasibility):
F1 - High Technical Feasibility:
The project is technically feasible, is well-developed, usually with detailed planning, engineering, and operational processes in place. Typically, such projects are in production or very close to starting production.
F2 - Moderate Technical Feasibility:
The project has moderate technical feasibility, requires further technical studies, development, or testing that need to be resolved before the project can be fully implemented.
These projects are often in advanced stages of planning and development but are not yet ready for production.
F3 - Low Technical Feasibility:
The project has low technical feasibility under current conditions, due to technological, engineering, or operational challenges. Extensive research, development, are required to determine if the project can become feasible. Such projects are typically in the early stages of exploration and assessment.
____
3.
3. G Axis (Confidence in Geological Knowledge):
G1 - High Confidence:
The quantity and quality of the resource are well-defined and confirmed through detailed exploration and analysis.
G2 - Moderate Confidence:
There is good geological knowledge and reasonably accurate estimates of the resource, but not as precise as G1. Further exploration and analysis are needed to confirm the exact quantity and quality.
G3 - Low Confidence:
The resource estimates are based on limited geological data and preliminary exploration. There is significant uncertainty, and more extensive exploration is required to improve confidence levels.
G4 - Very Low Confidence:
The resource is speculative, with very limited data and high uncertainty. It is mostly based on theoretical or indirect evidence, and substantial exploration is necessary to verify the resource's existence and characteristics.
At the end of the second quarter of 2024, the MINING.COM TOP 50* ranking of the world’s most valuable miners had a combined market capitalization of $1.43 trillion, up $42 billion from end-March, as rising copper and gold prices make up for losses among lithium and iron ore counters.
Gold and copper’s historic runs to new all-time highs in May arguably should have sparked a bigger rally during the quarter and year-to-date but mining’s top tier is only worth little over 2% more than at the end of last year and an equally uninspiring 6% gain from this time last year.
Diversified drubbing
Copper specialists have gained a combined 33% year to date but the industry’s traditional big 5 – BHP, Rio Tinto, Glencore, Vale and Anglo American – have lost a collective $59 billion since the start of the year.
The boost from copper was also not enough to counter iron ore’s descent into bear territory from dragging down the group which now make up 29% of the total index, down from a height of 38% at the end of 2022. The steelmaking ingredient’s less than rosy outlook also sees two specialists – Cleveland Cliffs and Fortescue – appear in the worst performer list.
Were it not for Glencore’s lack of exposure to iron ore other than through trading steadying the Swiss giant’s share price, and Anglo American’s 25% jump during the quarter on the back of BHP’s unsuccessful takeover bid, mining’s traditional heavyweights would be an even more diminished grouping.
Investors in Anglo, with a history going back more than a hundred years on the South African gold and diamond fields, have had a particularly wild ride over the last few years. In January 2016, Anglo’s market cap fell below $5 billion and even after the stock’s Q2 bump, is still only worth half its peak valuation hit in 2022.
While the BHP takeover is unlikely to be revived, M&A among the top of the mining industry seems inevitable, particularly when copper is involved, given the billions of dollars of capital expenditure needed for expansion and just to keep operating mines ticking over, to meet demand for the metal through the next decade.
Light on lithium
Three counters dropped out of the top 50 during the first quarter – Brazil’s CSN Mineração, an iron ore miner, China’s Huayou Cobalt and Australian lithium producer Pilbara Minerals.
At the end of Q2, two more lithium stocks – Perth-based Mineral Resources and China’s Tianqi Lithium – exited the top 50 as the deep slump in prices for the battery metal continues to take its toll.
Mineral Resources was only just pipped by Ganfeng Lithium and based on its performance so far in July, the Australian hard rock lithium miner may well return to the fold.
Ganfeng was barely holding on at position 50 at end-June and with gold price momentum continuing and two gold mining companies waiting in the winds – Yintai and Alamos – only three lithium counters in the top 50 may be a reality for some time to come.
After peaking in the second quarter of 2022 with a combined value of nearly $120 billion, the remaining lithium stocks’ market value now barely exceeds $30 billion.
Can’t top copper
Copper, gold producers and royalty companies made up 40% of the index at the end of Q2 on par with diversified miners as Pan American Silver following its absorption of Yamana Gold enters the ranking for the first time and Polish copper giant KGM returns after adding 17% to its market cap during the quarter.
Talks of a possible reopening of its Panama mine saw First Quantum Minerals’ market valuation nearly doubling in US dollar terms from its low at the end of last year, and the Vancouver-based company is now firmly back in the ranking at #34 after dropping out at the end of last year.
Amman Mineral continues its run up, piercing the top 10 for the first time after gaining 67% year to date, and 580% since its debut in Jakarta a year ago, lifting the copper-gold company’s market cap to over $50 billion.
Amman’s Batu Hijau is the third largest mine worldwide in terms of copper equivalent output and has been in production since the turn of the millennium. Amman is also developing the adjacent Elang project on the island of Sumbawa.
Radiant uranium
While spot uranium prices have retreated back below the triple digit prices hit in January, the combined market cap of the sector is still up 42% from last year this time and together now surpasses that of the lithium counters in the ranking.
The world’s largest uranium producers – Cameco and Kazatomprom – only made the top 50 in 2021 with the Saskatoon-based company and state-owned Kazakh producer spending years in the wilderness post the Fukushima disaster in Japan.
None of the smaller uranium companies led by Canada’s Nexgen Energy, valued at a shade over $4 billion, is likely to make it into the top 50 by themselves, but combinations among the rank and file may well be in the offing as interest in the sector and mining M&A in general grows.
Kazatomprom dual-listed in London and Astana in 2018 and Uzbekistan is readying an IPO for Navoi Mining and Metallurgy Combinat – the world’s fourth largest gold mining company and significant uranium producer later this year.
Navoi would join the ranks of gold producers in the top 50 thanks to ownership of the world’s largest gold mine, Muruntau, and annual production of 2.9 million ounces at grades the envy of the sector. Navoi will also bring to five the number of companies with exposure to the nuclear fuel in the ranking.
Ils m'ont longtemps demandé, pourquoi la couleur rouge des agents HSE❓
Vous allez comprendre mieux dans ces lignes...
•La couleur rouge est une couleur vibrante et passionnée qui a longtemps été utilisée dans lart, la décoration, la mode, la publicité et la culture populaire.
•Elle est souvent associée a des émotions fortes telles que l'amour, la colère, la passion et l'excitation et a été utilisée depuis l'antiquité pour symboliser la vie, la force et la vitalité.
•Elle est également utilisée pour symboliser le danger et l'urgence, comme dans les panneaux d'avertissement et les feux de signalisation rouges.
•Dans de nombreuses cultures à travers le monde, la couleur rouge est considérée comme une couleur importante et symbolique.
•En chine, par exemple, la couleur rouge est associée à la bonne fortune et la prospérité, et elle est souvent utilisée dans les décorations et les cérémonies de mariage comme assurance.
•En Inde, la couleur rouge est associée à la puissance et la loyauté.
•Dans la culture occidentale, la couleur rouge est souvent associée à l'amour et la romance.
•En outre, la couleur rouge est souvent utilisée pour attirer l'attention et mettre en valeur certains éléments, comme dans les enseignes et les panneaux de signalisation.
•Elle est aussi utilisée pour symboliser la responsabilité de la sûreté (santé-sécurité et la protection environnementale), la quiétude, l'assistance et la défense contre le danger (Physique, psychologique et environnemental).
•Elle constitue une vertu, un pouvoir de défendre tels ou telles contre un danger de nature quelconque.
•Donc, en tant que HSE, vous devriez être fier de ce que vous faites et accomplissez dans la vie d'autrui chaque jour sans relâche ⛑️✌️.
Depreciation is key in accounting.
It shows how a fixed asset's value drops over time.
This drop is due to wear, tear, and obsolescence.
It's crucial for businesses with assets like machinery, buildings, vehicles, and equipment.
In the cash flow statement, depreciation appears in the operating activities section.
It's added back to net income as a non-cash expense.
This step reduces taxable income without affecting actual cash flow.
Businesses depreciate assets like machinery, buildings, vehicles, and computers.
These items have limited useful lives.
Depreciation spreads their cost over these periods.
Several ratios help measure depreciation and its impact:
1. 𝗗𝗲𝗽𝗿𝗲𝗰𝗶𝗮𝘁𝗶𝗼𝗻 𝘁𝗼 𝗦𝗮𝗹𝗲𝘀 𝗥𝗮𝘁𝗶𝗼: Measures the proportion of sales used to cover depreciation.
2. 𝗗𝗲𝗽𝗿𝗲𝗰𝗶𝗮𝘁𝗶𝗼𝗻 𝘁𝗼 𝗙𝗶𝘅𝗲𝗱 𝗔𝘀𝘀𝗲𝘁𝘀 𝗥𝗮𝘁𝗶𝗼: Assesses the extent of depreciation relative to total fixed assets.
3. 𝗗𝗲𝗽𝗿𝗲𝗰𝗶𝗮𝘁𝗶𝗼𝗻 𝘁𝗼 𝗢𝗽𝗲𝗿𝗮𝘁𝗶𝗻𝗴 𝗜𝗻𝗰𝗼𝗺𝗲 𝗥𝗮𝘁𝗶𝗼: Evaluates the impact of depreciation on operating profitability.
4. 𝗔𝗰𝗰𝘂𝗺𝘂𝗹𝗮𝘁𝗲𝗱 𝗗𝗲𝗽𝗿𝗲𝗰𝗶𝗮𝘁𝗶𝗼𝗻 𝘁𝗼 𝗧𝗼𝘁𝗮𝗹 𝗔𝘀𝘀𝗲𝘁𝘀 𝗥𝗮𝘁𝗶𝗼: Indicates the proportion of asset value depreciated over time.
Depreciation greatly affects investments.
It lowers a company's profits, increases its taxes, and reduces asset values.
Knowing how a company handles depreciation reveals its financial and operational health.
This was originally posted on our Voronoi app. Download the app for free on iOS or Android and discover incredible data-driven charts from a variety of trusted sources.
Copper is considered an essential metal for the clean energy transition because it is a great conductor of electricity.
As a result, governments around the world have been encouraging the construction of new mines, and mining companies have been seeking new projects and acquiring existing mines to meet the growing demand.
In this graphic, we illustrate global copper production in 2023, based on data from the U.S. Geological Survey, Mineral Commodity Summaries, as of January 2024.
Most Copper Comes from South America
Chile and Peru account for one-third of the world’s copper output.
Country Region 2023E Production
(Million tonnes)
🇨🇱 Chile South America 5.0
🇵🇪 Peru South America 2.6
🇨🇩 Congo (Kinshasa) Africa 2.5
🇨🇳 China Asia 1.7
🇺🇸 United States North America 1.1
🇷🇺 Russia Europe/Asia 0.9
🇦🇺 Australia Oceania 0.8
🇮🇩 Indonesia Asia 0.8
🇿🇲 Zambia Africa 0.8
🇲🇽 Mexico North America 0.7
🇰🇿 Kazakhstan Asia 0.6
🇨🇦 Canada North America 0.5
🇵🇱 Poland Europe 0.4
🌍 Rest of World -- 3.1
World total (rounded) -- 21.5
Chile is also home to the two largest mines in the world, Escondida and Collahuasi.
Meanwhile, African countries have rapidly increased their production. The Democratic Republic of Congo, for example, transitioned from being a secondary copper producer in the late 1990s to becoming the third-largest producer by 2023.
Part of the growth in copper mining in Africa is attributed to high investment from China. Chinese mining companies represent 8% of Africa’s total output in the mining sector.
Within its territory, China has also seen a 277% growth in copper production over the last three decades.
In the U.S., Arizona is the leading copper-producing state, accounting for approximately 70% of domestic output. Copper is also mined in Michigan, Missouri, Montana, Nevada, New Mexico, and Utah.
A Dashboard Designer's worst nightmare is to have their dashboard criticized. Or worse..
To have their skills questioned.
There are so many things that can go wrong when developing dashboards.
These can include:
- A limited understanding of the data.
- An inability to access users
- A pressure from management
- The wrong tools stack
- A lack of resources
- A lack of method
- A lack of training
- A lack of time
- And more
And 90% of the time, when a project or dashboard fails, it's one or other of these two elements that suffers:
- The tool
- The developers
A tool can be changed.
But when it's the teams that suffer, it can cause a loss of credibility and confidence, and lead to tensions or people leaving.
It's unfair.
Most if the time, there's just one brick missing between the audience, the ambitions and the plan.
Over the last few months, I've been working on the dashboard assessment checklist, which aims to close this gap.
It's such a simple product that all you need is a pencil and a single sheet of paper.
Inside, I've concentrated several years' experience in observing what goes wrong in dashboarding projects.
With the checklist and the ready-to-draw diagrams, in just a few minutes you'll be able to visualize the 'identity card' of your dashboard, as well as its strengths and weaknesses.
This simple page linked to a dashboard will enable you to :
- Structure the project
- Identify the audience
- Identify the complexity of the data
- Identify the purpose of the dashboard
- Assess whether your developments comply with best practice
- And visualize inconsistencies between assessment components
For instance, once the assessment is complete, you will easily be able to see anomalies such as :
- A massive volume of data + an extra-granular level of detail + several years of data history = excessive loading time and business trying to put everything in the same dashboard
- An exploratory dashboard + 4 different purposes = Scope is overly broad and an audience with limited data maturity.
I'm pretty sure you'll be as excited to use it as I was to design it.
Source: Aurélien Vautier
🌍 Embark on a Journey Towards Sustainable Mining: A Must-Read Guide
In a world where the clarion call for sustainability rings louder each day, the mining industry stands at a critical juncture. The transition to greener practices isn't just a choice; it's an imperative. I'm thrilled to share with you the culmination of years of research, insights, and practical strategies in my latest e-book: Energy Transition in Mining: Ten Steps towards a Zero Carbon Operation.
🔍 What's Inside?
This comprehensive guide is a deep dive into the transformative steps mining companies can undertake towards achieving zero carbon emissions. From adopting renewable energy sources to revolutionizing mining with innovative technologies, the book outlines actionable strategies for an industry often viewed through a lens of skepticism when it comes to environmental stewardship.
🌞 Why This Book?
· Expert Insights: A mining engineer with over 20 years of experience, this e-book distills knowledge from the forefront of mining innovation and sustainability.
· Practical Steps: Beyond theoretical discussions, it presents a roadmap for integrating sustainable practices into the core of mining operations.
· Inspiring Change: Learn about the potential of electrifying mining vehicles, leveraging renewable energy, and the pivotal role of leadership in driving the shift towards sustainability.
💡 Who Should Read It?
Whether you're a professional in the mining industry, an environmental advocate, or simply intrigued by the intersection of technology and sustainability, this e-book offers valuable perspectives on steering the mining sector towards a greener future.
📘 Dive into the Discussion
Join us in this critical conversation on LinkedIn. Share your thoughts, experiences, and insights as we explore together the path to sustainable mining practices. Your voice is essential as we navigate this journey towards a more sustainable and responsible mining industry.
🗞️ Newsletter Decarbonization in Mining
Subscribe to our Newsletter to stay informed with the latest news on mine decarbonization as well as sustainable and responsible mining practices. Join our community and stay ahead in understanding the innovations and strategies shaping the future of the mining industry towards sustainability. Don't miss out on valuable insights and significant advancements in the journey towards greener and more ethical mining.
Libreta técnica de bolsillo dirigada a técnicos y operarios 👷🏻♂️🔧⚙️
Un pequeño aporte que recopila información relevante sobre el cuidado y mantenimiento a neumáticos gigantes que entrega nuestra organización a la gran minería.
Source: Victor Barrientos Boccardo
Source: Credits to Marcelo Andrés Cortes Pinto, Bailac
Commissioning is the process of verifying and ensuring that a system or equipment is installed, tested, and operated according to its design specifications and requirements.
The purpose of commissioning is to ensure that the system or equipment is safe, reliable, and meets the functional requirements of the project.
Commissioning typically involves several steps, including:
1). Design And Construction Review
2). Installation Verification
3). Pre Functional Testing
4). Functional Testing
5). Operational Design
6). Documentation And Training
Source: Mourad CHETTAH
Data visualizations are a vital component of a data analysis, as they have the ability to efficiently summarize large amounts of data through a graphical format. There are many chart types available, each with their own strengths and use cases. One of the trickiest parts of the analysis process is choosing the right way to represent your data using one of these visualizations.
When deciding on a chart type, first think about the type of role the chart will serve. Common roles for data visualization include:
• showing change over time
• showing a part-to-whole composition
• depicting flows and processes
• looking at how data is distributed
• comparing values between groups
• observing relationships between variables
• looking at geographical data
Next, consider the types of data you want to plot. The type of chart you use will depend on if the data is categorical, numeric, or some combina tion of both. Certain visualizations can also be used for multiple purposes depending on these factors. This book is organized with this approach in mind, with one chapter for each visualization role, each with multiple chart types to cover common types of data and subtasks.
Note that this document should only serve as a general guideline: it is pos sible that breaking out of the standard modes will help you gain additional insights. Experiment with not just different chart types, but also how the variables are encoded in each chart. It’s also good to keep in mind that you aren’t limited to showing everything in just one plot. It is often better to keep each individual plot as simple and clear as possible, and instead use multiple plots to make comparisons, show trends, and demonstrate rela tionships between multiple variable
Source: Aqsa Z
The main function of the lubrication of rolling bearings is to prevent or reduce contact between rolling and sliding surfaces. As a result, friction and wear are kept to a low level.
Source: Mourad CHETTAH
One of my favorite quotes, "The future is already here — it's just not very evenly distributed" by William Gibson, reflects the idea that advancements and innovations that will shape the future are already present in certain regions, industries, or sectors. However, the distribution and accessibility of these advancements are uneven. A prime example of such innovation is Artificial Intelligence (AI).
AI involves developing computer systems capable of tasks that typically require human intelligence. These include learning, reasoning, problem-solving, perception, linguistic understanding, and creativity.
AI encompasses a broad range of methodologies, technologies, and subfields. In mining and mineral exploration, we have been applying Machine Learning (ML) and other AI algorithms since the 90s. Recent advancements in Deep Learning and Natural Language Processing have allowed the development of AI models that can not only enhance efficiency and safety but also pave the way for innovative practices that will redefine the sector.
This article delves into the current and future applications of AI in mining, spotlighting innovations that, while not universally adopted, have the potential to reshape the industry.
Current Applications
AI is revolutionizing the mining industry by enhancing operational efficiency, improving safety, and reducing environmental impacts. Below are some of the transformative applications currently being deployed:
Geometallurgy: The application of ML in geometallurgy, one of AI's earliest uses in mining, involves analyzing complex relationships between ore attributes and processing plant performance. These relationships are then used to improve decision-making and optimize processing operations. More recently, some companies are using ML-based systems to adjust processing plant parameters in real-time, based on characteristics of the ore being mined. This leads to better recovery and throughput, enhanced supply chain efficiencies, and reduced energy consumption.
Exploration Targeting: AI algorithms can process vast amounts of geological data, outperforming traditional methods in speed and accuracy. ML algorithms are being used to generate exploration targets, assess their potential value, and optimize exploration strategies. This approach not only increases the chances of discovering new deposits but also reduces the environmental impact of exploration activities.
Core Logging: Using hyperspectral imaging for automatic core logging has been considered for decades. Over the last decade, some mining companies have spent millions on core scanning, storing vast amounts of data. However, these efforts often fell short of producing meaningful interpretations for effective geological modeling. Recent advances in deep learning have allowed this technology to start delivering on its promise.
Grade Control: Modern grade control optimizers apply AI algorithms for dig-line optimization. This is perhaps the lowest hanging fruit for the use of AI in a mining operation. The advantages of such approach have been documented for many years, but unfortunately the uptake of the technology has been slow. Software developers are starting to catch up, with new offerings now available by the major mining software providers.
Predictive Maintenance: Another existing application of AI in mining is predictive maintenance. By using ML algorithms to analyze equipment data, mining companies have been able to predict failures before they occur, minimizing downtime and extending the lifespan of fixed and mobile assets. This approach not only cuts costs but also boosts safety by lowering the risk of equipment-related incidents.
Automation and Robotics: The mining industry increasingly employs autonomous vehicles, robots and drones. These technologies, guided by AI, can operate in hazardous environments, performing tasks such as topographic surveys, drilling and transporting materials without human intervention. This not only improves safety, by reducing human exposure to dangerous conditions, but also enhances operational efficiency.
Data Mining: Commercial and company-owned AI platforms have been used to digest vast quantities of technical reports, financial disclosures, and press releases as well as mining news and technical articles. This creates an extensive knowledge base that can be consulted using natural language and advanced analytics. The most common users of such platforms are investors, analysts, deal makers, and exploration teams.
Stochastic Mine Planning: AI was applied in the early 2000s to develop the first stochastic mine planning method for open pit scheduling. Since then, a couple of decades of R&D sponsored by major mining companies, have developed a more sophisticated solution able to optimize whole mining complexes, from mine to market. The method can take a myriad of uncertainties into account. This method, in broad terms, uses a combination of stochastic optimization and AI techniques to obtain the optimal solution for the mine scheduling problem.
Worker Safety and Health Monitoring: AI-trained wearable devices are being used to monitor the health and safety of miners in real-time, detecting signs of fatigue, exposure to harmful substances, or physical stress. These systems can alert workers and managers to potential health and safety risks, significantly improving workplace safety.
Looking Ahead
The future of AI in mining is bright, with potential applications set to further transform the industry, making it safer, more efficient, and sustainable. Here's a glimpse into what the future holds:
Resource modeling: Resource modeling is a process where typically 80% of the time is spent processing data, while the remaining 20% is used to analyze and refine the results. Soon, autonomous systems, guided by AI algorithms, will be able to flip these statistics around. This will allow geologists to spend considerably more time stress testing models and refining estimates, resulting in higher confidence estimates and models that can be updated seamlessly as additional information becomes available.
Digital Twins: Before the end of this decade, we will see the proliferation of AI-based systems to create and run digital twins of mining assets and even whole company portfolios. These digital models will allow us to model and simulate the behavior and performance of entire mining complexes. Embedded with stochastic planning capabilities, these digital twins will help us optimize operations, predict failures, and test different scenarios for improved decision making. Importantly, it will break the infamous mine planning cycle, that mines go through every year, and allow for near-real-time updates that respond to the ever-changing conditions of a mining operation.
Mine Design: Developing mine designs is a laborious and time-consuming task, which requires considering multiple parameters such as resource models, mining methods, equipment selection, infrastructure, capital costs, operating costs, and many others. Generative AI models will enable more efficient design creation and allow for the evaluation of hundreds or thousands of scenarios with ease. This ability is key in determining the more efficient and cost-effective mine design for a given orebody in a timely fashion.
Environmental Monitoring and Sustainability: The future of AI in mining includes advanced systems for environmental monitoring and sustainability. AI can be used to monitor the impact of mining activities on ecosystems, predict environmental risks, and develop strategies to mitigate negative effects. These applications of AI are going to help achieve sustainable mining practices and adhering to increasingly stringent environmental regulations.
Integration with Renewable Energy Sources: AI can optimize the integration of renewable energy sources into mining operations. By predicting energy consumption patterns and coordinating with renewable energy availability, mining operations can reduce their carbon footprint and energy costs.
Collaborative Robots: Future advancements may see the rise of co-bots in mining – robots designed to work alongside humans. These AI-driven robots could undertake tasks that are unsafe or unsuitable for humans, while humans focus on supervisory and decision-making roles, creating a synergistic workforce.
In conclusion, the application of AI in the mining industry is not just a trend but a fundamental shift towards safer, more efficient, and sustainable operations. As technology advances, the potential for AI to transform the sector grows, offering promising prospects for the future.
This evolution requires ongoing investment, as well as a commitment to training and upskilling the workforce to adapt to an ever-changing technological landscape. Embracing AI is not merely an option but a critical step forward for the mining industry, ensuring its growth, sustainability, and resilience in the years to come.
Drone technology is reshaping the mineral exploration and mining sectors. With precise aerial surveys, drones offer cost-effective and efficient means to map terrain, identify mineral deposits, and plan mining operations. Drones offer unparalleled access to remote and hazardous areas, providing high-resolution data for geological analysis. Drones enhance safety, reduce costs, minimize environmental impact, and boost productivity in this vital industry while maximizing resource discovery.
Drone technology ensures sustainable practices and optimal resource management.
Hoy quiero compartir con ustedes un pequeño aprendizaje del gran mundo que es la planificación minera y las herramientas de los programas para la mencionada actividad💡🌐
En esta ocasión escribí este pequeño manual con pasos breves para que los jóvenes estudiantes como yo puedan tener una guía de los temas que están en la presentación, aquí se han empleado diversas herramientas del software Mineplan para definir un modelo de bloques, puesto que este es la base para comenzar con el proceso de planificación.
Sin más que decir, espero este pequeño aporte les sea útil y espero seguir compartiendo con ustedes más herramientas de este lindo programa.🤓✨✨
Why is this Issue so Important?
The metal price(s) are one of the most significant sources of uncertainty in mine project evaluation – this is because any variation from the expected metal price may considerably modify the results of the entire project value and, consequently, mislead strategic operational and economic decisions, investment decisions and even lead to erroneous conclusions of and for impairment decisions.
The Problem
Writing for the International Journal of the Central Bank, March 2018, Jorge Fornero and Markus Kirchner had this to say in their article entitled: Learning about Commodity Cycles and Saving Investment Dynamics in a Commodity-Exporting Economy: "...the evolution of copper price forecasts by professional forecasters of the CRU Group (reports in October of each year), as shown in figure 4. The rise of the spot price in the mid-2000s was not validated by higher forecasted prices on a medium to long-term horizon.
Instead, it was considered as a transitory price increase by the professional forecasters who predicted that the spot price would return to values of around 100 cents. Due to the crisis, the price fell and almost reversed the rise from 2003 to 2007, reaching a minimum of approximately 140 cents (where the annual average understates somewhat the dynamic evolution of the spot price). That decline was relatively short-lived, and after the crisis the copper price quickly recovered and exceeded its pre-crisis levels. However, the higher post-crisis prices were also accompanied by higher forecasted prices, as part of a process of gradual forecast revisions that had already started around 2007. In the following years, the forecasted prices reached values much closer to the effective spot price. Hence, the professional forecasters seem to have incorporated a more persistent price increase in their forecasts over time. More recently, as the commodity cycle has turned and prices have fallen, it has taken the forecasters again several years to adjust their expectations on future prices downwards."
It would be unfair to single out a single forecaster as no single forecaster has got it right in the past. Bloomberg published "consensus" forecasts of the gold price in 2015. Notably the long- term "consensus" forecast in 2012 was USD/oz 600. Fast forward to 2015 and the "consensus" forecast was circa US/oz 1 300; that is a 100% variation. Often it is underlined that the long-term price is not a "real" price and has to be discounted back to the year current years.
Assuming that the last price on the gold forecasts above represent the long-term view at the time of each forecast, then the "real" price at 3% using a mid-term exponent is calculated. In 2007; therefore, the long-term price assumed was USD/oz of gold 467 and in 2012 USD/oz 1 353. Cynically, in 2007 one could have randomly picked a price between USD/oz 467 and USD/oz 1 353 and been in the reasonable prediction range - with the wisdom of hindsight. On August 22, 2011 gold reach an historic high of 1917.90 - well above USD/oz 1, 353. At the time of writing the price is USD/oz 1 194.80, closer to the 2011 long-term forecast. It is perhaps a fair statement that volatility plays havoc with forecasters forecasts.
So the problem is simple - one cannot with any degree of confidence rely on forecasters long-term forecasts of metal prices, and yet so much reliance is placed upon these forecasts. An even more tragic reality is that when the forecasts are averaged ad named "Consensus" they assume an even greater weighting. It is safe to say that the average of wrong remains wrong.
Perhaps Warren Buffets comment that " Forecasts tell you a great deal about the forecaster; they tell you nothing about the future," has some substance. One thing is clear; forecasters forecasts are always wrong and yet the industry places significant confidence on the collective opinion despite the collective forecast that in addition to being wrong is also insanely fluid. Perhaps it is time to seriously debate alternatives to the application of long-term price forecasts especially when it relates to the declaration of Mineral Reserves and Ore Reserves and the determination of impairment indicators.
Here's the original post:
You know them: colleagues in a meeting who don’t really add anything. Or worse, who disturb your meeting through their toxic presence. Avoid these four types.
My general attitude toward people is very positive. I always assume people want the best, not just for themselves but also for others and their organizations. And also that they do their best to achieve this.
This works most of the time, but sometimes I get disappointed by people that don’t live up this expectation. Through their presence, they add negativity to a meeting, process or collaboration.
Originally known as “the dangerous animals of product management,” there are four types of such people: the Zebra, the Hippo, the Wolf and the Rhino. This is what they mean and how to deal with them in your strategy meetings:
ZEBRA - Zero Evidence But Really Arrogant
ZEBRAs think they know it all but rely on their opinion rather than any actual evidence. To stave off the ZEBRAs in your midst, make sure that you’ve got data to back up your decisions. Come up with quick experiments you can run to test ideas and gather evidence.
HIPPO - HIghest Paid Person’s Opinion
It can be tempting to give in to the HIPPOs (founders or CEOs who want to make all the decisions), but don't let them steer you off course. Bring everything back to your vision and objectives--if the HIPPOs aren't aligned with these, you could be headed for dangerous waters.
WOLF - Working On Latest Fire
The WOLF has a short attention span and a temptation to jump from one problem to the next. This will disrupt your team's focus and effectiveness, making you easy prey for your competitors. Create a process for collecting feedback about problems and only consider these along with all other requests.
RHINO - Really Here In Name Only
The RHINO is just there to collect a paycheck without contributing much to the team. They might not be actively impeding your decision-making, but they're certainly not helping out much, either. Having a clearly defined prioritization process can help ensure all your team members understand how decisions are made and give them the confidence to actively participate.
Now think about your latest strategy or team meeting, or about the people around you more generally. Which toxic personalities do you recognize?
If you cannot avoid them next time, this awareness should at least help dealing with them a little more effectively.
Credits to Jeroen Kraaijenbrink and Timothy Timur Tiryaki, follow them for more insightful content.
Source: Business Infographics
Source: Credits to Jeroen Kraaijenbrink and Timothy Timur Tiryaki
This e-Book by Amitava Dutta aims to provide comprehensive insights into the challenges posed by ore dilution in open pit mining, how to minimize dilution, optimize equipment navigation, and ensure precise ore control.
Source: Omar Helal
Le but de ce cours est de permettre une meilleure compréhension des pompes et principalement de leurs équipements.
Les pompes sont des appareils mécaniques servant à véhiculer des liquides d’un point A, à un point B. Elles permettent, notamment, de prendre un liquide à la pression P1 et de le porter à la pression P2 (avec P2 > P1).
Pour véhiculer un liquide d'un endroit à un autre, la pompe doit fournir une certaine pression appelée hauteur manométrique totale, cela dépend des conditions d'aspiration et de refoulement.
Source: Mourad CHETTAH
The CFO should act as a business partner to other CXO roles.
What are some concrete areas where the CFO can be a partner?
Here's an overview of seven CXO roles, including what each is responsible for...
CEO
- Provide financial insights and data to inform strategic decisions.
- Develop financial models to assess the impact of various strategies.
- Ensure financial transparency to support stakeholder communication.
- Collaborate on budgeting and resource allocation to align with the vision.
- Monitor key performance indicators (KPIs) to track the company's performance.
COO
- Provide financial data for optimizing operational processes.
- Assist in cost control and resource allocation to improve efficiency.
- Evaluate the financial impact of operational decisions.
- Implement financial controls to mitigate operational risks.
- Collaborate on capital investments and resource planning.
CSO
- Collaborate on setting realistic sales targets.
- Provide financial data for sales forecasts and revenue tracking.
- Assist in pricing strategies to optimize profitability.
- Monitor and analyze the financial impact of sales initiatives.
- Ensure alignment between sales and financial goals.
CMO
- Allocate marketing budgets effectively based on financial analysis.
- Measure and report on the financial impact of marketing campaigns.
- Provide data for market research and customer segmentation.
- Collaborate on pricing strategies and revenue forecasts.
- Ensure alignment between marketing spending and revenue goals.
CTO
- Assist in budgeting for technology investments.
- Evaluate the financial impact of technology projects.
- Ensure compliance with IT-related financial regulations.
- Collaborate on cost-effective tech solutions.
- Monitor ROI on technology investments.
CHRO
- Provide financial data for compensation and benefits planning.
- Collaborate on budgeting for recruitment and training.
- Monitor labor-related costs and identify cost-saving opportunities.
- Support HR in aligning talent strategies with financial goals.
- Employee benefit cost management
CLO
- Collaborate on budgeting for legal expenses.
- Provide financial data for risk assessment and mitigation.
- Assist in compliance reporting and financial impact analysis.
- Support legal teams in cost-effective contract negotiations.
-Legal cost management
Did we miss any critical CXOs?
Do you have more suggestions for how the CFO (and Finance) can best be a business partner to other CXOs?
Source: Anders Liu-Lindberg
The notes are intended to provide an insight into practical rock engineering to students, geotechnical engineers and engineering geologists. Case histories are used, wherever possible, to illustrate the methods currently used by practicing engineers. No attempt has been made to include recent research findings which have not yet found their way into everyday practical application. These research findings are adequately covered in conference proceedings, journals and on the Internet.
Source: www.rocscience.com/assets/resources/learning/hoek/Practical-Rock-Engineering-Full-Text.pdf
Dans 8 cas sur 10, la victime est le conducteur de l’engin. Il est le plus souvent écrasé par sa machine, et s'il est éjecté de la cabine, il peut se retrouver coincé sous son engin.
Source: Riadh BENALI
Les indicateurs de performance sont des paramètres de mesure et de contrôle de l’efficacité des opérations logistiques d’une installation. Également appelés Key Performance Indicators (KPI en anglais), ces valeurs de performance permettent d’identifier les forces et les faiblesses liées à la gestion des stocks.
Grâce à ces indicateurs de performance, le responsable logistique peut surveiller les performances des processus, identifier les opportunités d’amélioration et prendre des décisions en fonction de la productivité réelle de chaque zone de l’installation.
We all do at least one of them.
I use filler words. My filler words of choice on podcasts are “you know?”
That's completely normal, and speaking is always work in progress. It is one of the easiest skills to learn and one of the hardest to master.
Are you working to improve any of these?
Credits to Oliver Aust
A - Aptitude
B - Behavior
C - Competencies
D - Diversity
E - Evidence
F - Flexibility
G - Growth
H - Holistic
I - Inclusive
J - Job simulation
K - Knowledge
L - Leadership
M - Motivation
N - Non-traditional
O - Onboarding
P - Potential
Q - Qualitative
R - Results-oriented
S - Soft skills
T - Technical skills
U - Unbiased
V - Values
W - Work ethic
X - X factors
Y - Yield
Z - Zeal
Credits to Wouter Durville
And these are traditional procurement skills.
The skills that fuel procurement.
In the Age of tech and AI, it’s easy to think that AI can cover a lot of what we can do.
But the true importance of knowledge isn’t going anywhere.
More than ever, Procurement needs highly skilled pros to orchestrate tech and AI to deliver value to the business.
Credits to Daniel Barnes
⏺️Le rôle du contrôle du minerai (ore control) dans une mine est essentiel pour optimiser l'exploitation des ressources minérales et maximiser la valeur extraite. Voici les principaux rôles et procédures liés au contrôle du minerai:
☑️Rôles:
1. Échantillonnage et analyses: Prélever des échantillons représentatifs du minerai extrait et les analyser pour déterminer leur teneur en minéraux d'intérêt (métaux, etc.).
2. Modélisation des teneurs: Utiliser les données d'échantillonnage pour mettre à jour continuellement le modèle de teneurs, afin de guider l'exploitation minière.
3. Délimitation des zones d'exploitation: Définir les zones à haute teneur qui doivent être extraites en priorité, ainsi que les zones de dilution.
4. Suivi de la production: Suivre en temps réel les tonnages et teneurs du minerai extrait, et les comparer aux prévisions.
5. Réconciliation: Réconcilier régulièrement les réserves modélisées avec la production réelle, et ajuster les plans d'exploitation en conséquence.
☑️Procédures:
1. Échantillonnage systématique des fronts de taille et des haldes de minerai selon un maillage prédéfini.
2. Préparation et analyse des échantillons en laboratoire (concassage, pulvérisation, analyses chimiques/minéralogiques).
3. Saisie des données d'analyses dans le système de gestion des données minières.
4. Mise à jour des modèles de teneurs à l'aide de logiciels spécialisés (krigeage, etc.).
5. Génération de plans d'exploitation à court et moyen terme en fonction des modèles mis à jour.
6. Communication régulière avec les équipes d'exploitation pour ajuster les plans si nécessaire.
7. Réconciliation périodique des réserves exploitées avec le modèle initial.
☑️Le contrôle du minerai est un processus itératif essentiel pour optimiser la productivité et la rentabilité d'une exploitation minière.
Sublevel stoping is a commonly used method in large scale mining. It is a versatile and productive method that is primarily used for large ore bodies with a steep dip, regular shape and defined ore boundaries.
Rock bolting is the most effective and the most economical mean of supporting excavations in rock in both mining and civil engineering applications. Rockbolts can be used to control all type of instabilites except those invelving extremely weak and soft ground such as that which may occur in a major fault zone.
Source: Syed Shah
Le forage à circulation inverse est une technique de forage destructif. Ici on utilise un marteau fond de trou (MFT) qui permet de récupérer les échantillons en continu à l'aide d'air comprimé utilisé comme fluide de circulation.
Il est dit à circulation inverse puisque puisque pendant que les échantillons remonte par l'intérieur des tiges, l'air lui circule dans l'espace annulaire.
Ce mécanisme réduit donc de manière considérable le contact entre les échantillons et la paroi de forage à l'opposé des méthodes ordinaires.
✓ Le forage RC est utilisé dans le domaine minier pour le Grade control.
✓ L'outillage est constitué d'un bit monté sur un MFT d'un mètre de longueur. Cet assemblage est fixé sur la première tige. Chaque tige a une masse de 150 Kilogramme avec un diamètre de 124 millimètres.
✓ Elle permet d'effectuer des forages dans de la roche dure jusqu'à 230 mètres de profondeur.
✓ Avant de commencer le forage RC, le géologue ou spotter doit vérifier la correspondance entre le plan et les points de sondage.
✓ L'objectif majeur ici est l'identification des blocs minéralisés et le stérile dans le but d'améliorer le modèle géologique.
Source: TSAYO BOGNING GAIUS MARCIAL
Video Lecture Series: Explore six exclusive video lectures covering a variety of topics in Rock Mechanics Engineering.
The Development of Rock Engineering pProvides a brief history of the field of rock engineering, with a look at a number of interesting case studies and examples.
La teneur de coupure (COG) est généralement définie comme "la quantité minimale de produit métallique de valeur qu'une tonne métrique de matériau doit contenir avant d'être envoyée à l'usine de traitement" ou comme "une limite artificielle délimitant la minéralisation à faible teneur et le minerai techniquement et économiquement viable qui peut être exploité avec profit".
Par conséquent, les teneurs de coupure sont utilisées pour sélectionner les blocs de minerai des blocs de déchets à différents stades de l'évolution de l'estimation des ressources/réserves minérales d'un gisement minéral (par exemple, au cours des phases de prospection et d'exploitation).
Si la concentration de matière dans la minéralisation est supérieure à la teneur limite, elle est définie comme du minerai ; inversement, si la concentration de matière est inférieure à la teneur limite, elle est considérée comme un déchet.
Toutefois, des méthodes de mélange (minéralisation à faible teneur et à haute teneur) sont couramment utilisées dans les mines pour une utilisation efficace des ressources minérales.
Annel a classé les nombreux facteurs qui influencent la teneur de coupure en trois catégories :
1***Géologique par exemple, la minéralogie, la taille des grains, la présence d'éléments nocifs, la forme et la taille du gisement, la complexité structurelle ou les problèmes d'eau.
2***Économique par exemple, l'accessibilité aux marchés, la disponibilité de la main-d'œuvre, les conditions actuelles d'exploitation et les prix actuels des métaux, les facteurs politiques et fiscaux, le coût de l'élimination des déchets et de la remise en état, ou les coûts d'investissement et les taux d'intérêt.
3***Méthodes d'exploitation minière par exemple (mines à ciel ouvert ou souterraines) , la modification d'un seul critère ou la combinaison de plusieurs d'entre eux entraîne une modification de la teneur limite et de la teneur moyenne du gisement.
Une teneur de coupure élevée peut être utilisée pour augmenter la rentabilité à court terme et la valeur actuelle nette d'un projet minier, mais l'augmentation de la teneur de coupure est également susceptible de réduire la durée de vie d'une mine.
Cette durée de vie plus courte peut également avoir des effets socio-économiques plus importants, avec une diminution du nombre d'emplois à long terme et une baisse de la valeur de la mine ,des bénéfices aux employés et aux communautés locales.
Bien que la planification de la production à long terme d'une exploitation minière à ciel ouvert dépende de plusieurs facteurs, la teneur de coupure est probablement l'aspect le plus important, car elle fournit une base pour la détermination de la quantité de minerai et de déchets au cours d'une période donnée .
Source: Alpha Bayo
Source: Credits to Mineral Resource (From Exploration to Sustainability Assessment)
The goal of this guideline is a compilation of selection criteria for bolt, which should be considered during design stage. These are complemented by properties of bolting systems and bonding agents, detailed descriptions of common bolting systems and installations procedures, criteria for the types of corrosion protection and quality management for bolts as well as testing of bolt properties. Tis information is intended to assist the designer as well as underground engineer to choose the technically most appropriate bolt type(s) for each expected ground condition and to set minimum requirements for chosen bolt types ensuring a high level of safety during construction.
Source: Syed Shah
Shout out to one of our amazing clients TestGorilla for the important work they do in building progressive teams.
Their product helps remove bias from hiring decisions by looking past the CV and assessing the actual qualities of the individual in a fairer, more objective way.
The facts on skills-based hiring tell their own story:
✅ 92% of employers believe it is more effective than CVs for identifying talented candidates.
✅ 89% believe it is more predictive of success in the role.
✅ 82% believe employees hired via skills-based hiring stay longer in their roles.
Nearly every company I speak with talks about promoting diversity and hiring great talent, but too many are found wanting when I ask, "okay great, how are you doing that?".
Source: Ross Johnston
This handbook aims to be accessible to the major public. This work is meant to be used as a pedagogical tool and as a reference book. The following book represents personal reflections on the probabilistic nature of measures in science. In a classical curriculum these aspects are seldom, if not at all, dealt with. It is important that the experimental and practical foundations of science are complementary to the theoretical lectures. There is a scientific beauty that arises from the interaction between theory and experience.
While introducing the fundamental principles of statistics, this book explains how to determine uncertainties in different experimental situations. Many examples come from courses and practical work done in preparatory classes for the engineering schools
Source: Dr.Vaishali Dixit
In contrast to category procurement for production materials and services, CAPEX procurement follows different rules. The challenge for procurement lies in the fact that an investment must first be planned (scope, costs, schedule) before sourcing can begin - and even planning often requires the procurement of a planning service.
Anyone who has ever carried out CAPEX project procurement will be familiar with these challenges. Here I would like to present a process on how the various CAPEX projects of a company or plant can be better organised as a whole.
It all starts with annual investment planning as step 1, which should take into account all future CAPEX expenditure. This planning usually consists of a few known projects, some placeholder projects and potential emergencies or as yet unknown customer projects. Purchasing should already be involved at this point and then develop project procurement plans for the known topics together with the engineers (e.g. what should be sourced, cost estimate, possible suppliers). Procurement should be an integral part of the final budget approval and have checked this for plausibility.
Step 2 is followed by the individual project tasks, such as analysing the supplier market and defining the individual sourcing strategies. This is followed by the inquiry rounds. During the process, a conscious distinction is made between a technical clarification meeting and a commercial negotiation. Purchasing and the engineers should take part in both discussions, with the former being led by the technicians and the later by the procurement department. The greatest potential for optimisation is always to be found in the technical aspects of project execution, where it is important to work together as a team. Procurement should be a permanent member of the project team and accompany the project through to final completion.
The last step 7 is again a superordinate step across all CAPEX projects of the organisation. Here, the performance of all suppliers involved in the various projects is analysed. Just as a quick note, the supply of the right spare parts should already be a task for the projects and not just for operations.
How is you CAPEX procurement process working?
Is dashboard UI taking a backseat in your company?
This could lead to a poor user experience.
In the guide below, I present some simple techniques to ensure you get the basics right for the core UI of dashboards:
👉 Filter pane functionalities and options
👉 Navigation pane layout and structure
👉 Using guidelines and annotations
By following these simple tricks, you will prevent your users from becoming frustrated and wondering how the dashboard works.
The real vision we should have about mine infrastructure. Is it really worth all the investment in equipment, people and projects?
In open-pit mining, ore and waste rock are transported along roads, between benches, roads and access roads that lead to deposits, stockpiles, crushers and processing plants. Expenditure on loading and transport operations can reach up to 50 per cent of the amounts invested in a mine. Loading and transport equipment is sized according to the mine's needs, with the aim of achieving low ore extraction costs. In line with this strategy, the mine's infrastructure is a crucial activity for achieving better utilisation of the material transported, as well as high productivity from the transport equipment.
The Fraser Institute Annual Survey of Mining Companies was sent to approximately 2,045 explorations, development, and other mining-related companies around the world.
Thesurvey was conducted from August 16, 2023 to January 9, 2024. The companies that participated in the survey reported exploration spending of US$4.2 billion in 2022 and US$4.1billion in 2023.
The 2023 results from the Permit Times for Mining Exploration publicationare included in this year’s survey.
Source: Adele Rouleau
Source: Credits to Julio Mejía & Elmira Aliakbari, Fraser Institute
---> The Night Before
SMART Goals
Set Specific, Measurable, Achievable, Relevant, and Time-bound goals to guide your day.
Eisenhower Matrix
Prioritize tasks by urgency and importance to focus on what truly matters.
Find Your Peak Performance Time
Identify when you are most productive and plan your most challenging tasks for that time.
---> The Morning Of
Two-Minute Rule
If a task takes less than two minutes, quickly clear small tasks immediately in the morning.
Time Blocking
Schedule specific blocks of time for different tasks to maintain focus and efficiency.
---> Throughout the Day
Task Batching
Group similar tasks together to reduce the mental load of switching between activities.
Pomodoro Technique
Work in focused intervals (typically 25 minutes) followed by short breaks to maintain high productivity.
Kanban Board
Visualize your tasks and progress using a Kanban board to stay organized and on track.
---> End of Day Review
Closing out the Day
Take 15 minutes at the end of each day to review your accomplishments and plan for the next day.
Productivity Journaling
Reflect on your day and note successes and improvement areas to enhance productivity.
Start doing ONE of these in each category and watch your productivity soar.
Thank me later.
Save this cheat sheet for your team 📌
Here's a sneak peek of what's inside:
→ 6 Compensation KPIs
→ 7 Employee Performance KPIs
→ 7 Employee Experience KPIs
→ 20 Employment KPIs
→ How to implement and manage these KPIs
In a world where data drives decisions, it's crucial to focus on what truly matters.
These KPIs are your secret to:
- Understanding employee engagement.
- Measuring training effectiveness.
- Tracking recruitment success.
- Analyzing diversity and inclusion efforts.
Are these KPIs part of your HR strategy?
Credits to Wouter Durville
In this episode of Fresh Thinking by Snowden Optiro, join General Manager Tarrant Elkington and Allan Earl, Executive Consultant as they discuss the mining aspects of Technical Due Diligence.
This podcast video at a glance:
0:10 Tarrant introduces the speaker, Allan Earl, and outlines the podcast topic.
1:00 Allan provides an overview of Technical Due Diligence in the mining industry.
2:35 Allan delves into the initial aspects considered when commencing a Technical Due Diligence review.
4:30 When all data is organized, Allan discusses the initial focal points, starting with underground mines.
12:00 Allan elaborates on the distinctions in technical due diligence for open-pit mines.
14:07 Allan clarifies whether his due diligence process primarily involves data review or other tasks.
17:10 Allan compares and contrasts due diligence requirements between operating and developed mines.
Join our experts as they explore the topic of Technical Due Diligence for Mining in episode 58 of the Fresh Thinking podcast.
If you'd like to connect with Tarrant and Allan, please reach out to them at contact@snowdenoptiro.com.
This video podcast is also available as an audio podcast on @Libsyn, @Spotify, @Apple Podcasts, @Google Podcasts.
These podcasts are for those working in the mining industry.
Snowden Optiro - Mining Advisory, Consulting and Professional Development.
Source: Diana Ross
Why is your company spending so much money on this dashboard if it's going to be buried in the depths of a platform that's too difficult for users to access?
This is one of the questions I ask Data Analysts when a dashboard should have been a success, but isn't in the end.
How many actions does the user have to perform before reaching the dashboard?
You've never counted, have you?
And yet it takes an average of 17 clicks to reach the data.
Imagine having to press 17 different buttons to turn on your TV, start your car...
This is another UX flaw in the world of BI, and it's also why Dataviz Clarity aims to bridge these two worlds.
Both can learn from each other and The Dashboard Assessment will be one of these bridges.
Source: Aurélien Vautier
When Zenger Folkman studied the leaders who are most effective at coaching, we saw clear correlations between their coaching effectiveness and its impact on their direct reports.
Our data consistently shows strong correlations between a leader’s coaching effectiveness and measures of employee commitment and engagement.
Marshall Goldsmith and Chip R. Bell have published some great work on how to have an effective coaching dialogue.
Coaching, like the broader disciplines of leadership and management, will always contain many characteristics of an art form.
👥 No two people will practice it exactly the same way.
The applications are so complex and different that merely responding to the situation calls for new and different behavior.
It will never be a pure science.
The world of coaching in business organizations and large public agencies can gain a great deal from embracing good ideas and practices from every source, including the major helping professions. Only in that way will it ever achieve its potential contribution to every organization.
Learn more in Zenger FOlkman's leadership study, "Bringing Science to the Art of Coaching." (Link in comments)
Sketchnote: Tanmay Vora
1. How to read an annual report
2. How to analyze stocks
3. Thinking Fast and Slow
4. Ten tips from Warren Buffett
5. The power of compounding
6. How people will remember you
7. Biases that harm your decision-making
8. The psychology of human misjudgment
9. EBITDA 101
10. McKinsey's Valuation Book
Source: Pieter Slegers
Drilling fluids are becoming so specialized, most companies now have a mud engineer on duty at all times to keep the mud in good condition. The Mud Engineer:
- is responsible for testing the mud and for prescribing mud treatments in order to keep mud weight, properties, and chemistry within recommended limits.
- must give detailed recommendations in order to optimize the achievement of technical and economical drilling aims
Source: Mourad CHETTAH
This Guidance is designed to provide Borrowers with a practical understanding of Supply Chain Management (SCM). The Guidance introduces SCM practice and describes how SCM relates to each stage of the procurement lifecycle to best improve supply chain resilience and reduce procurement risks to support a successful project outcome. The Guidance provides Borrowers with tools and approaches on “how to” incorporate best practice SCM, including mapping supply chains, identifying weaknesses, and advising on how best to increase supply chain resilience/security and supply. The Guidance is cognizant of the increasing complexity of global supply chains, associated vulnerabilities to shocks and crises, and the ensuing challenges in managing these supply chains.
This Guidance reflects emerging good practice in SCM with a particular focus on infrastructure supply chains, which is a rapidly evolving space. The Guidance follows the Bank’s Procurement Process, but equally could be used by Borrowers for projects across their entire portfolio. The application of the tools and approaches discussed in this Guidance should be proportionate to the risk and value of the project and cognizant of the resources that the Borrower has available (e.g., for low risk/low value projects it may be that minimal SCM is needed). When developing SCM specific requirements or obligations, it is important to understand the specific supply market, consider what the supplier can realistically control, and set requirements or obligations accordingly
Source: Mitesh Bhatt
This refers to essential principles guiding effective procurement practices within organizations. These rights are fundamental to ensure the procurement processes are 𝗲𝗳𝗳𝗲𝗰𝘁𝗶𝘃𝗲 𝗮𝗻𝗱 𝘀𝘂𝗰𝗰𝗲𝘀𝘀𝗳𝘂𝗹 𝗶𝗻 𝘀𝘂𝗽𝗽𝗹𝘆 𝗰𝗵𝗮𝗶𝗻 𝗺𝗮𝗻𝗮𝗴𝗲𝗺𝗲𝗻𝘁.
The 5 procurement rights are interconnected, meaning that each one affects the others. Therefore, the importance of these rights lies in how failing to achieve one can impact the overall success of attaining all five.
The 5 Rights are,
𝟭. 𝗥𝗶𝗴𝗵𝘁 𝗤𝘂𝗮𝗹𝗶𝘁𝘆: This refers to purchasing the right quality of goods or services that meet the organization's standards and requirements
𝟮. 𝗥𝗶𝗴𝗵𝘁 𝗤𝘂𝗮𝗻𝘁𝗶𝘁𝘆: Procurement must ensure the organization's purchase of the correct quantity of goods or services.
𝟯. 𝗥𝗶𝗴𝗵𝘁 𝗣𝗹𝗮𝗰𝗲This involves delivering purchased items to the right location within the organization's supply chain
𝟰. 𝗥𝗶𝗴𝗵𝘁 𝗧𝗶𝗺𝗲: Purchased items should be delivered or available at the right time to avoid delays and minimize costs associated with holding inventory.
𝟱. 𝗥𝗶𝗴𝗵𝘁 𝗣𝗿𝗶𝗰𝗲: Procurement professionals need to secure reasonable, fair, competitive, and affordable prices
🤔¿Trabajas por objetivos?
Betania Scarponetti, nos muestra en un post que si tu respuesta es afirmativa, crees firmemente en la importancia de establecer metas claras y alcanzables para guiar tu trabajo y medir tu progreso 📈.
Los objetivos no solo proporcionan dirección, sino que también son una fuente de motivación y enfoque. Al trabajar con un enfoque orientado a metas, puedes concentrar tus esfuerzos en tareas específicas que contribuyen al éxito general. Además, entiendes que los objetivos pueden evolucionar con el tiempo ⏳, y estás preparado para ajustar las estrategias según sea necesario. Finalmente, estás abierto a recibir retroalimentación constructiva para mejorar continuamente y alcanzar niveles más altos de rendimiento 💯💪🏻
Sin embargo, no solo se trata de contar solo objetivos ambiciosos, sino también de la necesidad de contar con indicadores efectivos para asegurar su éxito. 💡 Los indicadores son como faros que iluminan el camino, dándonos información valiosa sobre nuestra trayectoria y destacando cualquier ajuste necesario en nuestro enfoque.
Es por ello que te compartimos el documento del Departamento Administrativo de la Función Pública para que puedas construir de manera correcta tus indicadores de gestión.
Credits: Departamento Administrativo de la Función Pública
✳ The floating cone technique is used to determine the final pit limit, generating the optimal pit in which revenue is maximized and defining the mining sequence within the pit. 👷♂️
To define the cone, you must have the average ore grade values, the stripping ratio and cost and income parameters per block. The block model is converted into an economic model, examining the net values of the blocks within the cone, the final pit limit can be determined.
✏ The steps to define the cone in a section (2D) are as follows, considering a slope angle of 45°:
1️⃣ The cone is moved from left to right along the first row of blocks in the section, if there are positive blocks they are removed, since there is a revenue because there isn´t material over of them.
2️⃣ The vertex of the cone is moved to the second line, it is moved from left to right stopping at the first positive block, if the sum of all the blocks is positive, the blocks are removed, if the sum is negative the cone is discarded and move the vertex to the next positive block in that row and repeat the process.
3️⃣ This process is repeated from left to right and top to bottom throughout the section's block array until there are no more blocks that can be removed.
4️⃣ The profitability of the section is found by adding the values of the blocks removed.
5️⃣ The overall stripping ratio is determined from the positive and negative values of the blocks.
The image shows a simple example of an optimal final pit, but work has been done to improve the procedures and have procedures such as the Lerchs and Grossmann algorithm or the Pseudo flow that will be seen in future posts 🗓 . An optimal final pit is defined with the following conditions:
✅ Maximum profit.💰
✅ Maximum net present value.💲
✅ Maximum extraction. ⛏
The floating cone was one of the first techniques to define an optimal pit, however it has been shown that if blocks are investigated individually,🚨 a single block of ore may not justify extraction of the material above it 🚨, while combinations of the cones prove to be profitable, which leads to errors in the profitability of extracting the ore.⚒
📝 Hustrulid W., Kuchta M., Martin R., Open pit mine planning and design, CRC Press.
The 61% problem you can fix today:
61% of companies end up hiring the wrong person.
That’s a huge waste of time, money, and energy.
The problem is that most interviewers
rely on the same old interview questions.
I used to make the same mistake.
After 20 years of interviewing hundreds of people, I’ve
developed better questions to find out who they are.
These questions are not the typical ones you hear everywhere.
They are designed to:
• Determine fit and compatibility
• Assess values, motivations, and goals
• Gauge communication, collaboration, leadership
• Test critical thinking, creativity, and problem-solving
You don’t have to ask all of them.
Pick the ones that fit how the conversation is going.
You’ll be amazed by how much you will learn.
What questions would you add?
(Source: Robert Half)
This in-house manual is designed to assist NTGS staff in organising stratigraphic drilling programs and supervising on site.
It is directed to those with little or no previous experience of drilling. It gives in-house guidelines and does not purport to reiterate government policy concerning drilling, unless this is explicitly acknowledged.
It is not a textbook on drilling nor is it intended to be as comprehensive as company manuals. For comparison, the 1996 Santos onshore drilling operations manual is over 400 pages in length, including 58 pages of forms.
In the present manual, much of the drillers’ jargon is explained in references listed in Appendix 1, and a glossary of common abbreviations provided in Appendix 2.Australian Standards referred to throughout the document are shown in the format AS1234. The symbol % is used to indicate guidelines, procedures and checks for the NTGS site Representative. The symbol is used to distinguish worked examples of calculations. An index provides quick reference to specific topics. It is anticipated that this document will be revised regularly, and any corrections or comments should be directed to the author or the Editorial Geologist
Source: TSAYO BOGNING GAIUS MARCIAL, LinkedIn
In this 22-minute documentary Peter Tom Jones (Director KU Leuven Institute for Sustainable Metals and Minerals - SIM2 KU Leuven) searches for answers to Europe’s seemingly problematic relationship with primary #mining of #energytransition #metals.
#mining #criticalminerals #sustainability #eugreendeal #energystorage #electricalvehicles #lithiumionbatteries #rareearths #copper #cobalt #nickel #lithium #horizoneurope
🔍 Purpose:
Budgeting is about setting financial targets and creating a plan to achieve them. It's a roadmap for your business's financial journey.
Forecasting, on the other hand, is about predicting financial outcomes based on current trends and data. It's like a weather forecast for your business's financial health.
⏳ Time Horizon:
Budgets are typically set for a specific period, usually a fiscal year.
Forecasts are more flexible, often updated monthly or quarterly to reflect the latest data.
🔄 Flexibility:
Budgeting is relatively static, a set plan you aim to follow.
Forecasting is dynamic, constantly adapting to new information and market trends.
📊 Metrics and Evaluation:
Budgeting focuses on variance analysis, comparing actual results to the budget.
Forecasting evaluates trend accuracy, how well predictions match reality over time.
🛠️ Tools and Data:
Budgeting relies on historical data and established goals.
Forecasting uses statistical tools and models, incorporating real-time data for accuracy.
🤔 Decision Making:
Budgets guide spending and investment decisions.
Forecasts inform strategic planning, highlighting potential opportunities or risks.
🔮 Risk Management:
Budgeting controls expenditure, reducing financial risks.
Forecasting identifies future risks and uncertainties, allowing proactive measures.
🤝 Collaboration:
Both require collaboration across departments for accurate and effective implementation.
Are you ready to master your financial strategy? Let's connect and discuss how budgeting and forecasting can fuel your business's success. Share your thoughts below or drop a message!
Source : Tejas Parikh (ACMA, MBA), LinkedIn
The Australian Centre for Geomechanics has developed this safety training video for underground metalliferous mine workers.
Overview
All underground mine workers will be exposed to drilling and blasting processes. The aim of this video is to provide workers with the critical knowledge on drilling and blasting to aid appreciation of the importance of these mining processes and their related hazards. The video features an introduction to the rock breaking process in mining, followed by a section on how to handle, store and transport explosive products. The third part of the video covers development drilling and blasting practices; and the fourth part discusses production drilling and blasting.
Target Audience
Underground mine workers - the need to identify the potential hazards of working near or with explosives, and the protocols of re-entering a working area after blasting.
Workers responsible for development and production drilling and blasting activities. This video will review drilling and blasting fundamental concepts that are critical to achieving optimal rock breaking outcomes.
All industry stakeholders - those keen to learn more about drilling and blasting in underground mines.
Project Sponsors: Barrick Gold of Australia; BHP Billiton Olympic Dam; Dyno Nobel Asia Pacific; Gold Fields Australasia; Newmont Asia Pacific; Orica Mining Services; Xstrata Zinc.
Credits: Australian Centre for Geomechanics
Source: Credits to : Australian Centre for Geomechanics
For millennia people have purchased and relied on metals for decorative and industrial uses, figuring out their values based on their practical applications and visual luster.
Today, precious and industrial metals markets quote figures in millions and billions as they exchange thousands of ounces, with varying densities and values of metals making it difficult to compare them.
Using price data from TradingEconomics, this graphic visualizes how much of each metal you can buy for $1,000 so you can see just how much, or how little, of each metal you get for your money.
How we Value Precious and Industrial Metals
Characterized by their natural shine, metals are valued using the two key principles of rarity and their industrial uses, with unique properties such as their appearance or cultural significance also affecting their value.
Rarity: A more scarce metal or resource will often have a higher value than one which is more abundant.
For example, while there are an estimated 2.1 billion tonnes of identified copper deposits, there are only 57,000 tonnes of underground gold reserves. While copper is valued at $0.24 per troy ounce, gold is worth around $1,815 per troy ounce.
Industrial uses: Metals which are needed for important industrial processes will often have a high demand from manufacturers, increasing their valuation.
For example, for most of its history cobalt was used decoratively for its striking blue color and for the creation of superalloys and steel products. However, when it was recently discovered that cobalt could be a key component in lithium-ion batteries for EVs, demand for cobalt surged sending its price from around $23,000 per tonne to more than $90,000 per tonne at one point.
Along with these two primary factors, unique properties and historical uses can also affect a metal’s valuation.
Former monetary metals like gold and silver are still sought after by investors for their potential ability to retain value over time compared to today’s fiat currencies. Meanwhile, platinum’s durability, resistance to tarnishing, and its bright white color makes it highly sought after for jewelry, raising the demand and value of the precious metal.
Getting Less for More: Comparing Metal Density
A key factor that determines the volume of a metal you get for a certain price is also the metal’s density. Precious metals tend to be more dense than industrial metals, with sometimes more than double the density depending on the specific metals compared.
As seen in the graphic above, $1,000 ...
Source: https://elements.visualcapitalist.com/visualizing-the-metals-you-can-buy-with-1000/
Bord and Pillar Mining:
1. Initial Development:
- Bords (or Rooms): Horizontal galleries are driven into the coal seam, creating rectangular rooms called bords or rooms.
- Pillars:The remaining coal within the pillars between the bords is left untouched to provide support to the overlying strata.
2. Extraction Phase:
- Extraction of Coal: The coal is then extracted from the bords, leaving behind the pillars.
- Pillar Size: The size and arrangement of the pillars depend on factors such as the geology of the deposit, the depth of the seam, and the desired level of recovery.
3. Support and Safety:
- Roof Support: The surrounding rock is supported by the pillars, and additional roof support methods like roof bolts or other supports may be used as needed.
- **Safety:** The design and spacing of pillars are crucial for maintaining the stability of the underground workings and preventing collapses.
Advantages of Bord and Pillar Mining:
- Selective Extraction: Allows selective extraction of coal, leaving behind support pillars.
- Safety: Provides good roof support, reducing the risk of roof collapses.
Challenges:
- Recovery Efficiency:Recovery rates may not be as high compared to some other mining methods, as significant portions of coal are left in pillars.
- Pillar Stability: Pillar stability is critical to prevent subsidence and maintain safety.
Variations:
There are variations of the bord and pillar method, such as the "room and pillar" method, which involves larger rooms and pillars and is commonly used in metal mining.
Bord and pillar mining is particularly suitable for relatively shallow, flat-lying coal seams and has been a traditional method for coal extraction in many mining regions around the world.
Source : Karim El-behairy, LinkedIn
Learn Financial Modeling for free with this comprehensive handbook! 🤩
1. Why is Financial Modeling Important?
2. Types of Financial Models
3. Financial Statement Anatomy
4. Top 10 Excel Functions You Should Know in Financial Modeling
5. The Income Statement Guide
6. The Balance Sheet Guide
7. The Cash Flow Statement Guide
8. The Ultimate Budgeting Guide
9. Inventory Valuation Methods
10. Depreciation Methods
11. Financial Ratios
12. What is beta? https
13. Options Pricing
14. Top Finance KPIs
15. Accounting vs Finance
16. EBIT vs EBITDA
17. Company Valuation Methods
18. Top Finance Certifications
19. 17 Financial Modeling Tips & Tricks
20. Excel Shortcuts Cheatsheet
21. Typical Excel Mistakes When Building a Financial Model
Follow Financial Modeling World Cup for more finance and Excel content! 📈
ZVENIA would like to say a big thank you to the people at FMWC for sharing this great content with us:
🙏 Katrīna Anevica
🙏 Renat Stanko
🙏 Andrew Grigolyunovich, CFA
🙏 Shihan Maheen Seenath
🙏 Maksims Sičs
🙏 Toomas O'Brock
🙏 Emils Saulitis
WHY DO I NEED TO SCHEDULE?
Why do I need to schedule my guys—we’re too small, my guys know what they need to do, and I’m too busy!
These are just a few of the reasons that people give for not planning and scheduling. They also sow the seeds for equipment failures, late-night calls, dis trustful production people, and irate bosses. Instead, maintenance managers should view scheduling as the cornerstone of successful maintenance operations.
Scheduling involves planning the activities of the maintenance crew. It does not mean planning the minute 15 16 Fundamentals of Preventive Maintenance by-minute schedule of each technician. Planning means assigning workorders by shift, by day, by task importance, by material availability, by manpower availability, and by production downtime.
Source: John M. Gross
Mourad CHETTAH
The wrong rate could cancel your project.
1// Risk vs. Reward:
➡️ Understand that a higher discount rate suggests higher risk, reducing NPV and IRR.
➡️ Tailor the rate to the project's unique risk profile.
2// Strategic Perspective:
➡️ Prioritize long-term strategic benefits that may warrant accepting a lower NPV.
➡️ Look beyond immediate financial returns.
3// Accurate Cash Flows:
➡️ Present realistic cash flow projections.
➡️ Clear and credible forecasts can mitigate the effects of a higher discount rate.
4// Cost of Capital:
➡️ Ensure the discount rate reflects your company's actual cost of capital.
➡️ Overstated rates can unfairly disadvantage good projects.
5// Opportunity Cost:
➡️ Consider what might be lost by not pursuing the project.
➡️ Sometimes, the benefits outweigh the risks suggested by a high discount rate.
6// Sensitivity Analysis:
➡️ Use this tool to show how various discount rates affect project viability.
➡️ Demonstrating robustness under different scenarios.
7// Risk-Adjusted Phases:
➡️ Propose varying discount rates for different project stages.
➡️ Align rates with the varying risk levels of each phase.
8// Historical Data Utilization:
➡️ Leverage past project data to argue for a realistic rate.
➡️ Especially relevant when previous projects have shown success.
9// Non-Financial Value:
➡️ Account for intangible benefits like brand enhancement or sustainability impacts.
➡️ These benefits don't directly figure into NPV calculations but are valuable.
10// Flexible Rate Review:
➡️ Advocate for periodic reassessments of the discount rate.
➡️ Adjust as the project advances and uncertainties diminish.
How to analyze In 2 minutes a:
• Balance sheet
• Income Statement
• Cash Flow Statement
1️⃣ Balance sheet
A balance consists of the following elements:
• Current Assets
• LT Assets
• Current Liabilities
• LT Liabilities
• Shareholders Equity
It shows you what the company owns and owes.
This statement is based on a simple formula:
Assets = Liabilities + Equity
2️⃣ Income Statement
An income statement shows you the income and expenses of a company.
Revenue
- COGS
= Gross Profit
- Operating Expenses
= Operating Income
- Non-Operating Income/Expenses
= Pre-Tax Income
- Taxes
= Net Income
3️⃣ Cash Flow Statement
The Cash Flow Statement consists of 3 elements:
• Cash Flow from Operating Activities
• Cash Flow from Investing Activities
• Cash Flow from Financing Activities
It shows you the cash that enters and leaves a company.
Cash Flow from Operating Activities
Net Income
+ Non-Cash Changes
+/- Changes in Working Capital
= Cash Flow from Operations
Cash Flow from Investing Activities
- Capital Expenditures
- Acquisitions
+ Proceeds from the sale of investments
= Cash Flow from Investments
Cash Flow from Financing Activities
+/- Borrow/Repay Debt
+/- Issue/Repurchase of stocks
- Pay Dividends
= Cash Flow from Financing
➟ 62% say meetings miss out on team building
➟ 64% say meetings steal time from deep thinking
➟ 71% say meetings are unproductive and inefficient
Yet they still average 23 hours a week in meetings.
And employees spend 31 hours a month in meetings.
Imagine having all that time to actually get work done.
Meeting culture is killing productivity.
There's a better way:
✅ Cut the clutter (and be ruthless).
Cancel all recurring meetings that don't deliver value.
✅ Agenda is a must.
No clear purpose, no meeting. Keep it sharp & focused.
✅ Use technology instead.
Quick chats, emails, Looms, shared docs save hours.
✅ Smaller is smarter.
Limit attendees to those who really need to be there.
✅ Watch the clock.
Set a strict time limit. Make 30 mins your max.
✅ Give an opt-out option.
Not essential? Let them skip it. Respect their time.
✅ Prioritize impact.
If it won't benefit the bottom line or team well-being,
scrap it.
Lead by example.
Give your team the gift of time.
They'll deliver results you never imagined possible.
Agree? Repost for others to see it too ♻️.
And follow Justin Wright for more like this.
P.S. Have you experienced meeting overload?
Credits to Hooman Askari for this post.
✅ Highlights of this semi-mobile plant are:
➖ Semi-mobile design with truck bridges
➖ Building above crushing plant
➖ Material fed by heavy duty apron feeder
➖ Crusher designed and manufactured by TAKRAF
➖ Extremely cold weather design
➖Dust collection system
➖ Crushing capacity 4,250 t/h
➖Material - Overburden, mainly sandstone/siltstone
➖ Crusher – double roll crusher
➖ Material feed – Apron Feeder
➖ Semi-mobile crushing plants for relocation
✅ A considerable number of mines around the world opt for a semi-mobile crushing plant. These plants are designed in such a manner that they can be relocated through the use of transport crawlers and/or multi-wheel trailers. Having the flexibility to relocate the crushing plant enables travel distances for haulage trucks and belt conveyors to be optimized during the
life of the mine - all with a view to providing increased efficiency and flexibility to the mine operator. Choosing the optimal crushing plant location is an essential criteria for the reduction in the number of haulage trucks required and increase in operational efficiency.
✅ In-Pit Crushing and Conveying (IPCC)
✅ Capital and operational costs of an operation depend directly on the material transport system. Conventional truck haulage as today´s predominant means of material transport in surface mines are well established and provide excellent flexibility, however contribute up to 60% of the overall mining cost. Further to the potential operational expenditure (opex) reduction, IPCC systems also offer a number of other benefits to mining operations ranging from an increase in safety to reductions in dust, noise and greenhouse gas emissions, increased automation and bad
weather downtime.
✅ IPCC represents a viable, safer and less fossil fuel dependent alternative, comprising fully-mobile, semi-mobile or stationary crushing stations connected to conveyors and spreaders (for waste) or stackers (for ore) to transport material out of the mine.
✔ For more information on what I do:
https://lnkd.in/gw6bKKm
✔ Click on the hashtag to follow me for mining news and educational content: #MiningNewsByHooman
🔗All rights and credits reserved to the respective owner/s
See source
#miningengineering #mining #miningindustry #miningengineering #geologists #mineplanning #ingenieríaminera #minería
EBITDA is an acronym that stands for Earnings Before Interest, Taxes, Depreciation & Amortization.
EBITDA is a major financial indicator used to evaluate companies' profitability with different capital structures.
EBITDA is a rough guide to show how much cash a business generates.
Calculating EBITDA requires information from the company's Income Statement and Cash Flow Statement.
Here's one way to do it:
Net Income
+ Interest Expense (Income Statement)
+ Taxes (Income Statement)
+ Depreciation (Cash Flow Statement)
+ Amortization (Cash Flow Statement)
Some investors love EBITDA. Others despise it.
EBITDA does not take into account all business activities, so it might overstate cash flow.
Charlie Munger calls EBITDA "Bullsh*t Earnings"
Why? Because it ignores depreciation as an expense.
Depreciation is when a tangible asset's value is gradually reduced over time to account for wear and tear.
The equipment will eventually be replaced, so depreciation is an actual expense. This is why ignoring it when calculating profits can be a big mistake.
Buffett & Munger prefer to look at EBT -- Earnings Before Taxes. This allows them to compare the earnings yield on a business to the earnings yield on bonds (which is also a pre-tax number).
Credits to Brian Stoffel
The rule of law is internationally recognized as a foundational element in guaranteeing peace, justice, human rights, effective democracy, and sustainable development. Around the world, however, the rule of law continues to weaken. This 2023 edition of the World Justice Project (WJP) Rule of Law Index shows that over 6 billion people now live in countries where the rule of law is declining. Amid widespread institutional stagnation, a majority of countries continue to experience rule of law backsliding characterized by executive overreach, diminished human rights, and justice systems that are failing to meet people’s needs.
The Mining News Making The Headlines This Week.... 📰
Financial Results 📊
🇦🇺 BHP announced it's first half year results - Revenue up 6% to U$27billion, underlying profit $6.6billion, net profit $927million (due to a $5.6billion impairment for Samarco disaster), dividend of 72c a share being paid out.
🇬🇧 Anglo American is expected to announce revenue of U$30billion, Net profit of $2.4billion and net debt to have increase by 35% to $10.75billion.
🇬🇧 🇦🇺 Rio Tinto posted a US$15.5billion net profit, they will return $7.1billion to investors with a $2.58 a share dividend.
🇬🇧 🇨🇱 Grupo Antofagasta Minerals recorded an 8% increase in revenue to US$6.3billion and a pre-tax profit of $1.8billion (up 11%), production is up 2%, the dividend will be 60c a share.
🇨🇭Glencore's profits are down 75% from last year, US$4.3billion for 2023, they will return 13c a share to shareholders.
🇦🇺 Pilbara Minerals Limited posts a net profit of AU$220million, down 82% from the year before due to a 90% drop in the lithium price.
🇦🇺 Iluka Resources posted revenue of $1.24billion, net profit of $342million, 4c per share dividend.
Mergers & Acquisitions 🤝
🇦🇺 🇺🇸 Orica acquire Cyanco for US$640million with the aim of creating an integrated global manufacturing & distribution network, Cyanco mainly supply chemicals into the gold mining industry, Orica will partly fund the deal with a $US$260million equity raise.
🇺🇸 🇷🇺 🇰🇿 Polymetal International plc is selling its Russian business for U$3.7billion, after tax cash from the deal of $300million is going to be reinvested into Kazakhstan operations.
🇨🇦 Integra Resources has sold its royalty interest in Wheaton Precious Metals for US$9.8million.
Commodity price impacts 📉
🇿🇦 Anglo Platinum have announced on the back of weak platinum prices and rising operational costs that they're reviewing up to 4,300 jobs in an effort to save money. The company employs 32,000 staff so over 10% of the workforce.
🇦🇺 🇨🇴 South32 are undertaking a review of their Cerro Matoso nickel mine
Executive Changes 📯
🇨🇦 Barrick Gold Corporation's Executive Chairman of a decade John Thornton will move into a Chairman role.
🇨🇦 Wesdome Gold Mines announces Fernando Ragone as their new Chief Financial Officer.
Mining Projects ⛏️ 🏗️
🇨🇦 🇵🇪 Sierra Metals Inc. has been successful in obtaining environmental permitting to develop their Peruvian Yauricocha mine, they are planning to increase copper production by 40%.
🇦🇺 🇬🇳 Rio Tinto have allocated $6.2billion in capital expenditure over the next 3 years to finance projects such as Simandou and Gudai Darri.
🇦🇺 Iluka Resources have altered their estimates to complete their Eneabba rare earth processing plant to AU$1.7-1.8billion and are in discussions with the Australian government to assist with financing the additional $450-550million in costs.
hashtag#mining hashtag#miningindustry hashtag#coppermining hashtag#nickel
Every day, more than 120 construction workers are disabled and forced to miss work because of an eye injury.
Source: Credits to : Abla Mawudeku, Judith Anderson, Kathy Hunting, Sandra Jacob Dept. of Env. & Occ. Health, George Washington University, Washington, D.C.
Here's a simple way to understand this confusing finance term.
Working capital -- aka Net Working Capital -- is the difference between a company's current assets (expected to be used/consumed/converted into cash <1 year) and current liabilities (debts that are expected to be paid off in <1 year).
Why is working capital important?
Working Capital is a quick way to assess a company's liquidity, which is its ability to meet its short-term obligations.
It serves as an indicator of a company's financial health.
If working capital is positive, it indicates that a company has sufficient resources to cover its short-term financial needs.
If working capital is negative, it indicates that a company may face financial difficulties.
There are three ways to calculate working capital:
THE SIMPLE METHOD
Current Assets - Current Liabilities
This is the most common method and easiest to calculate.
THE NARROW METHOD
(Current Assets - Cash) - (Current Liabilities - Debt)
This method excludes cash & debt, which can be useful for comparing companies with different capital structures.
THE SPECIFIC METHOD:
Accounts Receivable + Inventory - Accounts Payable:
This method focuses on the cash conversion cycle of a business, which is the time it takes to convert inventory into cash.
DM me for an Inquiry of "Power BI Course". It is specially designed for Civil Engineers/Project Management Professionals.
Huge Credit to: Wayne W. Eckerson / tdwi
--------------------------------------------------
I share my learning journey into data science (Excel, PowerBi, Python, VBA) with my LinkedIn family. Kindly follow me 👉Mitesh Bhatt and let's grow together!
Dear young geologists,
I want to share with you my collection of useful geologic diagrams and pictures that you can use in the field.
Дорогие юные геологи,
Я хочу поделиться с вами своей подборкой полезных геологических схем и картинок, который вы можете использовать в поле.
Brought to you by the talented team at Insignia Mining, Mine Planning Matters is a podcast for the mining industry. We talk about mine planning and mining engineering topics. But our podcast is not just for mine planners, it's for all stakeholders of mine plans, which is nearly everyone at the mine site! That includes those who create them, who execute them, those who sign off on them and those who rely on them.
Source: Mark Bowater
D’après l’Afnor (FD X 60-000), « la maintenance est l’ensemble de toutes les actions techniques, administratives et de management durant le cycle de vie d’un bien, destinées à le maintenir ou à le rétablir dans un état dans lequel il peut accomplir la fonction requise ».
Dans une entreprise, maintenir, c’est donc effectuer des opérations (dépannage, réparation, graissage, contrôle, etc.) qui permettent de conserver le potentiel du matériel pour assurer la production avec efficacité et qualité.
Source: Ridha Fattouch
Every Analyst must be familiar with them.
I hope this is helpful to you.
Do follow Varun Soni for more quality content.
source: Qlik
Varun Soni
Mitesh Bhatt
¿Quieres conocer mas sobre los camiones autónomos? Te invito a leer la siguiente infografía donde se detalla que es un AHS (Autonomous Haulage System) y como se ha implementado en diferentes unidades mineras del mundo. Asi mismo se ha descrito las partes de un camión minero autónomo, los nuevos roles que implica su implementación, los beneficios y las barreras con las que cuenta para hacer de esta una solución muy segura.
Credits to Mariela Ramos Ramos y CODEaUNI
I decided to put together all my posts in a single PDF. It covers 320+ posts and has over 550 pages.
.
.
Background: I have been writing about Python and Data Science consistently for ~11 months now.
When I started this newsletter 11 months back, I never expected it would turn out to be so rewarding and fulfilling. I am deeply grateful to everyone who loves reading my work.
The PDF covers posts about various topics such as Python, Pandas, Data Visualisation, Jupyter Tips, no-code tools, Optimization techniques, Statistics, ML fundamentals, and many more.
I hope this PDF will be helpful.
Source: Avi Chawla, LinkedIn
Color matters and is especially helpful with your storytelling. It conveys more information than we might think in many cases and sometimes it also delivers emotion. But still, less is more, keep it simple unless necessary.
When I think about the charts that I made in the early days, yes, they did look like peacocks. 😂
One more book recommendation for data storytelling
https://lnkd.in/g5iTqjSH
What did your first few charts look like? Were they very different from your current work?
Source: Warsaw University of Technology
The multi part Global Atlas is a compilation of public domain global geologic information. It is organized by themes of interest and is meant to be a quick go to reference for E&P folks, researchers and academia.
This one is a very simple compilation of known distribution of critical mineral deposits around the world. I have incorporated the interesting “verbatim” responses from the Chat GPT AI engine regarding the various critical minerals to show how it can be a valuable teaching tool.
Critical minerals are defined as metal and nonmetal elements and compounds considered vital to economic and national security yet whose supplies may be at risk because of geological scarcity, geopolitical issues, trade policies, or other factors related to extraction, refining, and transport.
First, let's consider how much gold is readily available to us.
The most recent estimate is ~210,000 tonnes extracted and ~50,000 tonnes discovered and still in the ground - There's not much of it around!
All the gold that has been mined would fit into 4 Olympic-sized swimming pools. 🏊♀️
Next, let's consider how is GOLD made. 🤔
☀ Nucleosynthesis in Stars:
- Stars are giant nuclear reactors where hydrogen is converted into helium through nuclear fusion. As the star evolves, heavier elements are formed through subsequent fusion reactions.
- During the later stages of a massive star's life, when it undergoes a supernova explosion, intense heat and pressure cause rapid nucleosynthesis, leading to the creation of gold and other heavy elements.
🌟 Supernova Explosion:
- The explosion of a massive star, known as a supernova, is a cataclysmic event that releases an enormous amount of energy.
- The extreme conditions during a supernova, such as high temperatures and intense pressure, enable the fusion of lighter elements into heavier ones, including gold.
⚛ R-process (Rapid Neutron Capture):
- Gold, being a relatively heavy element, requires specific conditions for its formation. The rapid neutron capture process (r-process) during a supernova is crucial for creating elements heavier than iron.
- In the r-process, neutrons are rapidly captured by existing nuclei, leading to the formation of gold and other heavy elements.
💣 Distribution in Space:
- After a supernova explosion, the newly formed elements, including gold, are ejected into space. These elements become part of the interstellar medium, the material that fills the space between stars.
🌌 Formation of Planetary Systems:
- As new stars and planetary systems form from the remnants of earlier stars, the material in the interstellar medium, enriched with heavy elements like gold, becomes incorporated into these new systems.
🌎 Earth's Formation:
- The Earth and other planets in our solar system formed from a rotating disk of gas and dust around the young Sun. This material contained traces of heavy elements, including gold, inherited from previous generations of stars.
🌋 Magmatic Processes:
- Volcanic and magmatic processes bring materials from the mantle to the Earth's surface.
- In certain geological conditions, gold-containing fluids can migrate through the Earth's crust and form gold deposits near the surface.
So, if you have a smart phone or any gold jewelry, you've got a piece of an ancient dead star! ⭐
It took BILLIONS of years for the universe to make the gold, perhaps its TRUE VALUE is much higher than what we perceive it to be.
After all economically viable sources of gold have been mined, how can more of it be produced?
#GoldMining | #MiningMatters | #StoreofValue | #PreciousMetals
Governments formulate lists of critical minerals according to their industrial requirements and strategic evaluations of supply risks.
Over the last decade, minerals like nickel, copper, and lithium have been on these lists and deemed essential for clean technologies like EV batteries and solar and wind power.
This graphic uses IRENA and the U.S. Department of Energy data to identify which minerals are essential to China, the United States, and the European Union.
What are Critical Minerals?
There is no universally accepted definition of critical minerals. Countries and regions maintain lists that mirror current technology requirements and supply and demand dynamics, among other factors.
These lists are also constantly changing. For example, the EU’s first critical minerals list in 2011 featured only 14 raw materials. In contrast, the 2023 version identified 34 raw materials as critical.
One thing countries share, however, is the concern that a lack of minerals could slow down the energy transition.
With most countries committed to reducing greenhouse gas emissions, the total mineral demand from clean energy technologies is expected to double by 2040.
U.S. and EU Seek to Reduce Import Reliance on Critical Minerals
Ten materials feature on critical material lists of both the U.S., the EU, and China, including cobalt, lithium, graphite, and rare earths.
Despite having most of the same materials found in the U.S. or China’s list, the European list is the only one to include phosphate rock. The region has limited phosphate resources (only produced in Finland) and largely depends on imports of the material essential for manufacturing fertilizers.
Coking coal is also only on the EU list. The material is used in the manufacture of pig iron and steel. Production is currently dominated by China (58%), followed by Australia (17%), Russia (7%), and the U.S. (7%).
The U.S. has also sought to reduce its reliance on imports. Today, the country is 100% import-dependent on manganese and graphite and 76% on cobalt.
After decades of sourcing materials from other countries, the U.S. local production of raw materials has become extremely limited. For instance, there is only one operating nickel mine (primary) in the country, the Eagle Mine in Michigan. Likewise, the country only hosts one lithium source in Nevada, the Silver Peak Mine.
China’s Dominance
Despite being the world’s biggest carbon polluter, China is the largest producer of most of the world’s critical minerals for the green revolution.
Source: https://elements.visualcapitalist.com/the-critical-minerals-to-china-eu-and-u-s-national-security/
V1- In my experience one of the common causes of tension between Mine Planning and Operations teams is misalignment over who actually owns the short term (execution) plan. I ran a survey a year or two back on LinkedIn and the overwhelming response was Mine Planning. But I don't necessarily agree......
By Mark Bowater
Source: Mine Planning Matters from insigniamining.com
Whittle Integrated Strategic Planning is a concept of long-term planning for the mining industry which considers:
* All parts of the value chain – from the mineral resource to the market.
* All periods – a decision of what to mine and process in one period affects the options for the other periods.
* All stakeholders – shareholders are interested in financial returns in the form of cash flow and capital growth. However, the interests of employees, local communities, the government and the environment must be considered to earn an enduring licence to operate.
A decision made at any point in the system potentially affects the optimal decision for other parts of the system. The key is to optimise all decisions simultaneously. This calls for cross-functional collaboration across all parts of the organisation – rather than a traditional silo approach (i.e. geology, mining, processing, logistics, marketing/commercial, finance and HR). This requires the application of the Whittle Integrated Strategic Planning philosophy and methodologies, combined with sophisticated optimisation technology. Only Whittle Consulting has this unique combination.
Hoy quiero compartir con ustedes las diferencias que identifico entre el Planeamiento Determinístico y el Planeamiento Estocástico en el ámbito de la minería. 👷♂️
𝐏𝐥𝐚𝐧𝐞𝐚𝐦𝐢𝐞𝐧𝐭𝐨 𝐃𝐞𝐭𝐞𝐫𝐦𝐢𝐧𝐢́𝐬𝐭𝐢𝐜𝐨:
En el planeamiento determinístico, no se contempla la posibilidad de aleatoriedad en el desarrollo de planes futuros. Este enfoque asume que todos los parámetros de entrada son certeros y se representan como constantes predefinidas. Sin embargo, la realidad de los mercados, las propiedades de los yacimientos minerales y las condiciones de la minería están en constante cambio e incertidumbre. Esto conduce a resultados inflexibles e inevitablemente imprecisos. Aunque este modelo utiliza datos como el modelo geológico, la infraestructura, las finanzas y los escenarios operativos, su rigidez no se adapta bien a las variaciones del entorno.
𝐏𝐥𝐚𝐧𝐞𝐚𝐦𝐢𝐞𝐧𝐭𝐨 𝐄𝐬𝐭𝐨𝐜𝐚́𝐬𝐭𝐢𝐜𝐨:
En contraste, la optimización estocástica considera la incertidumbre asociada a los parámetros de entrada, como las cantidades y leyes de minerales, los precios de commodities y la disponibilidad de equipos. Esta metodología, ampliamente aceptada en otras industrias, integra un análisis de incertidumbre relacionado con aspectos geológicos, de mercado y de precios. En la minería, donde la incertidumbre es inherente, algunos modelos no la tienen en cuenta, pero el enfoque estocástico busca abordarla de manera efectiva.
𝐁𝐞𝐧𝐞𝐟𝐢𝐜𝐢𝐨𝐬 𝐝𝐞𝐥 𝐏𝐥𝐚𝐧𝐞𝐚𝐦𝐢𝐞𝐧𝐭𝐨 𝐄𝐬𝐭𝐨𝐜𝐚́𝐬𝐭𝐢𝐜𝐨:
✅ Adaptabilidad: Considera la variabilidad del entorno minero.
✅ Precisión Mejorada: Ofrece resultados más realistas al considerar la incertidumbre.
✅ Maximización de NPV: Optimiza objetivos, generalmente el Valor Presente Neto, bajo condiciones de incertidumbre.
📚 𝐑𝐞𝐜𝐨𝐦𝐞𝐧𝐝𝐚𝐜𝐢𝐨𝐧𝐞𝐬 𝐝𝐞 𝐋𝐞𝐜𝐭𝐮𝐫𝐚:
"Advances in Applied Strategic Mine Planning" de Roussos Dimitrakopoulos.
"Crimes Against Mine Planning: Solving The Top 10 Pitfalls" de Mark Bowater.
Articulo publicado por Minería & Desarrollo el 05 febrero de 2024.
La industria minera de Chile, el principal productor de cobre del mundo y el segundo mayor productor de litio, necesitará más de 34.000 nuevos trabajadores para 2032, según un estudio publicado esta semana.
El informe de la Alianza CCM-Eleva, una iniciativa conjunta entre el Consejo Minero y Fundación Chile, analizó las tendencias y desafíos laborales de 27 empresas mineras y proveedoras del país, que representan el 96% del sector.
“La nueva estimación de los talentos necesarios en la próxima década refleja un crecimiento del 36% en comparación con lo estimado en el estudio anterior”, afirmó Vladimir Glasinovic, director del Programa Eleva (Alianza CCM-Eleva). “Muestra una industria minera que está creciendo con fuerza, generando empleos y desarrollo local”.
Una de las principales conclusiones del estudio fue que la demanda de capital humano aumentará en más de un tercio en los próximos nueve años, en comparación con la edición anterior del estudio, publicada hace dos años. Los principales impulsores de esta demanda de talento son la jubilación de trabajadores que se acercan al final de sus carreras y el desarrollo de nuevos proyectos en regiones clave.
Los principales proyectos que impulsan la demanda de nuevos talentos, según el informe, son Quebrada Blanca 2 (T2) de Teck, que produjo el primer cobre el año pasado y está intensificando sus operaciones; Salares Norte de Gold Fields, que se espera comience en abril ; El Distrito Minero Centinela de Antofagasta y la expansión Los Bronces de Anglo American , programadas tentativamente para principios de 2026.
El estudio también identificó que el 75% de la demanda de profesionales se concentrará en cinco tipos de especialistas, siendo los mantenedores mecánicos los que encabezan la lista. Los operadores de equipos móviles y los operadores de equipos fijos ocuparon el segundo y tercer lugar, respectivamente.
El estudio tiene como objetivo proporcionar información relevante para que las políticas públicas y estrategias industriales aborden las necesidades de capital humano del sector minero, que es uno de los principales pilares de la economía de Chile. También destacó los avances y desafíos en materia de equidad de género, impacto tecnológico y oferta educativa disponible en el país.
Concluyó que la participación femenina en la industria es del 15%, donde una de cada tres contrataciones dentro de las empresas mineras fue una mujer, y la participación en puestos de toma de decisiones alcanzó el 17%.
Las cifras muestran que el porcentaje de participación femenina de Chile en el mercado laboral está por debajo del de países desarrollados u otras economías de la región. Sin embargo, en términos de participación femenina en la industria minera, el país está mejor posicionado, por encima de Perú y al mismo nivel que Estados Unidos.
En general, la industria minera de Chile registra actualmente la tasa de empleo más alta en 12 años, mostrando un aumento del 38% con respecto a 2020 y del 22% con respecto a 2011.
Source: Minería & Desarrollo con información de Mining.com
Most maintenance programs are inefficient.
One big reason for that is they’re not using the right types of maintenance.
Remember, there is no ‘best’ type of maintenance.
You need to match the right type of maintenance with the characteristics of the failure mode your dealing with and with your organisational objectives
That’s why in the next few days...
I’ll talk about the 9 Types of Maintenance in greater detail.
1-Preventive Maintenance (PM)
2-Corrective Maintenance (CM)
3-Time-based Maintenance (TBM)
4-Failure Finding Maintenance (FFM)
5-Risk-based Maintenance (RBM)
6-Condition-based Maintenance (CBM)
7-Predictive Maintenance (PDM)
8- Deferred Corrective Maintenance
9- Emergency Maintenance (EM)
Which one do you use the most?
Source: Erik Hupjé, LinkedIn
The ranks of the most valuable mining companies in the world were throughly scrambled in 2023 as governments intervened, lithium and nickel prices tumbled, gold hit records and a new listing went ballistic
At the end of 2023, the MINING.COM TOP 50* ranking of the world’s most valuable miners reached a combined $1.42 trillion, up a healthy, if far from spectacular $48.7 billion over the course of 2023. Mining’s top tier is also worth $330 billion less than in March 2022.
Metal and mineral markets are volatile at the best of times – the nickel, cobalt and lithium price collapse in 2023 was extreme but not entirely unprecedented. Rare earth producers, platinum group metal watchers, iron ore followers, and gold and silver bugs for that matter, have been through worse.
Mining companies have become better at navigating choppy waters and as a whole the majors performed fairly consistently last year despite geopolitical and market turmoil, but within the ranking, 2023 fortunes were made and lost over what seemed like days.
The forced closure of one of the world’s biggest copper mines – and the subsequent collapse of owner First Quantum Minerals stock – served as a stark reminder of the outsized risks miners face over and above market swings.
Panama root canal
After months of protests and political pressure, at the end of November the Panama government ordered the closure of First Quantum Minerals’ Cobre Panama mine following a ruling by the Supreme Court that declared the mining contract for the operation unconstitutional.
Public figures, including climate activist Greta Thunberg and Hollywood actor Leonardo Di Caprio backed the protests and shared a video calling for the “mega mine” to cease operations, which quickly went viral.
That mining cobre is at the nexus of the green energy transition is clearly an irony lost on those trying to save the world. FQM is seeking arbitration and completely winding down operations will take time, but a reopening of Cobre Panama is not on the cards.
From 25th position in the ranking at the end of March 2022 and a valuation well above $20 billion, the November-December sell off saw FQM drop out of the top tier altogether, ending 2023 at number 58 with a market cap below $6 billion.
Cobre Panama supplied more than 40% of the company’s revenue, and with nickel prices plummeting FQM has also been forced to suspend operations at its Raventhorpe mine in Australia.
Amid the inevitable takeover rumours now in circulation, shares in the Vancouver-based company have rallied in 2024, but still not enough to reenter the top 50.
No. 12 with a bullet
If 2023 was an annus horribilis for FQM it was mirabilis for Amman Mineral Internasional. Stock in the Indonesian firm surged by 269% from its July debut in Jakarta to reach a market capitalisation of more than $30 billion at the end of last year – and number 12 in the ranking.
That valuation is quite an achievement on annual revenue of $2 billion no matter how fat margins are at the company’s Batu Hijau copper and gold mine. Batu Hijau is the third largest mine worldwide in terms of copper equivalent output (but no match for Cobre Panama when it comes to the orange metal alone) and has been in production since the turn of the millennium. Amman is also developing the adjacent Elang project on the island of Sumbawa.
Amman Minerals’ ascent has minted at least six new billionaires and the stock appears to be building on its success in 2024, rising by double digits in January already.
Indonesia’s other major mining IPO, Harita Nickel, was on a different trajectory altogether. After listing in April and raising $672m, the company has had a tough go of it and the stock has shed more than 38% since then as nickel prices continue to decline.
Shiny gold, dull silver, tarnished PGMs
The price of gold hit an all-time record on December 1, 2023. But bullion’s best ever level passed without the usual fanfare and despite bullish indications for 2024, gold mining stocks did not exactly storm the rankings of the most valuable miners.
Over the course of 2023 gold and royalty companies on the MINING.COM TOP 50* ranking of the world’s most valuable miners added a collective $20.8 billion in market cap.
And judging by gold miners’ performance so far this year, gold above $2,000 is not providing enough support. Newmont is already down 17%, Barrick has shed 13% and Agnico Eagle shareholders are 9% poorer.
The number of precious metals companies in the top 50 has also been relatively stable over the years. With Newmont’s absorption of Newcrest now complete, the open slot was taken up by Kinross, which spent a few years in the wilderness.
Anglogold Ashanti was just edged out by Jiangxi Copper for position number 50 on the last trading days of 2023, but based on its performance so far in 2024 the London-listed company is already back among the top tier. Indeed Anglogold is the only major gold player in the black year to date.
...
In underground mine blasting, the location of the initiation hole and reamer holes is crucial for achieving efficient and safe blasting results. Here are the key reasons why their placement is important:
Optimizing Fragmentation:
The initiation hole, often referred to as the blasthole, is typically drilled at a strategic location within the rock mass to achieve optimal fragmentation. The goal is to break the rock into smaller, manageable pieces that can be easily handled and processed.
Reamer holes are additional holes drilled around the initiation hole to enhance the fragmentation pattern. The proper placement of reamer holes helps in breaking the rock mass more uniformly and reducing oversize rocks.
Controlling Rock Movement:
Initiating the blast at a specific location helps control the direction of rock movement. This is important for safety and to prevent damage to underground infrastructure or equipment.
Reamer holes can be strategically placed to direct the force of the blast in a controlled manner, reducing the risk of flyrock and ensuring that the energy is utilized efficiently for breaking the rock.
Minimizing Vibration and Overbreak:
Proper placement of blastholes helps in minimizing ground vibration, which is important to prevent damage to surrounding structures, tunnels, and workings. Controlling the location and timing of the blast helps achieve the desired results while minimizing undesirable side effects.
Reamer holes can also be used to control overbreak, which refers to the unintended fracturing or displacement of rock beyond the desired excavation limits. By placing reamer holes strategically, miners can reduce overbreak and maintain the integrity of the surrounding rock mass.
Ensuring Safety:
Careful planning of blasthole and reamer hole locations is crucial for the safety of personnel working in the underground mine. This includes avoiding the creation of unstable rock conditions, controlling the release of gases, and preventing the occurrence of hazardous situations such as rockfalls.
Efficient Ore Recovery:
Properly placed blastholes contribute to efficient ore recovery by facilitating the extraction of valuable minerals in a way that minimizes dilution and maximizes the yield of ore.
In summary, the careful consideration of blasthole and reamer hole locations is essential for achieving effective fragmentation, controlling rock movement, minimizing vibration and overbreak, ensuring safety, and optimizing ore recovery in underground mine blasting operations.
May 2023
Newmont agree deal with Newcrest
Newmont, the world’s biggest gold mining company agreed in May 2023 to acquire Australia-based gold miner Newcrest US$19.2bn/AU$26bn in the industry’s biggest deal to date.
May 2023
Allkem and Livent Fuse
Allkem Limited and Livent Corp join forces in a US$10.6 bn or AU$15.7bn all-stock merger of equals deal.
April 2023
BHP acquires OZ Minerals
The scheme was finally given the green-light by the Federal Court of Australia after the OZ Minerals shareholders gave the US$6.4bn or AU$9.6 bn acquisition the thumbs up.
Dec 2022
Rio Tinto completes Turquoise Hill deal
Rio Tinto completes US$3.3bn or AU$4.9bn Turquoise Hill deal for larger chunk in the mammoth Oyu Tolgoi project in Mongolia.
Feb 2022
Agnico and Kirkland Lake Merge
In a merger of equals which now creates a mining industry leader with a dominant position in the Canadian gold mining industry, Agnico Eagle Mines Limited and Kirkland Lake Gold Ltd combined in a transaction valued at US$11bn or CAD 13.5 bn/ AU$16bn.
Dec 2019
Barrick Gold-Randgold agree to merger creating a new gold mammoth In the industry
The share-for-share deal valued at US$6.5 bn or AU$9.8bn. The deal resulted in the formation of a “new Barrick” with a strong operational foundation across Africa, North America and South America as well as operations in Saudi Arabia and PNG.
March 2019
Newmont acquire Goldcorp for $10bn
An acquisition meaning the creation of a world leading gold company,. In 2019, Newmont acquired all the outstanding common shares of Goldcorp in a stock-for-stock transaction valued at US$10bn or AU$15bn.
And way back in 2007...
November 2007
Rio Tinto acquires Alcan’s outstanding shares
At the time this was the largest deal in mining & metals history for US$38.1bn/ AU$44bn.
Source: Jon Taylor, LinkedIn
Mega M&A Bundle
Includes:
→M&A Handbook
→Due Diligence Types
→M&A Deal Buy Side Roadmap
→Private Equity Vs Venture Capital
→Financial Due Diligence Checklist
→Financial Due Diligence Process
→ABCs of M&A
→M&A Buy-side VS Sell-side
→Unwritten M&A Model
→Proof of cash model
Source: Corporate Finance Learning®, LinkedIn
CFOs are today's corporate superheroes.
Tasked with doing so much and granted so few resources.
It's a challenge for the ages.
To help them with this challenge we've drafted "The CFO Handbook".
18 resources to help CFOs excel and ultimately become CEOs.
Here's a list of the resources you'll get...
1. The ten responsibilities of a CFO
2. Eight skills to be successful as a CFO
3. The ten most important KPIs for CFOs
4. The CFO’s KPI Fact Sheet
5. The CFO’s Guide to Managing the Finance Function
6. The CFO’s Guide to Measuring the Finance Function
7. The CFO career path
8. CFO vs. Controller
9. Eight types of CFOs
10. Ten actions for CFOs to improve the finance function
11. The CFO’s Finance Transformation Plan
12. The CFO’s Guide to Driving the Business
13. CEO vs. CFO
14. The ten most important KPIs for CEOs
15. The CEO’s KPI Fact Sheet
16. Ten things CFOs can do to keep CEOs happy
17. Ten ways CEOs and CFOs can work better together
18. The CEO succession plan
What's even more daunting is that the list of responsibilities extends way beyond this!
- ESG
- Cybersecurity
- War for talent
- Strategy
...
It's not easy being a CFO in today's world but with this handbook, it just got a little bit easier.
What do you think a handbook for CFOs should cover?
Do you find this handbook particularly useful?
This handbook is a 15$ value and is offered to you one time for free so don't forget to grab your copy!
Source: Anders Liu-Lindberg, LinkedIn
Knowledge of the equipment and materials with which we work is one of the most important factors in accident prevention. Each piece of equipment and material has been designed and developed to serve a specific purpose and knowledge of what it can and cannot do, not only improves efficiency but also eliminates hazards.
Owing to the many variations in rigging practices and the different ways in which rigging is used, recommendations must, of necessity, be framed in general terms. The recommendations can only be advisory in nature and are intended to complement relevant regulations and manufacturers’ requirements which must be observed.
The rigger must apply his or her intelligence, common sense, and experience in anticipating what will happen when the load is moved. This thought process must take place before the work is started. In order to ensure the design of a safe and efficient system, the rigger must answer such question as:
1. What is to be done with load?
2. What will be the travel path of the load to reach the desired location?
3. How will the load be set down at the desired location?
4. How can the hookup be made?
5. What tools are needed to perform the desired task?
6. What other factors are involved (weather, electrical wires, sloping grades, visibility)?
7. Do the tools have the capacity to handle the loads and forces involved?
8. Are additional personnel needed to control the load safely during the Lifting process?
Credits to Ashrf Al Mghrbl
and Mourad CHETTAH
El problema del ruido es bien conocido, y apenas han surgido novedades científicas en los últimos 30 años. Por el contrario, se han multiplicado los esfuerzos por controlarlo, mediante leyes y normas técnicas.
En el campo de la prevención de riesgos laborales se han generado suficientes ideas y técnicas de intervención que combinan el principio de prevención en el origen y el de gestión integrada, que deberían hacer posible una protección eficaz de la salud de los trabajadores.
Con todo, el ruido es probablemente uno de los riesgos laborales más extendidos y menos considerados. Se calcula que un 30% de la población trabajadora está expuesta a ruidos que superan los 85 dB(A). Tras 35 años de exposición a 85 dB(A), un 9% al menos de trabajadores o trabajadoras presentará sordera profesional, mientras que para una exposición a 90 dB(A) en el mismo período de exposición aumenta al 20%.
Las razones para la falta de atención hacia este problema son, en primer lugar, que a menudo el ruido no se identifica como riesgo: o bien no se hacen las
evaluaciones de riesgos o no se hacen de manera adecuada, y/o no se descubre el daño durante la vigilancia de la salud, etc. Otra razón que se suele apuntar es la tolerancia cultural al ruido: se considera que está demasiado aceptado tanto laboral como socialmente. A la vez, el daño que produce el ruido suele ser “invisible” porque se manifiesta progresiva y lentamente, en ocasiones incluso cuando el trabajador ya ha abandonado la actividad que lo originó.
Tomar conciencia del problema del ruido es el primer paso para comenzar a reducir la exposición. Combatir y reducir el ruido es posible. Realizarlo es una
necesidad, porque representa una oportunidad para nuestra salud y calidad de vida laboral y personal.
Source: Sergio Lozano García, LinkedIn
A decade of mining operations experience has inspired me to unveil the hidden stories that rarely see the light of day. From the gritty rock face to the boardroom decisions steering mining companies, the choices made on the ground reverberate to the highest echelons with profound effects on the outcomes that C-level executives care about.
During the daily grind, these choices often go unnoticed, yet they are the architects of a mining operation's destiny. This prompts a series of discussions bridging practical actions with strategic visions.
Starting with one that’s neat: Mine-to-Mill reconciliation. It's basically comparing what we thought we'd dig up against what we got as final product. Simple, right? But it tells us a whole lot about where we're nailing it and where we need to up our game.
Reconciliation goes beyond the science of estimation; it's the critical bridge that connects our forecasted models with the tangible outcomes in the field. For Geostatisticians, geologists, and mining planners, the focus often zeroes in on the accuracy of block models and the efficacy of mining sequences.
Yet, for managers and shareholders, reconciliation serves a broader strategic purpose. It's a test that answers a fundamental question: Are we delivering on our promises to the market? Every dollar spent on operational expenses (OPEX) and capital expenditures (CAPEX) is a commitment—not just to operational viability but to generating the expected cash flow and product yield.
Thus, reconciliation straddles two realms: the technical and the strategic. It validates the scientific rigor of our mineral resource estimations while simultaneously holding us accountable to the financial and production targets set before investors and stakeholders.
My journey from hands-on Resource Geologist to strategic Mine Technical Services Manager has bestowed me with a panoramic view of mining operations. Effective reconciliation isn't just about intricate science; it's about aligning production with investor, stakeholder, and market expectations.
A Practical Roadmap:
1. Data Mapping: Start by mapping your existing data—long-term and short-term block models, surveys, dispatch records, truck scales, plant sampling, and mass balance data. This is the foundation of reconciliation, helping you turn numbers into valuable insights.
2. Choose Reconciliation Frequency: In the next stage, determine how often you'll conduct reconciliation. It could be monthly, yearly, or quarterly, tailored to your company's unique needs. Keep in mind that a monthly frequency may not yield accurate results if you have substantial intermediate stock or lack monthly surface surveys. Adapt your comparison factors to align with your operational reality.
3. Dive into Comparisons: Understand that criticism and comparisons are essential. Just dividing numbers may not reveal the full picture. Be curious and dig deeper into your data to uncover meaningful insights.
4. Embrace Criticism and Adapt: Welcome criticism and foster a culture of continuous adaptation. Share your results openly, even if they raise questions. Embracing feedback and learning from it is integral to refining and enhancing your reconciliation process.
I would like to share a practical example of reconciliation, offering you a glimpse into a typical surface nickel mining operation with a blending process. It's a dynamic and intricate system where raw ore from various sources is meticulously blended to achieve the desired product composition.
Reconciliation is more than just crunching numbers; it's a commitment to excellence, transparency, and growth. I invite you all to be part of this journey. Feel free to drop your questions, share your thoughts, or send me a message—
I'm more than happy to share my knowledge and insights for free. Let's explore the depths of this vital process together, and together, we can shape the future of mining operations.
Noruega se convirtió en el primer país del mundo en autorizar la controvertida práctica de la #minería en aguas profundas a escala comercial. Y es que el proyecto de ley que se aprobó el martes acelerará la búsqueda de metales preciosos, los cuales tienen una gran demanda en la industria de tecnologías verdes.
Al respecto, los científicos ambientales han advertido que la aprobación del proyecto podría tener efectos devastadores para la vida marina. Y aunque el plan se circunscribe a aguas noruegas, este año podría alcanzarse un acuerdo sobre minería en aguas internacionales.
No obstante, el gobierno noruego dijo que estaba siendo cauteloso y que sólo comenzaría a emitir licencias una vez que se llevaran a cabo más estudios ambientales.
Las profundidades del mar albergan rocas del tamaño de una papa que se conocen como nódulos y costras: éstas contienen minerales como litio, escandio y cobalto, fundamentales para las tecnologías limpias, incluidas las baterías.
La propuesta de Noruega le permitirá a las mineras presentar solicitudes para explotar 280.000 Km2, un área mayor que el tamaño de Reino Unido.
Aunque estos minerales están disponibles en tierra, están concentrados en unos pocos países, por lo que su suministro puede llegar a estar en riesgo. Por ejemplo, la República Democrática del Congo es dueña de algunas de las mayores reservas de cobalto, pero enfrenta conflictos en algunas partes del país.
Walter Sognnes, cofundador de la minera noruega Loke Minerals -que planea solicitar una licencia- reconoció que es necesario hacer más para comprender las profundidades del océano antes de que comience la minería.
"Tendremos un período relativamente largo de actividad de exploración y mapeo para cerrar la brecha de conocimiento sobre el impacto ambiental", le dijo a la BBC en una entrevista.
Las críticas
Martin Webeler, activista de los océanos e investigador de la Fundación de Justicia Ambiental, dijo que el anuncio es "catastrófico" para el hábitat del océano.
"El gobierno noruego siempre destacó que quiere implementar los más altos estándares ambientales. Es hipocresía mientras se desestiman todos los consejos científicos", comentó.
Asimismo, dijo que las mineras deberían centrarse en prevenir daños ambientales en las operaciones actuales, en vez de abrir una industria completamente nueva.
La medida pone al país en desacuerdo con la UE y Reino Unido, quienes han solicitado una prohibición temporal de la práctica debido a las preocupaciones existentes sobre posibles daños ambientales.
Las técnicas para recolectar minerales del fondo marino podrían generar una importante contaminación acústica y lumínica, así como daños al hábitat de los or
Uranium production in Cigar Lake, Canada is the highest-grade in the world.
Since 2014, the site has mined 105 million pounds of the radioactive metal, which is naturally occurring on Earth. It is the largest uranium mine on the planet. For context, an egg-sized amount of uranium fuel can generate as much electric power as 88 tonnes of coal.
Given its vast uranium deposits, Canada has produced the most uranium worldwide since 1945.
This graphic shows cumulative uranium production by country in modern history, with data from the World Nuclear Association.
The Top Uranium-Producing Countries
Since 1945, a total of 3.5 million tonnes of uranium has been produced globally.
Together, Canada and the U.S. account for over 29% of global production, mining 932,000 tonnes over the last several decades.
Country Share of Production Cumulative Production 1945-2022 (Tonnes)
🇨🇦 Canada 17.4% 554,475
🇺🇸 United States 11.9% 378,038
☭ USSR* 11.9% 377,613
🇰🇿 Kazakhstan 11.0% 349,789
🇦🇺 Australia 7.6% 240,579
🇩🇪 Germany 6.9% 219,685
🇿🇦 South Africa 5.2% 165,692
🇳🇦 Namibia 5.0% 158,856
🇳🇪 Niger 4.9% 156,797
🇨🇿 Czech Republic 3.5% 112,055
🇷🇺 Russia 2.8% 90,725
🇺🇿 Uzbekistan 2.4% 76,808
🇫🇷 France 2.4% 76,021
🇨🇳 China 1.7% 53,712
🇺🇦 Ukraine 0.8% 24,670
🌍 Others 4.7% 149,299
*Until 1991, USSR comprised the uranium production of Russia, Kazakhstan, Uzbekistan, Ukraine and other former Soviet Union republics.
During the Cold War, the USSR mined over 377,000 tonnes of uranium for a variety of purposes including nuclear reactors and naval fuel.
Due to demand from nuclear reactors, uranium production sharply increased from the 1960s to the 1980s. With this came the construction of the earliest generation of nuclear plants. Today, about 436 nuclear reactors are in operation.
Since the war in Ukraine, uranium has drawn increased attention given its role in nuclear weapons. Ukraine had 15 nuclear reactors depending on uranium from Russia, but the country rapidly signed a deal with Canada due to their exposure to the crisis.
Similar to Ukraine, nuclear reactors in Finland were at risk since their Russian-made reactors relied on the know-how of Russian firms.
While uranium is used for defense purposes, it also plays a key role in electricity generation thanks to its low carbon footprint. In the U.S., about 19% of electricity is powered from nuclear plants, and around 10% of global electricity is from nuclear power sources.
This was originally posted on our Voronoi app. Download the app for free on iOS or Android and discover incredible data-driven charts from a variety of trusted sources.
The Decision Matrix Cheat Sheet
The Blue Ocean Strategy Cheat Sheet
The Ultimate Business Strategy Matrix
The Ultimate Productivity Matrix
The Ultimate Cognitive Bias Cheat Sheet
The Ultimate Negotiation Strategy Cheat Sheet
Follow Kevin in LinkedIn : https://www.linkedin.com/in/kevin-box/
In an increasingly connected world, smartphones have become an inseparable part of our lives.
Over 60% of the world’s population owns a mobile phone and smartphone adoption continues to rise in developing countries around the world.
While each brand has its own mix of components, whether it’s a Samsung or an iPhone, most smartphones can carry roughly 80% of the stable elements on the periodic table.
But some of the vital metals to build these devices are considered at risk due to geological scarcity, geopolitical issues, and other factors.
Smartphone Part Critical Metal
Touch Screen indium
Display lanthanum; gadolinium; praseodymium; europium; terbium; dysprosium
Electronics nickel, gallium, tantalum
Casing nickel, magnesium
Battery lithium, nickel, cobalt
Microphone, speakers, vibration unit nickel, praseodymium, neodymium, gadolinium, terbium, dysprosium
What’s in Your Pocket?
This infographic based on data from the University of Birmingham details all the critical metals that you carry in your pocket with your smartphone.
1. Touch Screen
Screens are made up of multiple layers of glass and plastic, coated with a conductor material called indium which is highly conductive and transparent.
Indium responds when contacted by another electrical conductor, like our fingers.
When we touch the screen, an electric circuit is completed where the finger makes contact with the screen, changing the electrical charge at this location. The device registers this electrical charge as a “touch event”, then prompting a response.
2. Display
Smartphones screens display images on a liquid crystal display (LCD). Just like in most TVs and computer monitors, a phone LCD uses an electrical current to adjust the color of each pixel.
Several rare earth elements are used to produce the colors on screen.
3. Electronics
Smartphones employ multiple antenna systems, such as Bluetooth, GPS, and WiFi.
The distance between these antenna systems is usually small making it extremely difficult to achieve flawless performance. Capacitors made of the rare, hard, blue-gray metal tantalum are used for filtering and frequency tuning.
Nickel is also used in capacitors and in mobile phone electrical connections. Another silvery metal, gallium, is used in semiconductors.
4. Microphone, Speakers, Vibration Unit
Nickel is used in the microphone diaphragm
Alloys containing rare earths neodymium, praseodymium and gadolinium are used in the magnets contained in the speaker and microphone. Neodymium, terbium and dysprosium are also used in the vibration unit.
5. Casing
6. Battery
Source : https://www.visualcapitalist.com/visualizing-the-critical-metals-in-a-smartphone/
Construction delay claims are a common occurrence in projects. When they arise, they need to be evaluated quickly and managed efficiently. However, the whole topic of delay and the various analytical techniques available is one that provokes much debate and con troversy due to the seemingly complex and sometimes conflicting guidance provided on these techniques. The purpose of this book is to serve as a practical guide to the pro cess of delay evaluation and includes an in-depth review of the primary delay analysis methodologies available.
Credits: Willey Blackwell / P.J.Keane & A.F. Caletra
Mitesh Bhatt, LinkedIn
Gestión del cierre de minas en el Perú
Estudio técnico-legal sobre el alcance de la legislación peruana en el cierre de operaciones mineras.
Se espera que el presente estudio constituya una herramienta para brindar al lector una idea general de la gestión del cierre de minas en el Perú y su repercusión en la gestión minera ambiental, con el fin de que le sirva de referencia en la toma de decisiones en cualquiera de los ámbitos donde se desenvuelva.
Credits: Carla Rodríguez, Dolfer Julca
Estudio realizado por la CEPAL en conjunto con BGR y la Cooperación Alemana en el año 2020.
Economic and Investing Principles Cheat Sheet
Every Finance Formula you'll ever need in 1 PDF:
🎯Time Value of Money
🎯 Discounted Cash Flow
🎯Profitability Concepts
🎯Common Probability Distributions
🎯Sampling and Estimation
🎯Technical Analysis
🎯Demand and Supply Analysis
🎯Aggregate Output, Prices and Economic Growth
🎯Understand Business Cycles
🎯Currency Exchange Rates
🎯Financial Statement Analysis
🎯Understanding Cash Flow Statements
🎯Financial Analysis Techniques
🎯Inventories
🎯Long Lived Assets
🎯Income Taxes
🎯Capital Budgeting
🎯Cost of Capital
🎯Measures of Leverage
🎯Dividends and Share Repurchase Basics
🎯Working Capital Management
🎯Portfolio Risk and Return
🎯Market Organization and Structure
🎯Security Market Indices
🎯Equity Valuation
🎯Fixed Income Valuation
🎯Fixed Income Risk and Return
Source:
https://www.icicidirect.com/idirectcontent/FinancialEducation/StaticData/ICFLCFABooklet.pdf
Chris Quinn, LinkedIn
Warning: Sci-fi video with very realistic footages.
This video contains very real depictions of potential workplace injuries. There are examples of non-compliance with basic safety rules and the consequences that can occur.
You can share this with your team so they understand the importance of safety.
Source: LifeLeak (unknown)
La NASA a le projet de construire sur la Lune des maisons imprimées en 3D via du béton lunaire conçu à partir d'éclats de roche, de fragments minéraux et de poussière qui se trouvent sur la couche supérieure de la surface de la lune
Alors que la Nasa vient de lancer un appel d’offres pour la conception d’un congélateur lunaire, d’autres grands projets sont en cours pour les décennies à venir, et le New York Times s’est intéressé aux habitations prévues pour… 2040. Le grand quotidien américain a interrogé sept scientifiques de la NASA sur le projet de maisons construites avec une imprimante 3D sur la Lune !
Le plan prévoit en effet l’envoi d’une imprimante 3D. Une fois sur place, les astronautes « maçons » utiliseront du béton lunaire constitué d’éclats de roches, de fragments de minéraux et de poussières que l’on trouve sur la couche supérieure de la surface de la lune.
Un kilo de matériau envoyé sur la Lune, c’est un million de dollars !
Mais pourquoi utiliser la matière sur place plutôt que de ramener les matériaux à chaque mission ? « Voyager léger est essentiel » rappelle le docteur Patrick Suermann, doyen de l’école d’architecture de la Texas A&M University, qui travaille en étroite collaboration avec la NASA pour développer un système de construction robotisé dans l’espace.
Selon lui, chaque kilo supplémentaire transporté par une fusée vers la Lune coûte environ un million de dollars ! « Il n’y a pas de Home Depot (magasin de bricolage) là-haut. Il faut donc soit savoir utiliser ce qui existe, soit envoyer tout ce dont on a besoin » poursuit-il.
Sur Terre, l’imprimante 3D construit une maison en 48 heures
Le choix s’est donc porté sur ICON, une entreprise de construction basée à Austin, au Texas. Elle utilise déjà des imprimantes 3D pour créer des maisons, dont certaines sont conçus pour résister aux ouragans au Mexique ! L’imprimante peut construire des maisons en 48 heures seulement…
Avec ce partenaire, la NASA travaille actuellement à la mise au point d’une simulation du béton lunaire capable de résister à des températures allant jusqu’à 1900 degrés ! Des tests seront effectués sur Terre et dans son Marshall Space Flight Center, situé dans l’Alabama, la Nasa dispose d’une douzaine de chambres d’essai qui soumettent les objets aux mêmes conditions de rayonnement et de vide thermique qu’ils supporteraient hors Terre. En février 2024, ce sera au tour de l’imprimante d’ICON d’y être testé.
Source: Science et vie, PUBLIÉ LE 08 OCT 2023
https://www.science-et-vie.com/ciel-et-espace/nasa-imprimante-3d-maison-lune-115097.html
Only 38% have weekly one-on-one meetings.
Employees that have regular one-on-ones:
- Are 3x more engaged on the job (Source: Gallup)
They are the bestinvestment you can make in your employees.
I offer 5 tips each for managers and employees.
Steal my guide for INCREDIBLE one-on-ones.
Uranium was discovered just over 200 years ago in 1789, and today, it’s among the world’s most important energy minerals.
Throughout history, several events have left their imprints on global uranium production, from the invention of nuclear energy to the stockpiling of weapons during the Cold War.
The above infographic visualizes over 70 years of uranium production by country using data from the Nuclear Energy Agency.
The Pre-nuclear Power Era
The first commercial nuclear power plant came online in 1956. Before that, uranium production was mainly dedicated to satisfying military requirements.
In the 1940s, most of the world’s uranium came from the Shinkolobwe Mine in the Belgian Congo. During this time, Shinkolobwe and Canada’s Eldorado Mine also supplied uranium for the Manhattan Project and the world’s first atomic bomb.
However, the end of World War II marked the beginning of two events that changed the uranium industry—the Cold War and the advent of nuclear energy.
Peak Uranium
Between 1960 and 1980, global uranium production increased by 53% to reach an all-time high of 69,692 tonnes. Here’s a breakdown of the top uranium producers in 1980:
Country 1980 Production (tonnes U) % of Total
U.S. 🇺🇸 16,811 24%
USSR 15,700 23%
Canada 🇨🇦 7,150 10%
South Africa 🇿🇦 6,146 9%
East Germany 🇩🇪 5,245 8%
Niger 🇳🇪 4,120 6%
Namibia 🇳🇦 4,042 6%
France 🇫🇷 2,634 4%
Czechoslovakia 🇨🇿 2,482 4%
Australia 🇦🇺 1,561 2%
Other 🌎 3,801 5%
Total 69,692 100%
Several factors drove this rise in production, including the heat of the Cold War and the rising demand for nuclear power. For example, the U.S. had 5,543 nuclear warheads in 1957. 10 years later, it had over 31,000, and the USSR eventually surpassed this with a peak stockpile of around 40,000 warheads by 1986.
Additionally, the increasing number of reactors worldwide also propelled uranium production to new highs. In 1960, 15 reactors were operating globally. By 1980, this number increased to 245. What’s more, after the Oil Crisis in 1973, nuclear power emerged as a viable alternative to fossil fuels, and the price of uranium tripled between 1973 and 1975. Although the increase in uranium production was less dramatic, high prices made mining more profitable.
However, several nuclear accidents in the world such as the Three Mile Island reactor meltdown in the U.S. in 1979 and the Chernobyl disaster in Ukraine in 1986 brought a stop to the rapid growth of nuclear power. Furthermore, following the end of the Cold War, military stockpiles of uranium were used as “secondary supply”, reducing the need for mine production to some extent. As a result, uranium production declined sharply after 1987.
Harnessing the power of spreadsheets to streamline data, analyze trends, and make informed decisions.
Let's connect and discuss how Excel can drive efficiency in your projects!
Follow Dr.Vaishali Dixit for more contents..🤗
Credit:Towson University
The main purpose of the Handbook is to explain in plain language how to develop safe work practices and to meet the statutory and common contract requirements in undertaking construction works. It is not intended to cover each and every type of workplace scenario, nor to be used as a pictorial guide of do’s and don’ts. The focus is to address the most common – and hence more accident-prone - hazards found in Hong Kong’s worksites. More specifically, the objectives are :
▪ To fill a knowledge gap on some site safety issues
▪ To provide handy reference of best practices for frontline management teams
▪ To offer some site safety management techniques and tools for use.
Credits: Real Estate Developers Association of Hong Kong & Hong Kong Construction Association
Mitesh Bhatt, LinkedIn
While the global economy relies on many commodities, none come close to the massive scale of the oil market.
Besides being the primary energy source for transportation, oil is a key raw material for numerous other industries like plastics, fertilizers, cosmetics, and medicine. As a result, the global physical oil market is astronomical in size and has a significant economic and geopolitical influence, with a few countries dominating global oil production.
The above infographic puts crude oil’s market size into perspective by comparing it to the 10 largest metal markets combined. To calculate market sizes, we used the latest price multiplied by global production in 2022, based on data from TradingEconomics and the United States Geological Survey (USGS).
Note: This analysis focuses on raw and physical materials, excluding derivative markets and alloy materials like steel.
How Big Is the Oil Market?
In 2022, the world produced an average of 80.75 million barrels of oil per day (including condensates). That puts annual crude oil production at around 29.5 billion barrels, with the market size exceeding $2 trillion at current prices.
That figure dwarfs the combined size of the 10 largest metal markets:
Commodity 2022 Annual Production Market Size
Crude Oil 29.5 billion barrels $2.1 trillion
Iron Ore 2.6 billion tonnes $283.4 billion
Gold 3,100 tonnes $195.9 billion
Copper 22 million tonnes $183.3 billion
Aluminum 69 million tonnes $152.6 billion
Nickel 3.3 million tonnes $68.8 billion
Zinc 13 million tonnes $30.9 billion
Silver 26,000 tonnes $19.9 billion
Molybdenum 250,000 tonnes $12.9 billion
Palladium 210 tonnes $9.5 billion
Lead 4.5 million tonnes $9.2 billion
Based on prices as of June 7, 2023.
The combined market size of the top 10 metal markets amounts to $967 billion, less than half that of the oil market. In fact, even if we added all the remaining smaller raw metal markets, the oil market would still be far bigger.
This also reflects the massive scale of global oil consumption annually, with the resource having a ubiquitous presence in our daily lives.
The Big Picture
While the oil market towers over metal markets, it’s important to recognize that this doesn’t downplay the importance of these commodities.
Metals form a critical building block of the global economy, playing a key role in infrastructure, energy technologies, and more. Meanwhile, precious metals like gold and silver serve as important stores of value.
As the world shifts towards a more sustainable future and away from fossil fuels, it’ll be interesting to see how the markets for oil and other commodities evolve.
Source: https://elements.visualcapitalist.com/sizing-up-the-o
The Rise of the Steel Age
From the bronze age to the iron age, metals have defined eras of human history. If our current era had to be defined similarly, it would undoubtedly be known as the steel age.
Steel is the foundation of our buildings, vehicles, and industries, with its rates of production and consumption often seen as markers for a nation’s development. Today, it is the world’s most commonly used metal and most recycled material, with 1,864 million metric tons of crude steel produced in 2020.
This infographic uses data from the World Steel Association to visualize 50 years of crude steel production, showcasing our world’s unrelenting creation of this essential material.
The State of Steel Production
Global steel production has more than tripled over the past 50 years, despite nations like the U.S. and Russia scaling down their domestic production and relying more on imports. Meanwhile, China and India have consistently grown their production to become the top two steel producing nations.
Below are the world’s current top crude steel producing nations by 2020 production.
Rank Country Steel Production (2020, Mt)
#1 🇨🇳 China 1,053.0
#2 🇮🇳 India 99.6
#3 🇯🇵 Japan 83.2
#4 🇷🇺 Russia* 73.4
#5 🇺🇸 United States 72.7
#6 🇰🇷 South Korea 67.1
#7 🇹🇷 Turkey 35.8
#8 🇩🇪 Germany 35.7
#9 🇧🇷 Brazil 31.0
#10 🇮🇷 Iran* 29.0
Source: World Steel Association. *Estimates.
Despite its current dominance, China could be preparing to scale back domestic steel production to curb overproduction risks and ensure it can reach carbon neutrality by 2060.
As iron ore and steel prices have skyrocketed in the last year, U.S. demand could soon lessen depending on the Biden administration’s actions. A potential infrastructure bill would bring investment into America’s steel mills to build supply for the future, and any walkbalk on the Trump administration’s 2018 tariffs on imported steel could further soften supply constraints.
Steel’s Secret: Infinite Recyclability
Made up primarily of iron ore, steel is an alloy which also contains less than 2% carbon and 1% manganese and other trace elements. While the defining difference might seem small, steel can be 1,000x stronger than iron.
However, steel’s true strength lies in its infinite recyclability with no loss of quality. No matter the grade or application, steel can always be recycled, with new steel products containing 30% recycled steel on average.
The alloy’s magnetic properties make it easy to recover from waste streams, and nearly 100% of the steel industry’s co-products can be used in other manufacturing or electricity generation.
Source: https://elements.visualcapitalist.com/50-years-of-global-steel
Now the words ‘High Performance Concrete’, ‘Ready Mix Concrete’, ‘Self Compacting Concrete’ are commonly heard not only among the civil engineering community but common people also. With so much of awareness about concrete all around, there is a need that civil engineers should be more aware and informed about concrete technology. They should keep themselves abreast with the latest developments, new technological advances and future prospects.
Credits: Indian Railway Institute of Civil Engineering, Pune
Mitesh Bhatt, LinkedIn
Rare Earth Elements: The Technology Metals
In the midst of our daily hustle and bustle, we often don’t notice the raw materials that go into the technologies we rely on.
Rare earth metals, also known as rare earth elements or simply “rare earths”, are one such group of raw materials. From this group of 17 minerals, many are found in a range of technologies—from our smartphones and laptops to electric vehicles and wind turbines.
Rare Earth Metals Production Over the Years
Despite the relative abundance of rare earth deposits, extracting them from the ground is difficult, and preparing them for usage entails significant environmental risks.
The U.S. was the world’s leading producer of rare earth metals from the 1960s to the 1980s. However, China took the helm in the 1990s and has been the dominant producer ever since.
Year U.S. Production (metric tons) China’s Production (metric tons) ROW Production (metric tons) U.S. % Share China’s % Share
1985 13,428 8,500 17,757 34% 21%
1990 22,713 16,480 20,917 38% 27%
1995 22,200 48,000 9,700 28% 60%
2000 5,000 73,000 5,500 6% 87%
2005 0 119,000 3,000 0% 98%
2010 0 120,000 11,000 0% 92%
2015 5,900 105,000 19,100 5% 81%
2020 38,000 140,000 62,000 16% 58%
In 1985, China introduced a policy that partially refunded the taxes paid by domestic producers of rare earths, which lowered costs for Chinese mining companies. This, in addition to lax environmental regulations and cheap labor, made China’s rare earth industry increasingly competitive. In fact, its production increased 464% between 1985 and 1995.
Meanwhile, in California, the Mountain Pass Mine struggled to compete with Chinese producers while facing stringent environmental regulations. Therefore, the U.S. share of production declined from 34% in 1985 to 6% in 2000 before ceasing completely in 2002.
Putting Rare Earths in Different Baskets
In 2010, China slashed its rare earth export quotas by 37%, pushing rare earth prices to all-time highs. This, in turn, fueled an influx of capital into the rare earth mining industry and kickstarted mining in other countries.
Namely, Australia saw a 672% increase in rare earth production over the last decade, and more recently, Myanmar entered the mix—producing 30,000 metric tons of rare earths in 2020. Additionally, the Mountain Pass Mine is undergoing a revival following an investment from MP Materials in 2018. As a result, the U.S. share of production is growing again.
While the mining of rare earth metals is diversifying, 80% of refining still occurs in China. With the demand for rare earths projected to double by 2030, building both mining and refining capacity overseas may prove key in reducing reliance on China.
The cost level is a very important factor in most construction decisions, and its estimates are prepared during the planning, design and construction phases of a construction project. Various types of cost estimates are made in a construction project, from preliminary estimates to detailed estimates. All these estimates are important because they invariably influence the expenditure of major expenses. Estimates made in the early stages of a project are of particular importance, as they influence the most basic decisions related to the construction project.
Cost estimation can be defined in various ways. For example, estimation is the assembly of all the costs of the elements of a project, which for an entrepreneur represents the cost that will most likely be incurred for the completion of the project. In another definition, it is a statement-making about the approximate amount of materials, time, and costs to take construction decisions. Cost estimation is also defined as the process of analyzing a specific work and predicting the cost of performing it. The main challenges facing the construction contractor are estimating the cost of building a project, scheduling specific construction activities, and then building the project within the estimated cost and schedule.
Source: Rahul kumar
Source: Credits to Adrian Alexandru ȘERBĂNOIU and Cătălina Mihaela GRĂDINARU
Although the practice of gold mining has been around for thousands of years, it’s estimated that roughly 86% of all above-ground gold was extracted in the last 200 years.
With modern mining techniques making large-scale production possible, global gold production has grown exponentially since the 1800s.
The above infographic uses data from Our World in Data to visualize global gold production by country from 1820 to 2022, showing how gold mining has evolved to become increasingly global over time.
A Brief History of Gold Mining
The best-known gold rush in modern history occurred in California in 1848, when James Marshall discovered gold in Sacramento Valley. As word spread, thousands of migrants flocked to California in search of gold, and by 1855, miners had extracted around $2 billion worth of gold.
The United States, Australia, and Russia were (interchangeably) the three largest gold producers until the 1890s. Then, South Africa took the helm thanks to the massive discovery in the Witwatersrand Basin, now regarded today as one of the world’s greatest ever goldfields.
South Africa’s annual gold production peaked in 1970 at 1,002 tonnes—by far the largest amount of gold produced by any country in a year.
With the price of gold rising since the 1980s, global gold production has become increasingly widespread. By 2007, China was the world’s largest gold-producing nation, and today a significant quantity of gold is being mined in over 40 countries.
The Top Gold-Producing Countries in 2022
Around 31% of the world’s gold production in 2022 came from three countries—China, Russia, and Australia, with each producing over 300 tonnes of the precious metal.
Rank Country 2022E Gold Production, tonnes % of Total
#1 🇨🇳 China 330 11%
#2 🇷🇺 Russia 320 10%
#3 🇦🇺 Australia 320 10%
#4 🇨🇦 Canada 220 7%
#5 🇺🇸 United States 170 5%
#6 🇲🇽 Mexico 120 4%
#7 🇰🇿 Kazakhstan 120 4%
#8 🇿🇦 South Africa 110 4%
#9 🇵🇪 Peru 100 3%
#10 🇺🇿 Uzbekistan 100 3%
#11 🇬🇭 Ghana 90 3%
#12 🇮🇩 Indonesia 70 2%
- 🌍 Rest of the World 1,030 33%
- World Total 3,100 100%
North American countries Canada, the U.S., and Mexico round out the top six gold producers, collectively making up 16% of the global total. The state of Nevada alone accounted for 72% of U.S. production, hosting the world’s largest gold mining complex (including six mines) owned by Nevada Gold Mines.
Meanwhile, South Africa produced 110 tonnes of gold in 2022, down by 74% relative to its output of 430 tonnes in 2000. This long-term decline is the result of mine closures, maturing assets, and industrial conflict, according to the World Gold Council.
Hard commodities had a roller coaster year in 2022.
While prices for some commodities stabilized after skyrocketing on the heels of the pandemic, others delivered stellar returns. Behind the volatility was a plethora of factors, including the Russia-Ukraine war, the global economic slump, and a drop in China’s demand for materials.
This chart uses price data from TradingEconomics to highlight the 10 best and worst performing hard commodities of 2022. It excludes soft commodities like agricultural products and meat.
Energy Crisis Sets Coal on Fire
The global economic rebound of 2021, which set the fastest post-recession growth pace in the last 80 years, sparked coal prices as energy demand increased. Russia’s invasion of Ukraine ignited the spark, with coal prices exploding 157% in 2022.
Consequently, coal was the best performing commodity in 2022, far outperforming the other nine top commodities by returns.
Rank Commodity 2022 Returns
#1 Coal 157%
#2 Lithium 87%
#3 Nickel 43%
#4 Titanium 27%
#5 Heating oil 21%
#6 Uranium 12%
#7 Platinum 9%
#8 Molybdenum 4%
#9 Iron ore 1%
#10 Gold 1%
Lithium (carbonate) and nickel prices continue to be supercharged by the demand for EVs and batteries. Since the beginning of 2021, lithium prices have increased 11-fold, and remain elevated at more than $70,000 per tonne.
As a result of high prices for lithium, nickel, and other battery metals, the average cost of lithium-ion battery packs increased in 2022, for the first time since 2010. Battery pack prices are expected to increase in 2023 as well, before falling in 2024.
The year was also positive for uranium as countries revived their nuclear power plans to combat the energy crunch. Notably, Germany extended the lifetime of three plants that were set to shut down in 2022, and Japan announced accelerated restarts for several idle reactors.
The 10 Biggest Commodity Drawdowns
The negative returns for most commodities can be largely attributed to prices stabilizing at lower levels after bullish runs in 2021 and the beginning of 2022.
Rank Commodity 2022 Returns
#1 Magnesium -54%
#2 Tin -37%
#3 Propane -37%
#4 Rubber -26%
#5 Cobalt -26%
#6 Natural Gas TTF -20%
#7 Naphtha -19%
#8 Zinc -18%
#9 Copper -16%
#10 Aluminum -16%
For example, magnesium prices more than halved in 2022, declining from an all-time high in September 2021. Similarly, tin prices also normalized after rising due to unprecedented demand from the electronics sector during the economic rebound from the pandemic.
Source: https://elements.visualcapitalist.com/the-top-10-best-and-worst-performing-commodities-of-2022/
From countless coaching sessions and trainings, I've gathered the Top 10 dashboard best practices every data professional should know.
I'm willing to share the high-resolution visual again, even if I probably sacrifice an evening or two again 😂
In this visual, you'll find best practices about :
A - Using margins. Space in a dashboard is as good as silence in a conversation.
B - Using an easy-to-read font to improve usability and accessibility.
C - Reducing the clutter. The less, the better, always.
D - Using text size and style to catch the eye of users.
E - Picking the right chart for the right purpose.
F - Removing unnecessary elements to reduce clutter (again).
G - Following the Z pattern while building your dashboard (careful about cultural reading orientation).
H - Providing context for big numbers.
I - Grouping connected elements when there is a link between them.
J - Improving readability by rotating text and chart.
Source: Aurélien Vautier, LinkedIn
Fire Extinguisher Types and Classes. The six main fire extinguisher types are water, foam, CO2, powder, water mist and wet chemical. Each of the different types of fire extinguisher is suitable for different fire classes.
Source: Ammar Al Rawahi, LinkedIn
1- Down hole problems
A- stuck pipe: When the drill string is no longer free to move up, down, or rotate as the driller wants it to, the drill pipe is stuck. Sticking can occur while drilling, making a connection, logging, testing, or during any kind of operation which involves leaving the equipment in the hole.
B- Shale Instability
3- Unconsolidated Formation
4-Fractured Formation
5- Cement Blocks
B- LOST CIRCULATION
C- WELL CONTROL
Source: Manar Chirine KHITER, LinkedIn
Herish .w. noree , Kirkuk oil training institute
Comentario de Rosana Ferrero, PhD:
📚 Uno de mis libros favoritos, excelente para aquellos que buscan una introducción al #DataScience y #MachineLearning
👉 Aprende conceptos de manera clara y concisa, con ejemplos increíbles
En la actualidad las aplicaciones de la energía eléctrica siguen aumentando y el sector de la construcción acompaña a ese aumento.
Desde maquinaria pesada que funciona con energía eléctrica como el caso de las grandes excavadoras que se emplean en minas, hasta excavadoras mini que se emplean en construcción que ya funcionan con baterías recargables o con suministro exterior de generadores eléctricos, pasando por las clásicas grúas torre y, sobre todo, la mayor parte de las herramientas portátiles que son necesarias para la ejecución de las obras.
Llegado a este punto, no hay que olvidarse de los riesgos eléctricos que se presentan en las distintas actividades que realizan los trabajadores de la construcción.
Si se examinan los datos de las estadísticas de accidentes de trabajo durante el año 2017 en el sector de la construcción, los accidentes por contactos directos o indirectos con la electricidad durante la jornada de trabajo, se aprecia que:
- 0,3 % son accidentes leves.
- 1,8 % son accidentes graves o muy graves.
- 3 % son accidentes mortales.
Este último resultado refleja que los trabajos con riesgos eléctricos tienen consecuencias muy graves que hacen necesario tomar las medidas preventivas necesarias para eliminar o minimizar el riesgo por contactos directos o indirectos con la electricidad
Source: Fundación Laboral de la Construcción, gobierno de Espana
On 9 July 2019, a boilermaker at Ravensworth open cut mine was lancing a rear suspension link pin of a Caterpillar haul truck after it had become seized during the removal process. After quenching the pin with water, steam rapidly formed and ejected the pin under pressure. The pin, weighing 46.7kg, was propelled at the boilermaker, hitting him in his left hip and knocking him over. The boilermaker suffered a stress fracture and bruising to his left hip, a greenstick fracture to his left thumb and minor facial and eye injuries from the slag spray.
Source: NSW Resources Regulator
Content:
1/ Why you need to forecast your headcount spend
2/ How to Forecast your headcount spend
3/ How to Calculate Projected Spend
4/ Putting it all together
⭐️ 1/ Why you need to forecast your headcount spend
Your headcount spend will often account for 50-80% of your cash burn each month.
A good forecast can help determine what is the breakeven point for the company to cover the structure costs.
It helps know the volume it needs to reach to be profitable.
Your headcount spend can also be one of the most challenging costs to reduce, with a number of challenges ensuing from lay offs.
Foremost define your needs for the next 12 to 24 months depending on your backlog and sales projections.
⭐️ 2/ How to Forecast your headcount spend?
Start by collecting information on your existing hires from your payroll platform, and entering it into a spreadsheet.
Next, begin adding your projected hires one by one.
For a long range forecast (12 months or more into the future), add roles in bulk.
If you have department heads, check with them on their upcoming hiring plan.
Consolidate and review the consistency of all headcount with the management team.
⭐️ 3/ How to Calculate Projected Headcount Spend
3.1/ The Simple Method
Determine the departments with direct FTE depending on the business volume.
Apply the business growth ratio to the direct FTE to calculate the additional headcount.
Use one salary increase rate across the board to calculate the salary costs of next year.
Your salary costs of next year should be:
Number of FTE next year x Average Salary pro FTE current year x (1+Salary increase)
3.2/ The Detailed Method
Prorate the salary for any hires who joined this month, or were terminated.
Full time employees have a number of other incidental costs.
-Employer Payroll taxes
Around 8-10% of salary
-Health Benefits
Around 8-10% of salary, or a fixed $ amount per employee
-Payroll processing fees
Around 25% of salary, or a fixed $ amount per employee
Other payroll costs to consider:
-Bonuses Commissions (could be monthly, quarterly or annually)
-Recruiting fees (often times a % of first year salary)
-Training costs
-Additional structure costs (place, energy, equipment, could be marginal if the structure is already big, but for smaller team, this is an impact to consider)
⭐️ 4/ Putting it all together
Slice and dice your data on a departmental basis, and by each cost type.
Use Graphs to understand costs & hires by department, and across multiple periods.
Use ratio like FTE increase vs sales increase.
Source: Nicolas Boucher
Nicolas Boucher Online
We may sometimes become indecisive, confused, or stuck in our careers.
And it is okay to feel that way.
As long as we reflect and intentionally try to find answers, get clarity, and develop an actionable plan.
Today, I'm sharing an easy-to-follow guide to help you achieve that.
Answer the questions I have provided, and I hope you will have a starting point to build on it further.
Please let me know in the comments if you have decided the course of action you would like to take.
Here's what you will find inside the guide:
✅ Three most common questions I get.
✅ My most common response
✅ What happens when they can't find answers?
✅ Three steps to career exploration
✅ Five things to keep in mind
✅ 13 questions to help you get clarity
✅ Three most important questions
Source : Abdul Khaliq, LinkedIn
This handbook addresses problems facing the engineer when preparing to build, both during the contract bidding phase and after a contract has been concluded.
It offers clear guidelines for planning the resources and machinery on site, as well as the safe positioning of roads, cranes, storage and temporary buildings. Site planning activities are presented here in logical sequence, offering an efficient and safe design of the construction site and of the temporary works.
The book describes the process of engineering preparation of on-site construction works in all phases of the construction life-cycle, from the design phase - preparing the financial plan and procurement scheme for the owner before tendering the contract; the tendering phase; and after bid completion. A list of procedures is presented for planning the construction site in order to simplify the engineer's work of site and temporary works planning.
The Engineer's Manual of Construction Site Planning is for all those involved in the planning of construction sites, construction managers, construction engineers and quantity surveyors, as well as for students in civil engineering and construction.
Source: LinkedIn
TOP SIGNS 📉
1. Large Number of IPO
2. Rapidly Rising Prices
3. High Merger & Acquisition Activity
4. Easy Availability of Credit
5. Optimistic Covers of Newspapers & Magazines
6. Higher Than Average Trading Volumes
7. Historically High Valuation Multiples
8. Art & Luxury Markets Booming
9. Financial Media Viewership Soars
10. "This Time is Different" Declared
11. Amateur Investors Move To Equities Asset Class
12. Speculative Assets Prices Spike
13. Record Venture Capital Funding
BOTTOM SIGNS 📈
1. No Mergers and Acquisitions
2. No IPOs
3. Low Venture Capital Funding
4. Historically Low Price/E & EV/EBITDA Multiples
5. Many Companies Trading Below Book Value
6. Speculate Asset Prices Down Huge
7. Central Banks Easing for 6+ Months
8. Recession Officially Declared
9. Previously Favorite Sectors are Hated
10. Credit Only Available to High-Quality Borrowers
11. Amateur Investors are Filled with Caution
12. Negative Covers of Newspapers and Magazines
13. Negative and Depressed Consumer Sentiment
Do you see more top or bottom signs right now?
Source : Brian Feroldi, LinkedIn
It is good to remember this....
The Incoterms or "International Commercial Terms" that helps to clarify responsibilities between the seller and the buyer when negotiating the purchase of goods, considering the different import and export regulations of the origin/destination countries.
Ah... how nice is to remember some of what I have learned and what I am passionate about in my career.
EXW (Ex Works): Seller makes the goods available at their own premises. Buyer handles all costs and risks from there onwards.
FCA (Free Carrier): Seller delivers goods to the carrier nominated by the buyer at a named location. Buyer assumes responsibility from that point.
FOB (Free On Board): Similar to FCA, but seller loads the goods onto the buyer's designated vessel at a named port.
CFR (Cost and Freight): Seller pays for transporting the goods to the named port of destination, but Buyer bears the risks and any additional costs from there.
CIF (Cost, Insurance, and Freight): Similar to CFR, but Seller also pays for minimum insurance against loss or damage during the carriage.
DAT (Delivered at Terminal): Seller delivers goods to a named terminal at the destination. Buyer handles unloading and any further costs.
DAP (Delivered at Place): Seller delivers goods to a named place (not necessarily a terminal) at the destination. Buyer handles unloading and any further costs.
DDP (Delivered Duty Paid): Seller delivers goods to the named place in the destination country, covering all customs clearance and import duties.
Source: Camilo Alfonso Garzón López, LinkedIn
Here's how the most successful leaders are motivating their teams:
In the book "Drive," Daniel H. Pink talks about 3 levels of motivation:
🌟 Motivation 1.0: Basic survival instincts.
🌟 Motivation 2.0: Reward-and-punishment driven, effective for routine, algorithmic tasks.
🌟 Motivation 3.0: Intrinsically motivated behavior that’s self-directed and driven by deeper psychological needs.
Here’s how you can implement Motivation 3.0 and transform your workplace:
1. Autonomy
→ Give them a voice in their work and decisions.
→ Flex hours and remote options aren’t perks; they’re necessities.
→ Fuel passion projects. Watch innovation soar!
2. Mastery
→ Invest in professional development.
→ Challenge your team but provide support.
→ Constructive feedback isn’t criticism. It’s a growth tool.
3. Purpose
→ Show how each role contributes to the grand vision.
→ Align work with meaningful values.
→ Social impact projects aren’t just good PR; they give work a heart.
4. Recognition
→ Applaud successes, big and small.
→ Personalized appreciation speaks louder than bonuses.
→ Non-monetary rewards? They’re surprisingly powerful.
5. Environment
→ Collaboration, respect, and inclusivity aren’t optional.
→ Safety and balance are the bedrock of productivity.
→ Open dialogue fuels innovation and trust.
6. Continuous Improvement
→ Your employees’ ideas are gold mines. Dig in!
→ Encourage creativity; break the mold.
→ Change is not a threat; it’s an opportunity.
Cradits:
Wouter Durville, LinkedIn
Five Fundamental Principles Of Lean (James Womack & Daniel Jones, Lean Thinking):
I. Specify value: Value is defined by customer in terms of specific products & services
II. Identify the value stream: Map out all end-to-end linked actions, processes and functions necessary for transforming inputs to outputs to identify and eliminate waste
III. Make value flow continuously: Having eliminated waste, make remaining value-creating steps flow
IV. Let customers pull value: Customer pull cascades all the way back to the lowest level supplier, enabling just-in-time production
V. Pursue perfection: Pursue continuous process of improvement striving for perfection
Credit to: James P. Womack/Daniel T. Jones/TQMforbetterfuture
Mitesh Bhatt, LinkedIn
Companies with high-performing teams are 40% more likely to invest in team-building activities.
Why? Because they get these results:
1. Improved communication
2. Increased collaboration
3. Boosted productivity
4. Reduced turnover
5. Higher morale
6. Enhanced creativity
7. Stronger relationships
8. Increased engagement
9. Improved decision-making
10. Better problem-solving skills
➡️ The Ultimate Cheat Sheet on Team Building
Managers, take note...
I've included a great tool: the Drexler/Sibbet Model.
It walks you through the steps to:
• Create a team
• Build their trust
• Clarify your goals
• Secure commitment
• Implement your plans
• Attain high performance
• Decide what you'll do next
Need activity ideas? I've got 11 for you.
And they work for any team, anywhere.
They'll help your team learn to work better together.
Don't leave your team's success to chance.
Those 10 benefits of team building?
They're not just a wish list.
They're achievable.
Transform your team from good to great.
Because a great team isn't a maybe. It's a must.
Source: Justin Wrigh, LinkedIn
A best practice approach for infrastructure projects and programmes
Central to project discipline is the use of expert, evidence-based cost estimates. Establishing an early and accurate cost estimate is a key factor in selecting the right projects and delivering them on time and on budget.
However, a cost estimate is not a single figure that is determined at the start of a project and fixed from therein. The cost estimate evolves over time as the project matures and is inherently linked to the development of the project scope and schedule.
The cost estimate should be presented as a range to account for the level of risk and uncertainty inherent in the project and this range should decrease as the project develops.
At the heart of developing a robust cost estimate of the three ‘P’s:
- Principles - of cost estimating to get the basics right and address common pitfalls
- People - roles, skills and behaviours needed to deliver, assure and own the cost estimate
- Performance - steps for improving the quality and consistency of cost estimates and surrounding processes
This document sets out, for the first time, a best practice approach to cost estimating which should be used by all major infrastructure projects and programmes in the UK. This guidance document is for all project delivery team members including Senior Responsible Owners and Project Directors.
Nothing less than world class delivery will do and this document is another step towards that vision, helping those involved in project delivery to thrive and deliver projects and programmes to the benefit of all the citizens in the United Kingdom.
Nick Smallwood
Chief Executive,
Infrastructure and Projects Authority
Source: https://assets.publishing.service.gov.uk/media/6050c9528fa8f55d324b0c84/IPA_Cost_Estimating_Guidance.pdf
The Pan European Reserves and Resources Reporting Committee (PERC) Standard for Reporting of Exploration Results, Mineral Resources and Mineral Reserves (further referred to as the 'PERC Reporting Standard') sets out the minimum standards, additional guidelines and recommendations for the Public Reporting of Exploration Results (including Exploration Targets), Mineral Resources and Mineral Reserves.
Improved corporate governance and stock exchange regulation demand best practices in Mineral Resource Management and Public Reporting Standards. The PERC Reporting Standard is aligned with the CRIRSCO International Reporting Template for the Public Reporting of Exploration Targets, Exploration Results, Mineral Resources and Mineral Reserves, November 2019 (the ’CRIRSCO International Reporting Template 2019') developed by the Committee for Mineral Reserves International Reporting Standards (CRIRSCO).
To promote the consistency and best practice in minerals reporting in Europe, all of the PERC participating organisations, namely: the Institute of Materials, Minerals, and Mining (IOM3); the Institute of Geologists of Ireland (IGI); the Geological Society of London (GSL); the Fennoscandian Association for Metals and Minerals Professionals (FAMMP); the European Federation of Geologists (EFG); and the Iberian Mining Engineers Board (IMEB) promote the use of the PERC Reporting Standard. Members of these organisations who are involved in preparing information to support Public Reporting of Exploration Results, Mineral Resources and Mineral Reserves must use the definitions, principles and guidance defined in the PERC Reporting Standard, regardless of whether or not they are acting as a Competent Person. In several cases, the use of the PERC Reporting Standard has been adopted as a specific requirement of the professional organisation’s code of conduct.
Cause of Change
What causes the change from the revenue to EBITDA to Net Profit?
Observing the movement on the chart below will help you understand the cause of change.
Below are the explanations and calculations for each step depicted on the chart:
Revenue
• Revenue, also known as sales or turnover, is the total amount of money a company generates from its primary business activities.
COGS
• COGS refers to the direct costs associated with producing or manufacturing the goods or services that a company sells.
Gross Profit
• Gross Profit is the amount of money a company has left after subtracting the direct costs of producing its goods or services (COGS) from its total revenue.
• GP = Revenue – GOGS
OPEX
• OPEX are a company’s ongoing costs to operate its business. Include items such as rent, utilities, salaries, and marketing expenses.
Other Income
• Other Income refers to revenue generated by a company that is not directly related to its core business operations. This can include income from investments, interest, or other sources outside the company's primary activities.
EBITDA (Earnings Before Interest, Taxes, Depreciation, and Amortization)
• EBITDA is a measure of a company's operating performance. It excludes interest, taxes, and non-cash expenses like depreciation and amortization.
• EBITDA = GP – OPEX + Other Income
EBIT (Earnings Before Interest & Taxes)
• Depreciation and amortization are non-cash expenses that represent the allocation of the cost of tangible and intangible assets over time.
• EBIT = EBITDA – Depreciation
EBT (Earnings Before Taxes)
• Interest expenses represent the cost of borrowed funds. Subtract interest from the Adjusted EBITDA.
• EBT = EBIT – Interest Expense
Net Profit
• Subtract taxes from Earnings Before Taxes to arrive at Net Profit.
• Net Profit = Earnings Before Taxes - Taxes
Fuente: Abdul Khaliq, LinkedIn
Gold and silver have been precious and monetary metals for millennia, with the gold-to-silver ratio having been measured since the days of Ancient Rome.
Historically, the ratio between gold and silver played an important role in ensuring coins had their appropriate value, and it remains an important technical metric for metals investors today.
This graphic charts 200 years of the gold-to-silver ratio, plotting the pivotal historical events that have shaped its peaks and valleys.
What is the Gold-to-Silver Ratio?
The gold-to-silver ratio represents the amount of silver ounces equivalent to a single ounce of gold, enabling us to see if one of the two precious metals is particularly under or overvalued.
Currently, the ratio sits at about 80 ounces of silver equivalent to one ounce of gold. This is after the ratio spiked to new highs of 123.3 during the COVID-19 pandemic.
While gold is primarily viewed as an inflation and recession hedge, silver is also an industrial metal and asset. The ratio between the two can reveal whether industrial metals demand is on the rise or if an economic slowdown or recession may be looming.
The History of the Gold-to-Silver Ratio
Long before the gold-to-silver ratio was allowed to float freely, the ratio between these two metals was fixed by empires and governments to control the value of their currency and coinage.
The earliest recorded instance of the gold-to-silver ratio dates back to 3200 BCE, when Menes, the first king of Ancient Egypt set a ratio of 2.5:1. Since then, the ratio has only seen gold’s value rise as empires and governments became more familiar with the scarcity and difficulty of production for the two metals.
Gold and Silver’s Ancient Beginnings
Ancient Rome was one of the earliest ancient civilizations to set a gold-to-silver ratio, starting as low as 8:1 in 210 BCE. Over the decades, varying gold and silver inflows from Rome’s conquests caused the ratio to fluctuate between 8-12 ounces of silver for every ounce of gold.
By 46 BCE, Julius Caesar had established a standard gold-to-silver ratio of 11.5:1, shortly before it was bumped to 11.75:1 under emperor Augustus.
As centuries progressed, ratios around the world fluctuated between 6-12 ounces of silver for every ounce of gold, with many Middle Eastern and Asian empires and nations often valuing silver more highly than Western counterparts, thus having a lower ratio.
Source: https://elements.visualcapitalist.com/charting-the-gold-to-silver-ratio-over-200-years/
⭐Designing surface mining blasts involves a thorough understanding of the geological, geotechnical, and environmental factors.
⭕Geological Assessment:
◽Identify rock types, their hardness, and structural features.
◽Consider the presence of any natural fractures, faults, or weaknesses.
⭕Blasthole Design:
◽ Determine the optimal drill hole pattern and spacing.
◽ Drill hole diameter and depth should match the rock characteristics and desired fragmentation.
◽ Ensure proper burden (distance between blastholes) and spacing ratios.
⭕Explosive Selection:
◽ Choose explosives based on rock type, density, and desired fragmentation.
◽ Consider environmental impact and regulatory compliance.
⭕Initiation System:
◽Select an initiation system that ensures proper sequencing and timing of explosions.
◽Electronic initiation systems allow precise control over blast timing.
⭕Blast Design Software:
◽ Utilize specialized software for blast design to simulate and optimize blast outcomes.
◽Consideration of vibration, air blast, and flyrock limits is crucial.
⭕Vibration Control:
◽Monitor and control ground vibration to prevent damage to nearby structures.
◽Adjust blast parameters to minimize vibration levels.
⭕Flyrock Mitigation:
◽ Implement measures to control and minimize flyrock, which can pose safety hazards.
◽Use blast mats or berms to contain and redirect flyrock.
⭕Air Blast Control:
◽ Control air blast levels to prevent damage to structures and ensure compliance with regulations.
◽Adjust blast parameters and distances accordingly.
⭕Safety Measures:
◽ Implement strict safety protocols for personnel involved in the blasting process.
◽ Ensure a secure blast area, and use warning systems to alert workers.
⭕Environmental Impact:
◽ Minimize dust generation through water spraying or other dust suppression methods.
◽ Comply with environmental regulations and consider the impact on air and water quality.
⭕Monitoring and Evaluation:
◽Continuously monitor and evaluate blast performance.
◽Adjust future blasts based on lessons learned and changes in geological conditions.
Source: Karim El-behairy, LinkedIn
TBT introduced at the ISEE in Denver 2020 conference the first full 3D realistic blast simulation.
A major step in blast simulation that allows everyone to predict the outcome of a blast (mouvement, fragmentation, vibration, dilution and overbreak) with few minutes of computation.
The video shows the vibrations of the blast shaking the pit while the blast mouvement happened.
Color coding of the small blocks shows fragmentation or dilution.
Available to anyone who doesn't want to be surprised when pressing the trigger...
Source: I-Blast software - ISEE - Thierry Bernard, YouTube
The main advantages of kriging include:
- Rigorous statistical framework: Kriging is a rigorous statistical method that incorporates a measure of uncertainty and provides confidence intervals for the estimated values.
- Optimal interpolation: Kriging provides the optimal linear unbiased estimate of the variable of interest, given the assumptions about the data distribution and spatial autocorrelation.
- Ability to incorporate auxiliary data: Kriging can incorporate auxiliary data such as covariates or secondary data sources to improve the accuracy of the estimates.
-Flexibility: Kriging can be applied to various types of data, including continuous, categorical, and count data.
Limitations of Kriging
However, kriging also has limitations that should be considered:
Assumptions about data distribution and spatial autocorrelation: Kriging assumes that the data are stationary, normally distributed, and have a specific spatial autocorrelation structure. Violations of these assumptions can lead to inaccurate estimates.
Sensitivity to sample size and distribution: Kriging estimates are sensitive to the number and distribution of sample points. Sparse sampling or clustering of sample points can result in inaccurate predictions.
Computationally intensive: Kriging can be computationally intensive, especially for large datasets, and may require specialized software and hardware.
Difficulty in incorporating non-linear relationships: Kriging assumes a linear relationship between the variable of interest and the covariates. Non-linear relationships may require more complex modeling approaches.
Overall, kriging is a powerful and widely used method in GIS for spatial interpolation, but its limitations should be considered in the context of the specific dataset and research question. Other interpolation methods, such as inverse distance weighting or spline interpolation, may be more appropriate in some situations.
"Today, the data shows a looming mismatch between the world’s strengthened climate ambitions and the availability of critical minerals that are essential to realising those ambitions."
Minerals are essential components in many of today’s rapidly growing clean energy technologies – from wind turbines and electricity networks to electric vehicles. Demand for these minerals will grow quickly as clean energy transitions gather pace. This new World Energy Outlook Special Report provides the most comprehensive analysis to date of the complex links between these minerals and the prospects for a secure, rapid transformation of the energy sector.
Alongside a wealth of detail on mineral demand prospects under different technology and policy assumptions, it examines whether today’s mineral investments can meet the needs of a swiftly changing energy sector. It considers the task ahead to promote responsible and sustainable development of mineral resources, and offers vital insights for policy makers, including six key IEA recommendations for a new, comprehensive approach to mineral security.
Source: www.iea.org/reports/the-role-of-critical-minerals-in-clean-energy-transitions
1⃣ Return on Equity (ROE)
Measures the profitability of a company by calculating how much profit it generates for each dollar of shareholder's equity.
2⃣ Return on Assets (ROA)
Measures how efficiently a company is using its assets to generate profit. Tells you how much profit company is generating for each $ of its assets.
3⃣ Gross Profit Margin (GPM)
Measures how much money a company makes from its sales after deducting the cost of goods sold.
4⃣ Net Profit Margin
Measures how much money a company makes from its sales after deducting all of its expenses, including taxes and interest.
5⃣ Debt to Equity Ratio (D/E)
Measures the amount of debt a company has relative to its equity. It is calculated by dividing the total debt by the total equity.
6⃣ Working Capital Ratio
Measures a company's ability to meet its short-term financial obligations. It is calculated by dividing current assets by current liabilities.
7⃣ Accounts Receivable Turnover Ratio
Measures how quickly a company collects its money from its customers.
8⃣ Accounts Payable Turnover Ratio
Measures how quickly a company pays its suppliers.
9⃣ Inventory Turnover Ratio
Measures how quickly a company sells its inventory and replaces it with new inventory over a certain period of time.
🔟 Fixed Assets Turnover Ratio
Measures how efficiently a company is using its fixed assets (such as property, plant, and equipment) to generate revenue.
Source: Asif Masani
Link to download: https://fpnaprofessionals.teachable.com/p/my-downloadable-142081
The method of mining is unique for each different size and each shape of the orebody.
Mineral deposits differ in the shape and orientation of an orebody, the strength of the ore and surrounding rock, and the type of mineral distribution. These geological features influence the selection of a mining method and the plan for the ore development. Operating mines vary in size from small underground mines (with production under 100 tonnes of mineral a day) to large open pits excavating tens of thousands of tonnes of ore a day (Whyte and Cumming, 2007). Open pit mining is applied to the extraction of near-surface deposits.
Source: Izhar Mithal Jiskani
You aspire to a successful career?
Make sure to understand Tax
👉 Let me help you with my framework:
Timely compliance
Appropriate deductions
Xpert consultation
Entity structure
Strategic planning
Here is how it articulates (feel free to bookmark it for yourself):
T - Timely Compliance:
Timely tax filing and payment can avoid penalties and interest
- Develop a tax calendar to track deadlines
- Prepare and file tax returns promptly
- Ensure timely payment of tax liabilities
A - Appropriate Deductions:
Claiming all appropriate deductions can reduce tax liability
- Identify all potential tax deductions
- Maintain proper documentation for deductions
- Claim all applicable deductions in tax returns
X - eXpert Consultation:
Professional advice can result in significant tax savings
- Engage a tax consultant for complex issues
- Implement advice on tax planning strategies
- Keep up to date with tax law changes via expert guidance
E - Entity Structure:
The right business entity can optimize tax obligations
- Evaluate tax implications of different business structures
- Consult with a tax advisor to choose the right entity
- Review and update entity structure as needed
S - Strategic Planning:
Proactive tax planning can optimize tax efficiency
- Develop a strategic tax plan
- Implement tax-efficient investment strategies
- Monitor changes in tax laws and adjust the plan as needed
Source: Nicolas Boucher, LinkedIn
www.nicolasboucher.online
How to analyze data?
Analyzing data can be a tedious and time-consuming task. Also, there is no one right answer to this question.
Depending on the purpose and the goal of the analysis. There are different ways to do this.
1⃣ Drill Up and Drill Down
We can drill down and drill up to explore different aspects of business and move between levels of information.
✳️Drilling Down is the ability to move into further details from parent to child relationships to uncover root causes of anomalies.
✳️Drilling up is the move up from child to parent to look at the overall biggest picture or to move back and forth to drill up and down.
2⃣ Slicing and Dicing
Slicing and dicing refers to the ability to pivot the dimensions of the data on-the-fly.
Large blocks of data are cut into smaller segments and the process is repeated until the correct level of detail is achieved for proper analysis. It presents the data in new and diverse perspectives and provides a closer view of it for analysis.
3⃣ Segmentation
Grouping data with common attributes is especially useful for things like customer segmentation by customer type (e.g., small business, enterprise business, government).
4⃣ Data Visualization
Data visualization is the graphical representation of information and data. By using visual elements like charts, graphs, and maps. There are many data visualization tools that provide an accessible way to see and understand trends, outliers, and patterns in data.
5⃣ Driver Based Relationships
Dependency relationships (when one thing happens or changes, another thing happens or changes—in the same direction, or the opposite direction). Clustering relationships (uncovering independent relationships)
6⃣ Benchmarking
It is comparing results with internal benchmarks (those produced by other lines of business within your company). Or external benchmarks (those produced by peers in your industry).
External Benchmarking is a process where you measure our company’s success against other similar companies. To discover if there is a gap in performance that can be closed by improving our performance. Studying other companies can highlight what it takes to enhance our company’s efficiency and become a bigger player in our industry.
7⃣ Seasonality
presence of variations which occur at certain regular intervals, either on a weekly basis, monthly basis, or even quarterly. Various factors may cause seasonality - like vacati...
Source: Asif Masani, LinkedIn
www.fpnaprofessionals.teachable.com
🔶 Airflow Quantity Requirements for Underground Mines for Design Purposes – still the most experienced based/empirical feature of ventilation planning.
🔶 Some guidelines of first estimates without complete data
🔶 Strata Gas - provide enough airflow to dilute the concentration of the emitted gases to one half of the concentration at which the law requires both in terms of average threshold limit values over one shift and the short-term exposure limits.
🔶 Diesel Equipment
➖ 6 to 8 cubic meters of airflow per 100 kW of all diesel equipment - OR
➖150 cubic feet per minute (CFM) per horse power of all diesel equipment
🔶 Velocity Limits
➖ Working faces – 4 meters per second
➖ Main Haulage – 6 meters per second
➖ Hoisting Shaft – 10 meters per second
🔶 Selection of Multiple Variable Pitch Axial Flow Fans
➖ Select a combination of multiple fans that will meet the pressure-volume requirements with the combined operating point within the higher range of fans’ efficiency
Thanks to SRK Consulting for making this valuable resource publically available.
Source:
https://www.srk.com/en/products/ventilation-textbook
Hooman Askari, LinkedIn
Source: Credits to Dr. Malcolm J. McPherson and SRK Consulting
Headline: Critical minerals: A new player steps in
⭐️ Geopolitical uncertainty
“Geopolitical uncertainty has complicated the picture, sowing doubts about where critical minerals might come from.
In response, governments around the world have taken swift action to form alliances, craft policies and laws, and fund initiatives that will stabilise their supplies of critical minerals. Their moves have altered the playing field for miners, intensifying competition and risk.
⭐️ Three forms of government action
🗝️ Alliances and agreements
Government-to-government strategic
partnerships or trade agreements centred on critical minerals collaboration
🗝️ Policy and legislation
Laws, policies or regulations created to protect, secure or drive growth in critical minerals and supply chains
🗝️ Funding
Direct government funding or government-backed funds to finance ventures in critical minerals and supply chains
⭐️ Noteworthy agreements on critical minerals
⚙️ Minerals Security Partnership (MSP)
Announced June 2022
Led by the US Department of State, the MSP is intended to stimulate government and private-sector investment.
⚙️ Australia–India Critical Minerals Cooperation Agreement
Announced June 2022
Australia and India established this partnership to strengthen cooperation in the development of critical minerals assets and supply chains.
⚙️ US–Japan Critical Minerals Agreement
Announced March 2023
This trade deal on battery minerals (lithium, nickel, cobalt, graphite and manganese) is meant to help Japanese automakers and critical minerals processors access the benefits of the 2022 US Inflation Reduction Act.
⭐️ Policy and legislation
Recently, many countries have introduced legislation addressing critical minerals production, processing and manufacturing.
With approximately US$370 billion in spending and tax credits to support clean-energy industries and supply chains, the IRA significantly increases the volume of public capital available for critical minerals investments.
⭐️ US government initiatives in critical minerals
⚙️ Loans
⚙️ Production tax credit
⚙️ Mining incentives
⚙️ Electric vehicle tax credits
⚙️ Research and development grants
⭐️ Funding
Another recent trend has seen governments establish funds to invest in critical minerals projects and supply chains.
Source: Text by Craig Hutton, LinkedIn
https://www.pwc.com/gx/en/industries/energy-utilities-resources/publications/mine.html
Interviews are critical moments in our professional lives, providing opportunities to showcase our skills and experience.
To help you succeed in these crucial moments, I am sharing a comprehensive Interview Questions Guide.
Whether you're a seasoned professional or just starting your career journey, this guide offers invaluable insights into common interview questions, effective strategies to tackle them, and tips to present your best self during these crucial conversations.
Let's work together to help you land that dream job!
Source: Neha Malhotra, LinkedIn
PDF Credits : Clarkson University
Ventsim™ is an underground mine ventilation simulation software package designed to model and simulate ventilation, airflows, pressures, heat, gases, financials, radon, fire, and many other types of ventilation data from a model of tunnels and shafts.
Source: Howden Ventsim, YouTube
Hace un tiempo en esta red que he estado viendo circular esta imagen que resalta la importancia de la minería en nuestra vida cotidiana. Me he tomado el tiempo de traducirla, ya que considero que es un elemento crucial para concienciar a la sociedad acerca de la relevancia de la minería en nuestras vidas. Esta imagen muestra el uso diario de los minerales en nuestros hogares, en nuestra sociedad y en nuestro mundo, desempeñando un papel fundamental en nuestro pasado, presente y futuro, a través de la actividad minera. Es esencial educar a aquellos que no son profesionales del sector sobre el papel de la minería en nuestra vida.
Source:
Luis Miguel Romero, LinkedIn
La fuente original de la imagen en ingles se puede ver en este articulo:
https://www.caterpillar.com/en/news/caterpillarNews/customer-dealer-product/moderndaybroughttoyoubyminedproducts.html
Mining will need to expand. Scaling supply rapidly enough to meet demand growth between now and 2030 will be challenging for some metals, in particular lithium, copper, nickel, cobalt, graphite and neodymium; but actions can be taken by governments and companies which would prevent any serious constraint on the pace of the energy transition.
Source:
www.energy-transitions.org/publications/material-and-resource-energy-transition/#download-form
Watch the rebuilding of the mine access road, in this time-lapse video. Months ahead of schedule, Rio Tinto Kennecott reopened its main 'highway,' called the mine access road, within the Bingham Canyon Mine. Its width is greater than the 12 lanes of I-15, and it winds nearly three quarters of a mile within the mine joining the top to the bottom. Destroyed in the 165-million-ton April landslide, its restoration was a priority for everyone at Kennecott.
Source: Rio Tinto Kennecott, YouTube
What blasting looks like up close ?
A selection of our four favorite close-up blast videos from the last year - which one is your favorite?
Note: "Favorite" does not necessarily mean that it was a good blast and rather refers to the "visual appeal". But be careful of judging blast quality too quickly. The perspective of close-up filming distorts your perception by heaps.
Source: ERG Industrial, YouTube
"Para aumentar la productividad, se requieren trabajadores cualificados técnicamente y que sepan desenvolverse adecuadamente en sus funciones"
Estas nueve competencias transversales pueden y deberían ser incorporadas por cualquier trabajador o trabajadora del sector minero:
1) Razonamiento lógicomatemático
2) Creatividad e innovación
3) Pensamiento crítico
4) Análisis de datos
5) Juicio y toma de decisiones
6) Cambio climático
7) Economía Circular
8) Gestión Digital
9) Gestión Integrada de Operaciones
Source: www.ccm.cl/modelo-competencias-transversales/
Mine planning involves both mine design and scheduling of mining activities. The goal of mine design is to create a mine that will allow exploitation of the reserve in a safe, economic, and environmentally responsible manner..
Source: Karim El-behairy
Dr. Snehamoy Chatterjee
The handbook sets out to provide a source of reference and guidance to those involved in designing and operating quarries. In particular, it should assist them in preparing good quality mineral planning applications and quarry designs that, when implemented, will be fully compliant with environmental laws and all relevant safety and operational regulations.
Source: David Jarvis Associates.
GWP consultant earth & water resources
There are 9 types of maintenance split between Preventive Maintenance and Corrective Maintenance.
Preventive Maintenance is done before a failure occurs and consists of maintenance types like:
Time Based Maintenance, Failure Finding Maintenance, Risk Based Maintenance, Condition Based Maintenance and Predictive Maintenance.
Corrective maintenance is done after a failure has occurred either as Deferred Corrective Maintenance or as Emergency Maintenance. In the rest of this article, I will discuss each of these different types of maintenance in detail:
Preventive Maintenance (PM)
- Time Based Maintenance (TBM)
- Failure Finding Maintenance (FFM)
- Risk Based Maintenance (RBM)
- Condition Based Maintenance (CBM)
- Predictive Maintenance (PDM)
Corrective Maintenance (CM)
- Deffered Corrective Maintenance
- Emergency Maintenance (EM)
Source:
Erik Hupjé is the founder of the Road to Reliability
www.roadtoreliability.com
https://media.licdn.com/dms/document/media/D4D1FAQHZcCna9wHeBg/feedshare-document-pdf-analyzed/0/1694685436490?e=1697068800&v=beta&t=zvL4OVxrOIKUTzEQqDnVGIplGwNLR1smtvYFInEC2Tw
A well-designed dashboard is a powerful launch point for data-driven conversations. Armed with the same collection of information, your business makes faster decisions based on a single source of truth.
A great dashboard’s message and metrics are clear, its color enhances meaning, and it delivers the most relevant information to your audience. So how do you build dashboards for your organization that live up to this promise?
It really comes down to three things: thoughtful planning, informed design, and a critical eye for refining your dashboard.
Source: Tableau
www.onlinewhitepapers.com/marketing/10-best-practices-for-developing-effective-dashboards/
Christian Frantz Hansen, LinkedIn
En este capítulo se describen los conceptos básicos que se deben considerar con objeto de estudiar los fundamentos de la economía minera. En particular, se sitúa a esta disciplina como parte de la economía de los recursos naturales, donde se encuentra relacionada con la economía de minerales (aunque el objeto de estudio no es idéntico), esta última más tradicional y reconocida. Se describen las principales diferencias entre ambas disciplinas, para luego reforzar la cadena de valor del proceso minero, introducir la terminología principal de las áreas afines, así como detallar la importancia de la heterogeneidad y distribución espacial de los commodities minerales en los yacimientos y su rol en el estudio de la economía minera.
Source: https://drive.google.com/file/d/1TYcOxkDOyJkBIKqyKTiPA1NQ5JXxlQDW/view?pli=1
Understanding the distinction between variable and fixed costs is crucial for cost analysis, budgeting, pricing decisions, and overall financial planning within a business.
Source: Bojan Radojicic, LinkedIn
www.robojan.gumroad.com/l/CFmodeling
✅ La inflación es la tasa a la que aumentan los precios de los bienes y servicios en una economía. Se refiere a la disminución del poder adquisitivo de una determinada moneda.
▶ La inflación ocurre en todos los sectores, desde la vivienda y los alimentos hasta la atención médica, el transporte, etc. Pero la inflación que estamos discutiendo aquí ocurre cuando afecta los bienes y servicios en todas las industrias.
▶ Crear transparencia para el riesgo y la priorización es clave para un programa efectivo de protección contra la inflación. Los departamentos de Compras y Procura deben dar este primer paso para comprender las posibles vulnerabilidades.
⚠ Deben enfocar las acciones en las categorías que impulsan el mayor riesgo de inflación para la empresa, categorías con gasto significativo en las que:
✳ Los precios están vinculados a los índices de materias primas
✳ Los productos tienen un alto valor comercial y/o es probable que enfrenten solicitudes de aumentos de precios por parte de los proveedores en el corto plazo
✳ Los aumentos de precios no se pueden traspasar fácilmente a los clientes
✳ Una vez que se han identificado las categorías prioritarias, las organizaciones de adquisiciones pueden tomar decisiones informadas y específicas sobre qué estrategias implementar en las categorías de enfoque
✴ Las estrategias para protegerse contra la inflación se dividen en tres áreas:
✔ Gestión de Contratos
Si bien la transparencia de los contratos es clave para construir un plan sólido, el enfoque de la contratación también es un método de mitigación en sí mismo.
✔ Estrategia de abastecimiento y colaboración de proveedores
Las formulaciones y especificaciones de los productos se pueden ajustar para tener en cuenta las diferencias esperadas en los precios de los insumos.
La colaboración con los proveedores puede revelar oportunidades para reducir costos y compensar aumentos mutuamente.
✔ Coberturas financieras
La compra de contratos que fijan o limitan el precio de una materia prima, si existen mercados líquidos (futuros, forwards, opciones), también puede ser eficaz. Esta estrategia debe usarse cuando otras formas de cobertura no sean posibles dado el costo asociado
Cuál aplicar depende del contexto específico del negocio y de la relación con el proveedor. Algunos también tienen un costo y, por lo tanto, deben considerarse cuidadosamente
Source: Penélope Rojas, LinkedIn
www.visualcapitalist.com/mapped-2023-inflation-forecasts-by-country/
Advisor Channel
Lithium is often dubbed as “white gold” for electric vehicles.
The lightweight metal plays a key role in the cathodes of all types of lithium-ion batteries that power EVs. Accordingly, the recent rise in EV adoption has sent lithium production to new highs.
The above infographic charts more than 25 years of lithium production by country from 1995 to 2021, based on data from BP’s Statistical Review of World Energy.
The Largest Lithium Producers Over Time
In the 1990s, the U.S. was the largest producer of lithium, in stark contrast to the present.
In fact, the U.S. accounted for over one-third of global lithium production in 1995. From then onwards until 2010, Chile took over as the biggest producer with a production boom in the Salar de Atacama, one of the world’s richest lithium brine deposits.
Global lithium production surpassed 100,000 tonnes for the first time in 2021, quadrupling from 2010. What’s more, roughly 90% of it came from just three countries.
Rank Country 2021 Production (tonnes) % of Total
#1 Australia 🇦🇺 55,416 52%
#2 Chile 🇨🇱 26,000 25%
#3 China 🇨🇳 14,000 13%
#4 Argentina 🇦🇷 5,967 6%
#5 Brazil 🇧🇷 1,500 1%
#6 Zimbabwe 🇿🇼 1,200 1%
#7 Portugal 🇵🇹 900 1%
#8 United States 🇺🇸 900 1%
Rest of World 🌍 102 0.1%
Total 105,984 100%
Australia alone produces 52% of the world’s lithium. Unlike Chile, where lithium is extracted from brines, Australian lithium comes from hard-rock mines for the mineral spodumene.
China, the third-largest producer, has a strong foothold in the lithium supply chain. Alongside developing domestic mines, Chinese companies have acquired around $5.6 billion worth of lithium assets in countries like Chile, Canada, and Australia over the last decade. It also hosts 60% of the world’s lithium refining capacity for batteries.
Batteries have been one of the primary drivers of the exponential increase in lithium production. But how much lithium do batteries use, and how much goes into other uses?
Source. https://elements.visualcapitalist.com/25-years-of-lithium-production-by-country/
Today we had on the show Jonathan Fisher, CEO of Cauldron Energy, to chat through what the stance on uranium mining and nuclear power generation currently looks like in Australia.
Jonathan shared his thoughts on various commonly cited critiques of why nuclear isn’t viable as a fossil fuel free energy source, as well as what would have to change for mining to commence and the flow on effects of that.
Source : Money of Mine, YouTube
Financial Abbreviations at glance. Why you need this:
⛏ 𝗘𝗳𝗳𝗶𝗰𝗶𝗲𝗻𝗰𝘆 - Speed up conversations and reading.
⛏ 𝗣𝗿𝗼𝗳𝗲𝘀𝘀𝗶𝗼𝗻𝗮𝗹𝗶𝘁𝘆 - Showcase industry expertise.
⛏ 𝗖𝗹𝗮𝗿𝗶𝘁𝘆 - Avoid misinterpretations.
⛏ 𝗡𝗲𝘁𝘄𝗼𝗿𝗸𝗶𝗻𝗴 - Engage with peers effortlessly.
⛏ 𝗖𝗼𝗻𝗳𝗶𝗱𝗲𝗻𝗰𝗲 - Navigate financial documents with ease.
⛏ 𝗦𝘁𝗮𝘆 𝗨𝗽𝗱𝗮𝘁𝗲𝗱 - Keep pace with evolving financial lingo.
📈 Knowing your financial abbreviations isn't just about jargon – it's about effective and informed communication in the finance world!
Source: Bojan Radojicic, LinkedIn
This model was recorded at a historic canal tunnel in Botetourt County, Virginia. Abandoned in 1856, the tunnel is a unique example of 19th-century engineering, transportation technology, and landscape of labor. Cut and blasted by hand from the surrounding rock, the tunnel was meant to convey large canal boats and their cargoes through the challenging mountainous terrain. If completed, the canal would have provided a connection from the Mid-Atlantic to the Mississippi Basin and ultimately to the Gulf of Mexico. No other similar archaeological site is as complete as the works at the Marshall Tunnel. The site is located on private land and is not publicly accessible. Recordation was completed by DATA Inc. and the Florida Public Archaeology Network (FPAN) with funding from the Virginia Department of Historic Resources and support from the landowners.
Source: FPANNortheast, YouTube
Thanks to Aurélien Vautier for sharing with us this interesting cheatshee.
As Aurélien said:
It took me 3 years to figure it out.
I wasted time, energy and It was a lot of frustration.
Terminology chaos is a disaster for your business.
Is it a measure, a metric or a KPI ?
The choice and weight of the words and acronyms we use every day must be incredibly precise.
We can't afford to use vague terminology when talking about development projects or dashboard migrations.
To be honest, until very recently, I used to mix up certain terms, which sometimes made communication comical or even frustrating.
This cheatsheet contains clarification about the following terms :
A : Data Story Framing and Data Story Telling.
B : Measure, Metric and KPI.
C : Bar Chart, Histogram.
D : Reporting, Analysis report, Dashboard.
E : Chart, Graph, Plot, Diagram.
F : UX Design, UI Design.
G : Design Process, Design System.
H : Aggregation, Granularity.
Which one is clearer to you now ? I've struggled a lot with B, E and F.
If you've learned something, share, like or tag someone who needs to see it. Each illustration can take up to 15 hours to complete. I really appreciate your support.
Thank you very much for the inspiration Brent Dykes (A) and The Interaction Design Foundation (F).
Some of them are an interpretation of my own experience.
For the high resolution image, please follow and DM me, I'll be happy to share it with you.
Source: Aurélien Vautier, LinkedIn
Over 50% of Maintenance managers have rated their team as highly effective and just over 47% rated their strategy as highly effective. A strong maintenance team is led by a strong Maintenance Manager, which can be a very rewarding job, but it can also come with huge challenges and pressures around effective management of costs, time, safety, efficiencies, and much more.
While big picture strategy planning is essential to operations, it is also important to adopt practices into your daily habits to ensure your team feel motivated and supported, allowing them to perform as best they can. Here are some tips;
- Ensure your morning meets and planning meetings are as efficient as possible
- Understand your unplanned breakdowns and set plans in motion to review the maintenance and failure history with your team with a view on how to improve the maintenance routines and reduce future failures
- Be supportive to everyone in the team, be aware of their individual workloads and make each person feel they are important and that their input is appreciated
Source: Addenergy
https://maincontract.nl/wp-content/uploads/2022/12/The-2022-Maintenance-Management-report.pdf
Sweden is becoming one of the EU’s key suppliers of natural resources. And without copper, there’s no high tech, no battery or environmental technology. We joined the driver of a giant truck in one of Europe’s biggest copper mines, the Aitik copper mine.
Owner: Boliden
Established: 1968
Operating profit: SEK 3,076 m (2022)
Average number of employees: 932 (2022)
Type of mine: open pit
Mine depth: 450 metres
Production average grade: Cu 0.17%, Au 0.07 g/tonne (2023)
Reserves covering full production until 2047 (2050) ‒ Cu reserve grade 0.23 (0.22) %
Mineral resources end of 2022: 1 147 (917) Mtonnes
Dam investment 2022-2024
Sources:
Lucas Pereira da Silva, LinkedIn
DW News, YouTube
www.boliden.com/investor-relations/reports-and-presentations/general-presentation
Thanks to Gilles FABRE for sharing with us this interesting material.
This TECHNOTE describes the fundamental steps of variography, respectively:
▶ Calculation of the experimental variogram
▶ Construction & characteristics of the variogram model
▶ Construction of variogram map & directional variograms
Source: Gilles FABRE, LinkedIn
Preventive maintenance has been more popular in principle than in practice over the years. One scarcely can
argue with the idea of keeping equipment well maintained to extend its expected life and avoid future repair
costs. Less clear is an understanding of the actual relationship between the cost of preventive maintenance and the returns such activities can be expected to deliver. This article describes a process of assessing the value of preventive maintenance programs and activities by analyzing them in terms of key financial ratios.
Engineers and building operators trying to persuade property owners and managers to invest in preventive
maintenance (PM) for their portfolios offer a range of solid arguments:
“The equipment will perform better.”
“Equipment life will be extended.”
“Repair costs will fall.”
“Downtime will be reduced.”
“Tenant satisfaction will increase.”
“The manufacturer says we need to do it.”
Although most owners acknowledge these issues, they may be more concerned with saving money and obtaining optimum value from their investments. Given that perspective, a more convincing argument for preventive maintenance would demonstrate that PM generates a solid rate of return in terms of risk mitigation and asset protection. Anecdotal evidence does suggest that preventive maintenance is valuable. Until now, however, no one has placed a firm value on the relationship between costs and returns. For one thing, the economic value of preventive maintenance is difficult to determine. No specific statistical methods exist. No empirical studies have been performed. How does one quantify the extended life of a chiller? How can one know how much longer a compressor will last if it receives proper preventive maintenance than it would if no PM took place?
Source:
Jones Lang LaSalle
Wei Lin Koo, Tracy Van Hoy, P.E.
https://media.licdn.com/dms/document/media/D4D1FAQHW1vplqy5n6A/feedshare-document-pdf-analyzed/0/1693660134739?e=1697068800&v=beta&t=4TOJ9CwPEhFZzeonU-LIFWUUFWXfkblHi4hyhtaEnOs
Getting Started with Excel Charts
The terms chart and graph are often used interchangeably but do have one significant difference
A chart is a graphic representation of data.
A graph is a diagram of a mathematical function, but can also be used (loosely) about a diagram of statistical data.
Course objectives:
• Distinguish between Charts and Graphs
• Creating a basic chart and template
• Format and configure chart output
• Represent Time, Frequency and Proportions
• Combining Charts
Source: UQ Library
Dr.Vaishali Dixit. LinkedIn
The most important KPIs for your career or business all in one place!
1️⃣ Cash KPIs
2️⃣ Growth KPIs
3️⃣ Investors KPIs
4️⃣ Inventory KPIs
5️⃣ Accounting KPIs
Credits : Financial Modeling World Cup Team
Asif Masani, LinkedIn
La minería subterránea por lo general tiene un menor impacto ambiental, pero también implica mayores costos. Por eso, hoy quiero compartir con ustedes una valiosa herramienta: la plantilla de barrenación de avance para mina subterránea. 👇
Esta plantilla permite realizar análisis rápidos de costos de explosivos, determinar el material volado y planificar los materiales necesarios. Puedes llevar a cabo simulaciones de diferentes escenarios y elegir aquel que te beneficie más, yra sea mediante la reducción de la cantidad de barrenos, el ancho u otras variables relevantes.
Pronto, compartiré información sobre cómo diseñar una cuña.
Source: RUBEN ROBLES R., LinkedIm
El pasado 7 de julio de 2023 en la ciudad de Lima-Perú, tuve el honor de ser ponente en el "XII CONGRESO LATINOAMERICANO DE TUNELES Y OBRAS SUBTERRANEAS - TUNNEL & MINING 2023", organizado por la prestigiosa empresa "ELITE CONSULTING", donde se presento mi libro titulado: "DISEÑO DE SOSTENIMIENTO EN MINAS SUBETRRANEAS".
Les alcanzo algunas de las diapositivas que se expusieron como una muestra del libro.
Si te interesa adquirirlo, puedes contactarme al WhatsApp: +51 986371646
Source: Amilcar Carpio Chavez, LinkenIn
The Energy Act of 2020 defines a “critical material” as:
- Any non-fuel mineral, element, substance, or material that the Secretary of Energy determines: (i) has a high
risk of supply chain disruption; and (ii) serves an essential function in one or more energy technologies, including technologies that produce, transmit, store, and conserve energy; or
- A critical mineral, as defined by the Secretary of the Interior.
The Energy Act of 2020 defines a “critical mineral” as:
- Any mineral, element, substance, or material designated as critical by the Secretary of the Interior, acting through the Director of the U.S. Geological Survey.
2023 Final Critical Materials List
DOE has determined the final Critical Materials List to include the following:
- Critical materials for energy: aluminum, cobalt, copper, dysprosium, electrical steel, fluorine, gallium, iridium, lithium, magnesium, natural graphite, neodymium, nickel, platinum, praseodymium, silicon, silicon carbide and terbium.
- Critical minerals: The Secretary of the Interior, acting through the Director of the U.S. Geological Survey (USGS), published a 2022 final list of critical minerals that includes the following 50 minerals: “Aluminum, antimony, arsenic, barite, beryllium, bismuth, cerium, cesium, chromium, cobalt, dysprosium, erbium, europium, fluorspar, gadolinium, gallium, germanium, graphite, hafnium, holmium, indium, iridium, lanthanum, lithium, lutetium, magnesium, manganese, neodymium, nickel, niobium, palladium, platinum, praseodymium, rhodium, rubidium, ruthenium, samarium, scandium, tantalum, tellurium, terbium, thulium, tin, titanium, tungsten, vanadium, ytterbium, yttrium, zinc, and zirconium.”
This list is based on the assessment described in DOE’s most recent critical materials assessment, the 2023 DOE Critical Materials Assessment. The results of the assessment are shown in the criticality matrices below.
Source: https://www.energy.gov/cmm/what-are-critical-materials-and-critical-minerals
They are highly confused, often misunderstood and mostly underutilized.
Here’s what they are and how to use them:
1️⃣ Operating cash flow
⚫ Represents the net cash generated by your company's core operations
⚫ Calculated by adjusting Net Income for non-cash items & changes in net working capital assets.
⚫ Used to assess:
>> financial health
>> ability to meet its financial obligations
>> ability to generate sufficient cash to fund ongoing business operations
>> cash generation trends
2️⃣ Investing cash flow
⚫ Represents the net cash generated by your company's investments in long-term assets such as property, plant and equipment (PPE).
⚫ Calculated by totaling the net investments in PPE over the period (purchases less sales of PPE)
⚫ Used to assess:
>> investment decisions
>> ability to generate returns from its investments
3️⃣ Financing cash flow
⚫ Represents the cash generated by your company's net debt and/or equity activity.
⚫ Calculated by totaling net debt and equity proceeds over the period.
⚫ Used to assess:
>> financing choices and risk profile
>> ability to raise capital
4️⃣ Free Cash Flow to Firm (FCFF or Unlevered Cash Flow)
⚫ Represents the cash remaining in your business after accounting for cash outflows that support product sales and operations (product costs + operating expenses + working capital) and cash outflows that maintain the capital asset base (capital expenditures).
⚫ Calculated by adjusting Operating Cash Flow for after tax interest expense and investments in capital assets
⚫ Used to assess:
>> financial strength and ability to generate sufficient cash for growth and reinvestment
>> value based on the discounted cash flow (DCF) valuation.
5️⃣ Free Cash Flow to Equity (FCFE or Levered Cash Flow)
⚫ Represents the cash remaining in your business after accounting for all business expenses, investments in working capital assets, investments in fixed assets, and also all debt obligations.
⚫ Calculated by adjusting Operating Cash Flow for after tax, interest expense, investments in capital assets and net debt payments.
⚫ Used to assess:
>> ability to generate cash for distributions to shareholders holders
Source: Oana Labes, MBA, CPA - LinkedIn
Table of Contents
1. SUM of Digits when cell Contains all Numbers
2. SUM of Digits when cell Contains Numbers and non Numbers both
3. A List is Unique or Not (Whether it has duplicates)
4. Count No. of Unique Values
5. Count No. of Unique Values Conditionally
6. Generate Sequential Weekday names like Sun, Mon, Tue, .....,Sat
7. Generate Sequential Month names like Jan, Feb, Mar....Dec
8. Find Last Day of the Month
9. Number of Days in a Month
10. Find First Day of the Month
11. Add Month to or Subtract Month from a Given Date
12. Add Year to or Subtract Year from a Given Date
13. Convert a Number to a Month Name
14. Convert a Month Name to Number
15. Convert a Number to Weekday Name
16. Convert a Weekday Name to Number
17. Financial Year Formula (e.g. 2015-16 or FY16)
18. Converting Date to a Calendar Quarter
19. Converting Date to a Indian Financial Year Quarter
Source: Vijay A. Verma
Kasra Jadid Haghighi, LinkedIn
The haul road is either the mine’s greatest asset or greatest liability
• Investment in the haul road is money well spent
• Major influence on both cost and production
Source: https://www.numeralkod.com/cross/tires.pdf
Did you know that 96% of the Problems are not seen by Senior Management???
Marcus Koehnlein reported „The concept was developed by Sidney Yoshida in 1989. He uncovered a poor distribution of power and information within the hierarchy. He found that company leadership was hardly aware of any of the real problems the organization faced. They were, as he put it, only aware of the tip of the iceberg.
If Yoshida's numbers are still accurate today can be discussed, a lot changed since 1989, relevant is not the exact number but the model offers a powerful and painful insight into the miserable state of the modern workplace.
So what can be done? Frequently engaging with the front line seems to be a still underused key to success.“
How do you melt the Iceberg of Ignorance?
Credits Markus Koehnlein via Alvin Foo
Lo que no se mide, no se puede administrar. Y precisamente para eso es que tenemos indicadores que nos permiten diseñar una buena estrategia de mantenimiento.
Los indicadores son muy importantes para los gestores de mantenimiento porque les permiten analizar la rutina de trabajo, equipo de mantenimiento, procesos y equipos.
Es posible medir y analizar cualquier actividad que genere números o valores en mantenimiento. La cuestión es descubrir cuáles son los indicadores de desempeño más importantes para no perder tiempo con los que son poco relevantes.
A continuación, te compartimos una lista de los principales indicadores de mantenimiento.
Fuente: Predic, LinkeIn
Un líder es inspirador
Un jefe necesita la Cohersión
Un líder es mentor
Un jefe es mandón
Un líder ayuda a su equipo
Un jefe no tiene equipo sólo tiene personas que trabajan con él.
Source: Lyz Escalante Fernandez, Linkedin
1. Electric and hybrid power:
As the demand for more sustainable mining practices grows, there is an increasing focus on electric and hybrid-powered mining trucks. These trucks could reduce emissions and operating costs while providing similar or greater power and performance.
2 Advanced materials
3 Machine to machine integration
4 Real-time data analytics
5 Artificial intelligence
6 Autonomous driving
Source: Kash Sirinanda, PhD - LinkedIn
C'est la course mondiale sur les minerais alors que l'appétit de l'industrie et de la Tech pour le lithium, le cobalt, manganèse et nickel ne se dément pas. Pour « La Story », le podcast d'actualité des « Echos », Pierrick Fay et ses invités dévoilent la bataille internationale pour les ressources minières du continent africain.
Source: Podcast La story, LesEchos
https://www.lesechos.fr/finance-marches/marches-financiers/en-afrique-la-ruee-sans-fin-vers-les-matieres-premieres-1878744#utm_source=le%3Alec0f&utm_medium=click&utm_campaign=share-links_linkedin
In this video, I'll address Elon's comment that lithium refining will be the bottleneck for lithium lithium supply, as well as look at margins and the benefits of vertically integrating into lithium refining.
Timeline
0:00 Introduction
01:16 Thanks, Credits, and Sources
04:37 Why is Lithium the Bottleneck?
06:10 Mining is Easy, Refining is Hard? A Red Herring
07:14 Lithium Refining // Margins
15:39 Fixed Price Contracts are being Phased Out
17:50 Lithium Refining // Forecast and Lead Times
20:39 Why is Tesla Pushing for More Refining?
24:49 Tesla Needs to Flirt Better with Entrepeneurs
25:26 Refining Integration could Save Tesla Billions
27:12 Lithium Refining // Summary
Intro Music by Dyalla: Homer Said
Source: The Limiting Factor, YouTube chanel
The underground metalliferous mining industry continues to change under the infl uence of many factors including, to name a few, new mining techniques and equipment, new approaches to risk management, more stringent safety and health standards, new employment practices and orebodies become deeper and often lower grade. In addition, the same technological revolution and plummeting cost of technology that has brought the GPS, smart phones and digital cameras to the general population is also working its way through the mining industry impacting on communications, automation and process control as well as introducing major effi ciency and productivity dividends. However, not all factors are positive including, in particular, the issues of carbon costs and electrical power. This paper explores some of the trends affecting ventilation in hard rock mines, some of the existing and likely future challenges and some of the potential future solutions to these issues.
Source: D.J. Brake
INDUSTRIALIZATION imposed an ever increasing demand for moving liquids from one location to another far more practically than by gravity. In order to motivate the liquid to move through the pipes and channels, energy has to be imparted to the liquid.
The energy, usually mechanical, provided by a prime mover is transferred to the liquid by a device called a pump.
The English Gravitational System of Units is used throughout the guide as this system is familiar to technical personnel. It has also gained wide acceptance in the hydraulic machinery field both by the manufacturers and by their customers. Tables are provided in the Appendix for any necessary conversions.
Source: Innovative Engineers Network
El feedback, o retroalimentación en español, es esencial en muchos aspectos de la vida, incluyendo en el ámbito laboral, educativo y personal. Algunas de las razones por las que el feedback es importante son las siguientes:
Mejora el rendimiento: Cuando recibimos feedback sobre nuestro trabajo o acciones, podemos aprender de nuestros errores y mejorar nuestro rendimiento en el futuro.
📌Fomenta el crecimiento y el desarrollo personal: El feedback constructivo puede ayudarnos a identificar áreas en las que podemos mejorar y a desarrollar nuevas habilidades y competencias.
📌Fortalece las relaciones interpersonales: Al recibir feedback de los demás y compartir nuestras propias opiniones y observaciones, podemos establecer relaciones más sólidas y de confianza.
📌Promueve la comunicación abierta y efectiva: El feedback es una herramienta importante para la comunicación efectiva y abierta entre las personas. Al proporcionar retroalimentación constructiva, podemos mejorar la calidad de nuestras interacciones y relaciones.
📌Fomenta la motivación y el compromiso: El feedback positivo puede ser muy motivador y ayudarnos a mantenernos comprometidos y enfocados en nuestros objetivos y metas.
En resumen, el feedback es importante porque nos ayuda a crecer y desarrollarnos, a fortalecer nuestras relaciones interpersonales, a mejorar nuestra comunicación y a mantenernos motivados y comprometidos en nuestras tareas y metas.
Source: EXPERTOS en Competencias y Conductas
In the first versions of the block model estimation software packages, the orientations of the search ellipses were held constant for each estimation domain. This approach worked reasonably well where the strike and dip of the mineralization were relatively constant within each estimation domain. The approach did not work well however where the strike and dip of the mineralization rapidly changed – a common occurrence in mineral deposits.
Subsequent additions to the computer code has enabled the ability to change the orientations of the search ellipses for each estimated block in the model rather than by a grouping of blocks within an estimation domain. This approach is commonly referred to as Dynamic Anisotropy.
While this new functionality permits a better estimation of the grades according to the local strike and dip of the mineralization, experience has shown that care must be taken when setting up to carry out a dynamic anisotropy estimate.
My colleague Jack Lunnon and I have been fortunate to have our paper accepted and published recently in the CIM Journal. In this paper we share some of our experiences and the lessons learned when preparing grade estimates using the dynamic anisotropy approach. We also identify some of the more common pitfalls we see are encountered when using this method.
The paper will be of interest to Mineral Resource practitioners and is available to CIM members at no charge at the link below.
https://lnkd.in/gS9iwCwA
Source : Reno Pressacco, LinkedIn
Es muy probable que cuando lees o escuchas acerca de KPIs, te resulte en un tema ampliamente conocido y pienses que lo tienes todo bajo control, sin embargo, esta familiaridad te puede llevar a cometer alguno de los 𝟱 errores más grandes que he visto que las empresas cometen una y otra vez a la hora de implementar sus KPIs:
1. Medir todo lo que se "mueva y camine"
Si un KPI no está alineado o apuntando a un objetivo clave o estratégico de negocio, entonces 𝗻𝗼 𝗲𝘀 𝘂𝗻 𝗞𝗣𝗜, hay que entender que 𝗻𝗼 todo lo que sea susceptible y fácil de medir, deba medirse. No por tener más métricas significa que vas a cumplir tus metas y objetivos claves.
2. Utilizar métricas de vanidad como KPIs
Las métricas de vanidad sirven mucho para llamar la atención, para impresionar a los demás, pero 𝗻𝗼 te ayudan 𝗮 𝗽𝗮𝗴𝗮𝗿 𝗹𝗮𝘀 𝗰𝘂𝗲𝗻𝘁𝗮𝘀 y generar beneficios🤑.
Una métrica de vanidad no es mala, lo malo es no validar su impacto o contribución al cumplimiento de los objetivos claves de negocio, por ejemplo, # visitas a la página web es una métrica de vanidad, si la analizas de forma aislada, pero cuando la cruzas con los leads o ventas generadas, entonces ahora sí tienes un KPI de tasa de conversión.
3. Utilizar los KPIs como metas
Los KPIs no son metas, los KPIs son un medio para verificar si estás alcanzando tus metas y objetivos claves de negocio, por eso cuando conviertes los KPIs en metas dejan de funcionar correctamente y lo que pasa es que se aumenta nuestra creatividad para manipular los indicadores, como en la imagen👇 y buscamos la forma que jueguen a nuestro favor, más aún cuando se tienen incentivos y bonificaciones económicas amarradas a esos KPIs.
4. Muchos KPIs de resultado o lagging y muy pocos KPIs drivers o leading
Está claro que debes tener unos KPIs de resultado para medir el éxito del negocio, pero lo que pasa con estos es que una vez que se obtienen no hay forma de arreglarlos: son historia. Por el contrario, los KPIs drivers son influenciables y accionables para corregir a tiempo las desviaciones hacia el cumpimiento de la meta.
5. No analizar y monitorear los KPIs
Los KPIs existen para analizar y extraer insights e información clave para tomar acciones y decisiones y estos deben hacer parte de la dinámica diaria y el lenguaje del negocio.
Source: Oscar Luis Martínez Martínez, Linkedin
Source image: Oscar Luis Martínez Martínez
PART 1: Let's Decode the Confusing Terms in Procurement Together!
This confusion can lead to costly mistakes and missed opportunities.
But don't worry; we are here to help! Together, we can decode the confusing terms and demystify the world of procurement. Whether you're a seasoned pro or starting out, let's navigate the procurement landscape together and make sense of it all.
Source : Procurement League, LinkedIn
Tunnelling in rock depends on the ease or difficulty of rock removal when using different tunnel excavation methods.
Excavability depends on the following rock properties:
— Uniaxial compressive strength.
— Hardness and abrasiveness.
— Rock mass fracturing.
— Geomechanical quality indexes.
Uniaxial compressive strength and the spacing of discontinuities can be used to differentiate excavation by blasting from excavation by mechanical methods (Figure📸). An estimation of excavability for roadheaders, based on the uniaxial compressive strength, σci, and tensile strength, σt of rock, is as follows:
— Easy to cut: σt/σci 0.1
Source : Nabaz Nooralddin, LinkedIn
Source image: Nabaz Nooralddin, LinkedIn
The S&P/ASX 300 Metals & Mining (XMM) index contains companies in the S&P/ASX 300 that are classified as members of the Metals & Mining Industry. Constituents include producers of gold, steel and precious metals. No Exchange Traded Fund tracks the index.
To be eligible for inclusion in the ASX 200 Index: Market capitalization: A stock's weight in the index is determined by the float-adjusted market capitalization of the stock. This is a function of current index shares, the latest available stock price and the Investable weight factor (IWF).
Los principales costos en la gran minería se dividen en dos categorías: los costos de operación (OPEX) y los costos de inversión (CAPEX).
1. Costos de operación (OPEX): Estos son los costos relacionados con el día a día de la operación minera, como los costos de mano de obra, energía, combustible, reparaciones y mantenimiento, suministros, transporte, entre otros.
2. Costos de inversión (CAPEX): Estos son los costos relacionados con la inversión en el proyecto minero, como los costos de exploración, diseño, ingeniería, construcción, equipos y maquinaria, infraestructura, entre otros.
En general, los costos de inversión (CAPEX) son más altos al comienzo del proyecto, mientras que los costos de operación (OPEX) se mantienen más constantes a lo largo del tiempo. Aunque estos costos pueden variar dependiendo de la mina y de las condiciones locales, es importante tenerlos en cuenta al planificar y evaluar la viabilidad económica de un proyecto minero.
Los principales costos para operar una compañía minera incluyen:
a. Costos de extracción y procesamiento: Estos incluyen los costos de remover la roca y minerales del suelo, así como los costos de procesar el mineral para obtener el producto final deseado.
b. Costos de mano de obra: Incluyen los salarios y beneficios de los empleados, incluyendo los costos relacionados con la seguridad y la capacitación.
c. Costos de energía y combustibles: Incluyen los costos de energía para operar las máquinas y equipos, así como los costos de combustible para el transporte.
d. Costos de mantenimiento y reparación: Incluyen los costos de mantener y reparar las máquinas y equipos, así como los costos de construir y mantener las instalaciones.
e. Costos de transporte: Incluyen los costos de transportar el mineral y el producto final desde la mina hasta los clientes o instalaciones de procesamiento.
f. Costos de cumplimiento normativo: Incluyen los costos de cumplir con las regulaciones ambientales y de seguridad laboral, así como los costos relacionados con las licencias y permisos necesarios para operar.
g. Costos de investigación y desarrollo: Incluyen los costos relacionados con la exploración y el desarrollo de nuevos yacimientos y proyectos mineros.
Teniendo en cuenta estos costos y tomando decisiones adecuadas a lo largo del tiempo, las empresas mineras pueden asegurar su operación y rentabilidad a largo plazo.
Source: Jose Pizarro C, LinkedIn
Source Image : gettyimages
“When mining companies engaged in discussions at the fifteenth Conference of the Parties to the United Nations Biodiversity Conference, COP15, in December last year, they shared solutions that will contribute towards a world in which nature is more healthy, abundant and resilient — it is clear that our industry has a unique role to play in supporting a nature-positive agenda.” Hayley Zipp, Director of Environment, ICMM
Nature and biodiversity loss is occurring at an alarming pace. Species extinction rates are 100 – 1,000 times the historical norm, with a huge acceleration in the last 150 years. This degradation puts over half of the world’s annual GDP at risk.
Mining disturbs less than 0.1% of the world’s land but often in ecologically and culturally sensitive areas. Recognising this, ICMM members have committed to understand their impact and take steps to mitigate this, while focusing on opportunities for conservation and restoration.
However, we know we need to go even further in contributing to halting and reversing nature’s decline globally, and regional collaboration across different stakeholder groups is key to making this happen. This requires a holistic understanding and careful management of shared resources – from the mine site into adjacent landscapes and value chains. It means working with communities, government and civil society to halt and reverse the loss of nature and support both conservation and fair and equitable benefit sharing of natural resources.
Source article and image: https://www.icmm.com/website/publications/pdfs/environmental-stewardship/2023/factsheet_nature-gbf.pdf
MINING.COM’s ranking of world’s biggest miners welcomes the first Indonesian company to the top tier and Perth as the city hosting the greatest number on the list at the end of the second quarter 2023
At the end of the first quarter of 2022 metals and minerals were setting all-time records led by bellwether copper which briefly traded above $5 a pound or more than $11,000 per tonne. Iron ore, the second most traded bulk commodity after crude oil and the cash cow for the top tier of the mining world, was above $150 a tonne.
Both commodities are down by more than 20% since then – officially a bear market.
At the end of Q1 2022, the MINING.COM TOP 50* ranking of the world’s biggest miners hit an all time record of a collective $1.75 trillion.
Half way through 2023 and mining valuations have slumped a total of $356 billion after giving up a collective $47 billion during the second quarter.
The Top 50 now has a combined market value of $1.38 trillion – back to levels seen end-June 2021.
Indonesian debut
The first Indonesian company to make it into the top 50 is Amman Minerals Internasional, owner and operator of the Batu Hijau copper and gold mine and developer of the adjacent Elang project.
Elang is one of the world’s largest undeveloped copper and gold porphyry deposits and is currently in the feasibility stage.
Indonesia has become a red-hot IPO market this year and Amman was the largest of the year so far.
The company debuted in Jakarta on July 7, raising more than $700m, and enters the ranking at no 46 with a valuation just shy of $9 billion or 135 trillion rupiah, up smartly since the IPO.
Harita Nickel, which listed in Jakarta in April raising $672m, has had a tough go of it and the stock has shed more than 30% since then as nickel prices decline at a similar rate.
In USD terms Harita Nickel is worth less than $4 billion which places the stock outside the 70 most valuable mining stocks globally.
Lithium ranks grow
Lithium producer Pilbara Minerals makes a spectacular entry into the Top 50 at position no 42 after spending several quarters bubbling under the ranking.
Pilbara Minerals shares are up over 40% so far this year, lifting its value to over $10 billion, surpassing that of fellow lithium miner and Perth neighbour, Mineral Resources.
Pilbara Minerals, which is the ranking’s best performer for the quarter, brings the number of companies based in the Wes...
Source : https://www.mining.com/top-50-biggest-mining-companies/
It's hard being a CEO.
Every decision impacts financial health, employee morale, and stakeholder satisfaction.
To succeed, you’ll need a good CFO.
And you’ll need to Master Strategic Management.
Here are 15 key areas that a CEO should focus on, to help you track your learning, your progress or your performance:
1. Vision and Strategy Development: map the future, ensure alignment with strategic vision, and develop long-term strategies to achieve goals
2,. Leadership and Organizational Culture: create a positive and productive organizational culture
3. Financial Management: oversee the company's financial health
4. Corporate Governance: ensure adherence to the highest standards of governance
5. Risk Management: identify potential risks to the company and ensure it has systems in place to mitigate them
6. Operational Efficiency: streamline operations, improve productivity, and promote innovation
7. Talent Management: ensure the right people are in the right roles to effectively drive the strategic plan
8. Customer Focus: foster a customer-centric approach across all department, to understand and meet customer needs
9. Investor Relations: maintain strong relationships with investors, shareholders, and financial analysts
10. Brand Reputation and Image: act as the face of the company, and ensure their actions reflect positively on the brand
11. Innovation and Technology: foster a culture of innovation to gain and retain competitive advantages
12. Sustainability and Corporate Social Responsibility: balance the drive for profit with the need for ethical and sustainable operations
13. Stakeholder Management: manage relationships with various stakeholders
14. Mergers and Acquisitions: evaluate opportunities for growth via mergers, acquisitions, partnerships, or joint ventures, and oversee their successful execution.
15. Business Continuity and Succession Planning: develop and implement a comprehensive business continuity plan
Source article & image: Oana Labes, MBA, CPA ; LinkedIn
The idea of developing a haul road manual or collection of guidelines was initiated by the late
Professor Muirhead at the University of Alberta in 1999. Support and financial contributions for this work were obtained from NSERC, SMART (Surface Mining Association for Research and Technology) ATCO Power, and Finning. Both Syncrude Canada Ltd. and Suncor Ltd. provided access to road design data and methodologies. Syncrude Canada Ltd.’s internal reports were instrumental in verifying the strain-based design approach for haul roads advocated in this manual..
The unrivalled success of Australia’s mining industry has long relied on technology and innovation to improve safety, drive greater productivity and deliver better sustainable development.
The mining industry has also become an increasingly critical driver of broader industry development and innovation.
However, this innovation imperative can deliver more with a cooperative focus and a policy framework that encourages creativity and application. This publication, The Digital Mine, addresses that goal.
Australia’s minerals industry is essential for modern life and will contribute the raw materials needed for the global transition to a net zero economy. Building solar photovoltaic plants, wind farms and electric vehicles is more minerals-intensive than their hydrocarbon equivalents. Traditional commodities continue the quest to reduce emissions in extraction and use…
Foreword by Tania Constable
Chief Executive Officer
Minerals Council of Australia
The technologies:
Artificial Intelligence
Augmented and virtual reality
Big data analysis
Blockchain technology
Digital twins
Hydrogen energy
Integrated automation
Integrated operations centres
Internet of Things
Kinetic braking
Liquefied natural gas
Mine site electrification
Solar photovoltaics
Wearable technology
Here are 9 financial “rules of thumb” that Warren Buffett uses to tell if a company has one:
1: Gross Margin
Formula: Gross Profit / Revenue
Moat: Consistently above 40%
No Moat: Under 40% & volatile
2: Sales, General, and Administrative Expenses
Formula: SG&A / Gross Profit
Moat: Consistently under 30%
No Moat: Over 80% & volatile
3: Depreciation Expense
Formula: Depreciation / Gross Profit
Moat: Consistently under 10%
No Moat: Volatility & high
4: Interest Expense
Formula: Interest Expense / Operating Income
Moat: Consistently under 15%
No Moat: Over 50% & volatile
5: Income Tax Expense
Formula: Income Tax Paid / Pre-tax Income (Earnings Before Tax)
Moat: Consistently pays the full amount (~21% in U.S.)
No Moat: Negative, erratic
6: Profit Margin (Net Margin)
Formula: Net Income / Revenue
Moat: Consistently above 20%
No Moat: Below 10%, negative, and volatile
7: Capital Expenditures
Formula: Capital Expenditures / Net Income
Moat: Consistently under 25%
No Moat: Consistently above 75%
8: Total Liabilities to Adjusted Shareholder Equity
Formula: Total Liabilities / Shareholder Equity
Moat: Below 0.80
No Moat: Over 2.00
9: Return on Shareholders’ Equity
Formula: Net Income / Shareholder Equity
Moat: Consistently above 15%
No Moat: Below 10%, negative, or volatile
3 Important notes:
a) These “rules of thumb” are only useful when a company is fully optimized for profits (phases 4 & 5).
B) CONSISTENCY is key
The real test is if a company generates good numbers over multiple years & various economic cycles
C) There are PLENTY of exceptions & nuances to these rules
Many of Buffett’s largest holdings do not pass every rule of thumb.
That’s because investing & accounting have TONS of nuances.
Source: Brian Feroldi, LinkedIn
Todavía veo en mis Consultorías y Entrenamientos Personalizados, mucha confusión y muchas maneras de calcular estos dos importantes KPIs en nuestras organizaciones.
Existen muchas definiciones de Rotación y Retención del Personal.
Te comparto las que se identifican con mi manera de pensar y actuar:
💪¿Qué es la Rotación del Personal?
"la relación entre el número de miembros de la organización que se han ido durante el período que se considera, dividido por el número promedio de personas en esa organización durante el período" (Price, 1977) y a menudo es perjudicial para el funcionamiento eficaz de una organización.
Coincide con lo expresado en la nueva Norma ISO 30414/2018 sobre Reportes y Métricas en RRHH: (la norma internacional que trata de poner de acuerdo a todos a la hora de medir y hacer reportes en RRHH)
“Esta métrica expresa el número de personas que abandonan la organización debido al despido, el desgaste y otras razones en comparación con el número total de personas en la organización. Incluye toda la Rotación, independientemente de la razón”.
💪¿Cómo se calcula?
Tasa de Rotación: (Número total de abandonos en un período de tiempo/Promedio de Empleados en el mismo período de tiempo) * 100
💪¿Qué es la Retención del Personal?:
1. Es el esfuerzo realizado por las organizaciones para preservar su activo más preciado: los empleados.
2. Es el esfuerzo de las empresas para que sus empleados se aferren a la misma. Comienza con la contratación de personas y continúa después con las entrevistas de salidas
3. Es la capacidad de una organización para retener a sus empleados actuales.
4. Son las estrategias y procesos que desarrolla una organización para mantener a sus mejores talentos y mitigar el riesgo de rotación.
💪¿Cómo se calcula?
He visto dos variantes predominantes:
1. ES LA MAS RECOMENDADA: No teniendo en cuenta los empleados que hayan sido contratados durante el año, ni en el total de empleados, ni en el número de abandonos. Solamente tiene en cuenta el Total de Empleados al Inicio del año y de ellos, cuántos se fueron por cualquier motivo
TRet ((TEmpIn-TTEmpbajas)/TEmpIn)*100
2. Considerándola como lo Opuesto de la Rotación del Personal (considera a los empleados que iniciaron y a los nuevos contratados)
TRetP=(1-(TEaba/PTEmp))*100
Ejemplo: Si la Rotación es del 15%, entonces la Retención es del 85%. SUMA 100
Fuente: Juan Carlos Páez Núñez, LinkedIn
Along with other sectors of the global economy, mining faces significant change, and its approach to talent management will determine its future trajectory. Additional value can be unlocked through higher productivity and safety derived from a better managed, trained, and motivated workforce. Analytics have an exciting role to play here, from finding and keeping talent all the way to helping them do their best work.
There is an increasingly strong imperative to create best-in-class work environments, where people can feel valued, invested in, and fulfilled, and bring their best selves to work every day to deliver on the expectations of shareholders, policy makers, and society.
Source: McKinsey
www.mckinsey.com/industries/metals-and-mining/our-insights/has-mining-lost-its-luster-why-talent-is-moving-elsewhere-and-how-to-bring-them-back#/
Simon Jowitt, LinkedIn
The internet is full of investing resources.
If you know how to use them well, it can be a gold mine.
1. Morningstar
Morningstar is an American financial services firm. It provides an array of investment research and investment management services.
You can take a look at a company’s financials, valuation, operating performance, dividend, ownership and much more.
2. Dataroma
Via Dataroma, you can track the portfolios of the best investors in the world. Think about Warren Buffett, Chuck Akre, Terry Smith and Howard Marks.
You can also take a look at which stocks are bought the most by these superinvestors, which insiders are buying their own stock, and so on.
3. Yahoo Finance
Yahoo Finance provides you with financial news, data and commentary including stock quotes, press releases, financial reports, and original content.
It’s a great website to check daily stock news or create a watchlist.
4. Seeking Alpha
If you are looking for stock analysis, Seeking Alpha is the place to be.
You can follow the stocks you want and you’ll receive an email each time someone publishes an article about the companies you’re interested in.
5. The SEC website
The SEC website gives you access to the full text of SEC filings since 2001.
Everything that a company has filed over the past few years can be found on this website.
6. ROIC.ai
Via ROIC.ai you can find more than 30 years of financial data for free. ROIC.ai covers more than 37.000 companies.
It’s a great way to look at the evolution of the financials of a company.
7. The company’s website
The best way to start analyzing a stock is by going to the company’s ‘Investor Relations’ section on their website.
Via this section, you can download it’s annual reports, investor presentations, and much more.
8. Stratosphere
Stratosphere offers you a platform where you can take a look at the financials of a company, visualize data, and screen for stocks which match certain criteria.
9. Investopedia
If you want to learn about a certain investment topic, Investopedia is the place to be.
It features articles, tutorials, videos, and other content designed to help individuals make informed financial decisions.
10. Quartr App
The Quatr App is a financial research and investor relations platform.
This app makes it easy for you to listen to conference calls and take a look at the Investor Presentation of a company.
Source: Chris Quinn, LinkedIn
It is well known that the most critical failure surface for a soil with a large cohesion and a small friction angle is a deep circle, whereas that with a small cohesion and a large friction angle is a shallow circle.
Reference:
Marile O, LinkedIn
Huang, Yang H. (2014). Slope stability analysis by the limit equilibrium method.
Financial planning and analysis (FP&A) is a set of planning, forecasting, budgeting, and analytical activities that support a company's major business decisions and overall financial health.
10 Scenario Analysis Frameworks
You work in FP&A ?
Here is an extract from a course I gave recently.
One of the questions from the students was:
"What are the different methods for scenario analysis"
Here are 10 different methods, with instructions and an illustrative example.
1. "What if" analysis
Identify a set of variables that might impact your business, such as raw material, price, shipping costs, or regional demand.
For example: "What if limestone prices rise by 10%?"
2. Sensitivity
Analyze how changes in a single input would impact a certain output, such as profits.
For instance: examine how a +/- 5% change in energy costs would affect your profits.
3. Probabilistic
Assign probabilities to different scenarios based on historical data or industry insights.
Example: There might be a 20% chance of a severe supply chain disruption.
4. Stress testing
Identify extreme scenarios that might put your company under strain, Evaluate how your company would withstand these scenarios.
Example: a massive drop in demand or a significant disruption in raw material supply.
5. Monte Carlo
Use a computer program to simulate a range of outcomes of different scenarios and calculate probabilities for each.
This could help you understand potential fluctuations in profits, costs, or revenues.
6. Brainstorming
Bring together key stakeholders to generate a wide range of possible future scenarios.
Examples: consider potential political, economic, or industry changes.
Create narratives for different scenarios to help stakeholders visualize potential futures.
7. Clustering
Group similar scenarios together to simplify your analysis.
For example, you might have one cluster of scenarios for Raw material and another for Labor costs
8. Matrix
Create a matrix with two key uncertainties as the axes. Then fill in the quadrants with scenarios based on these uncertainties.
For instance, one axis could be "Energy price volatility" and the other "Regulatory changes".
9. Storytelling
For example, tell a story on how your company would fare under a scenario of rapid economic growth or a severe recession.
10. Simulation
Use sophisticated software to simulate how your company would perform under different scenarios.
Source : Nicolas Boucher, LinkedIn
www.nicolasboucher.online
The global effort to curb carbon emissions is accelerating demand for clean energy technologies and the materials they rely on. Demand for these materials will only continue to grow, especially as some nations aim to achieve net-zero emissions by 2050. While some major materials like steel, copper, and aluminum are already powering the fossil fuel economy, others are more minor materials with potential supply risks. These risks could jeopardize the ability to reduce greenhouse gas emissions within the desirable timeframe to avoid significant climate change. In some cases, it may be necessary to take action to improve the resilience of these material supply chains and mitigate supply risks. Understanding the importance of individual materials to clean energy and the supply risks associated with them is necessary to identifying which materials may serve as potential roadblocks to a clean energy future.
The U.S. Department of Energy (DOE) issued a series of 13 “supply chain deep dive” assessment reports related to the supply chains supporting various energy technologies in 2022 in response to President Biden’s Executive Order on America’s Supply Chains (E.O. 14017). These reports emphasized that supply chain bottlenecks can occur at any stage of the value chain — from mining and refining to component and even subsystem manufacturing. The bottlenecks result from a combination of factors such as material availability, equipment availability, workforce availability and quality, logistics, regulatory frameworks, and market conditions. These bottlenecks were worsened during the global Covid-19 pandemic. Its lingering impacts have hindered capacity expansion for material supply chains and prevented product lead-time recovery. One approach to reduce supply chain risks for the United States is to have a strong domestic manufacturing sector with a diverse set of producers. Boosting responsible domestic production would require leveraging the latest science not only in material extraction but also in developing substitutes and fostering recycling, reuse, and remanufacturing.
Source: https://www.energy.gov/sites/default/files/2023-07/doe-critical-material-assessment_07312023.pdf
There is a new available from IAEG titled “Guidelines for the development and application of engineering geologic models on projects.” The guidelines were created by members of the International Association of Engineering Geologists (IAEG) Committee IAEG C25 – Commission for the Use of Engineering Geologic Models, and represents a consensus view of its members.
The purpose of the guidelines is to provide succinct, practical, accessible, and authoritative advice on the effective use of engineering geological models in a wide range of applications including civil engineering, mining, geohazard studies, offshore studies, land-use planning, and environmental assessments. The Guidelines are broad ranging, intended for use or reference by stakeholders in projects of all scales that interact with or require an understanding of the
ground. They are intended to have worldwide application.
Source: Marcio Leão, LinkedIn
Source article and image: https://www.iaeg.info/
Os processos de produção estão sendo otimizados constantemente com o auxílio da eletrônica embarcada, da informática e de sistemas de comunicação. A telemetria, ferramenta presente nos caminhões utilizados na mineração, possibilita a geração de informações dos sinais vitais dos equipamentos em tempo real. Este trabalho proporcionou o desenvolvimento de ferramentas e dashboards para gestão da velocidade média da frota de transporte, possibilitando o mapeamento e atuação em campo de problemas de vias e gestão do desempenho da equipe.
Os resultados do trabalho mostraram um aumento de produtividade acima de 10% para as duas frotas de transporte avaliadas. O trabalho também teve foco na sustentabilidade, com ganhos expressivos na redução do consumo de óleo diesel e consequente redução de 1.608 t de CO2 emitidos na atmosfera. Para a implantação do monitoramento dos equipamentos através da telemetria, são necessários que existam sensores específicos, corretamente instalados; pessoas capacitadas para análise de parâmetros e rotinas sistemáticas de análise. As estradas de mina são fundamentais para garantir o sucesso da atividade mineradora, são os viabilizadores da etapa de transporte. As vias devem ser aderentes ao projeto geométrico e estrutural [1].
2. MATERIAIS E MÉTODOS
2.1. Mapa de calor de velocidade
2.2. Relatórios de gestão
3. RESULTADOS E DISCUSSÃO
3.1 Aumento de velocidade média
3.2 Aumento de produtividade
3.3 Redução no consumo de óleo diesel
AUTORES: Patrick Teixeira Oliveira – Gerente de Operação de Mina, Marcélio Prado Fontes – professor efetivo do CEFET-MG, Walter Schmidt Felsch Junior – Engenheiro Especialista em Gerenciamento de Frotas e Leonardo Cavalini Bergmann – Diretor de Operações – Instale Tecnologia.
Source: Minerios & Minerale
https://revistaminerios.com.br/telemetria-tecnologia-para-elevar-produtividade-e-reduzir-consumo-de-combustivel/
Image source: Minerios & minerales
Existen varias razones por las cuales un colaborador podría decidir renunciar a una empresa. A continuación, te mencionaré algunas de las razones más comunes:
📌Falta de satisfacción laboral: Si un colaborador no se siente satisfecho con su trabajo, puede decidir buscar nuevas oportunidades que le brinden mayor satisfacción. Esto puede deberse a la falta de reconocimiento, ausencia de retos profesionales, falta de desarrollo profesional o insatisfacción con la cultura de la empresa.
📌Mejores oportunidades: Un colaborador puede recibir una oferta de empleo más atractiva en otra empresa, ya sea en términos de salario, beneficios, posición o crecimiento profesional. Esta puede ser una motivación significativa para renunciar y buscar una nueva oportunidad que se ajuste mejor a sus metas y aspiraciones.
📌Problemas con el liderazgo: Si un colaborador tiene conflictos con su jefe directo o no está satisfecho con la forma en que se maneja el liderazgo en la empresa, es posible que decida renunciar. Una mala relación con el jefe, falta de comunicación efectiva o un estilo de gestión inadecuado pueden generar un ambiente laboral poco favorable y llevar a la decisión de renuncia.
📌Falta de equilibrio entre trabajo y vida personal: Si un colaborador siente que su trabajo está afectando negativamente su vida personal, ya sea debido a largas horas de trabajo, falta de flexibilidad horaria o presiones constantes, puede optar por renunciar en busca de un mejor equilibrio entre su vida profesional y personal.
📌Cambio en la trayectoria profesional: Las metas y los intereses profesionales de una persona pueden evolucionar con el tiempo. Si un colaborador encuentra que su trabajo actual ya no se alinea con sus objetivos a largo plazo o con su pasión, es posible que decida buscar nuevas oportunidades en un campo diferente o en una industria que le resulte más atractiva.
📌Problemas en el ambiente laboral: Un ambiente laboral tóxico, con conflictos constantes entre compañeros, falta de colaboración o discriminación pueden llevar a un colaborador a renunciar. El bienestar emocional y la salud mental son aspectos importantes en la vida de una persona, y si la empresa no brinda un ambiente positivo, algunos colaboradores pueden decidir buscar alternativas más saludables.
Source : EXPERTOS en Competencias y Conductas, LinkedIn
You’ve been avidly collecting data. You’ve figured out how to process it all and set up your formulas… but how do you transform those into powerful KPI dashboards and genuinely valuable data visualizations that bring your insights to life?
There’s an array of data visualization types, and which you choose for your data depends on what measurement you are trying to emphasize and what information you are trying to reveal. If you want to know when you should use a column chart versus a line chart - and yes, there’s a big difference - then this is the guide for you.
Here are 10 effective data visualization examples to incorporate into your dashboards today.
Source: www.sisense.com
📣 Los Indicadores clave de desempeño (KPI) son relevantes para medir y evaluar el desempeño. Aquí les dejo algunos KPI's básicos y/o relevantes en Compras: 👇
✳ COSTO TOTAL DE ADQUISICIÓN (CTA): Este KPI mide el costo total de adquirir un producto o servicio, incluyendo el precio de compra, los costos de transporte, los aranceles, los impuestos, los gastos de almacenamiento, entre otros. El objetivo es buscar reducir el CTA y optimizar los costos asociados con la adquisición de bienes y servicios.
✳ AHORROS: Este indicador mide los ahorros obtenidos a través de actividades de compras estratégicas, como la negociación de precios más bajos, la consolidación de compras, la identificación de alternativas más económicas o la reducción de costos en la cadena de suministro. El objetivo es lograr ahorros significativos y contribuir a la rentabilidad de la organización.
✳ CUMPLIMIENTO DE PROVEEDORES: Este KPI evalúa la capacidad de los proveedores para cumplir con los plazos de entrega, la calidad de los productos o servicios suministrados y el cumplimiento de los términos y condiciones acordados. Un alto nivel de cumplimiento de proveedores asegura una cadena de suministro eficiente y reduce el riesgo de interrupciones en la producción.
✳ NIVEL DE SATISFACCIÓN DEL CLIENTE INTERNO: Este indicador mide la satisfacción de los clientes internos (departamentos o unidades de la organización) con los servicios y productos entregados por el departamento de Compras. Puede medirse mediante encuestas, retroalimentación o evaluaciones periódicas. El objetivo es asegurar que las necesidades y expectativas internas sean satisfechas de manera eficiente y efectiva.
✳ TIEMPO DE CICLO DE COMPRA: Este KPI mide la eficiencia del proceso de compras midiendo el tiempo que transcurre desde la solicitud de compra hasta la recepción de los productos o servicios solicitados. Un tiempo de ciclo de compra corto indica una gestión ágil y eficiente de las adquisiciones.
Estos son solo algunos ejemplos de KPI relevantes en Compras.
✴ Los KPI's pueden variar dependiendo de la industria, el tamaño de la organización y los objetivos específicos de la función de Compras.
❌ OJO: No midas todo, es importante seleccionar y monitorear aquellos KPI que sean más relevantes para medir el desempeño y contribuir al éxito de la organización.
Fuente: Penélope Rojas (Penny), LinkedIn
Scare yourself. If you regularly have meetings with foreign partners, it happens that out of an hour of exchanges, there are 5, 10, 15 minutes, or even more, where communication is impaired due to some misunderstandings or complete misunderstandings (technical issues, loss of attention, unclear explanations, differences in language levels, accents and pronunciation, etc.).
Now, calculate how many such meetings you attend per month, then per year, and add up all those critical moments where there is no discussion of the content and you will realize the colossal loss of information they represent.
It is not possible to completely eradicate these disruptions. But they can be reduced. How? When I ask what they do to deal with them, participants in cross-cultural training very generally say the same thing: simplify expression, slow down the flow, repeat, rephrase, and then write up the minutes of the meeting.
This is very useful, but often not enough. One then turns to the many articles devoted to the challenges of intercultural communication. But we are often frustrated by the advice given. We are told that we should not assume that our partners have the same references and habits in terms of communication, that we should be « kind », « listening », « open and respectful », « show empathy ». These are useful but very general postures that remind us of the abstract advice of personal development (Be yourself! Enjoy every moment!). The question remains: what can we actually do?
I propose a non-exhaustive list of actions to implement (in blue below). Some of them come from personal observations and practices; others have been mentioned by participants in intercultural trainings (I will mention it if the case). It is up to each of you to take what you from this toolb…
—
Source: https://gestion-des-risques-interculturels.com/analyses/intercultural-meetings-10-good-practices-to-reduce-misunderstandings/
Crédit photo Jason Goodman, image gratuite Unsplash.