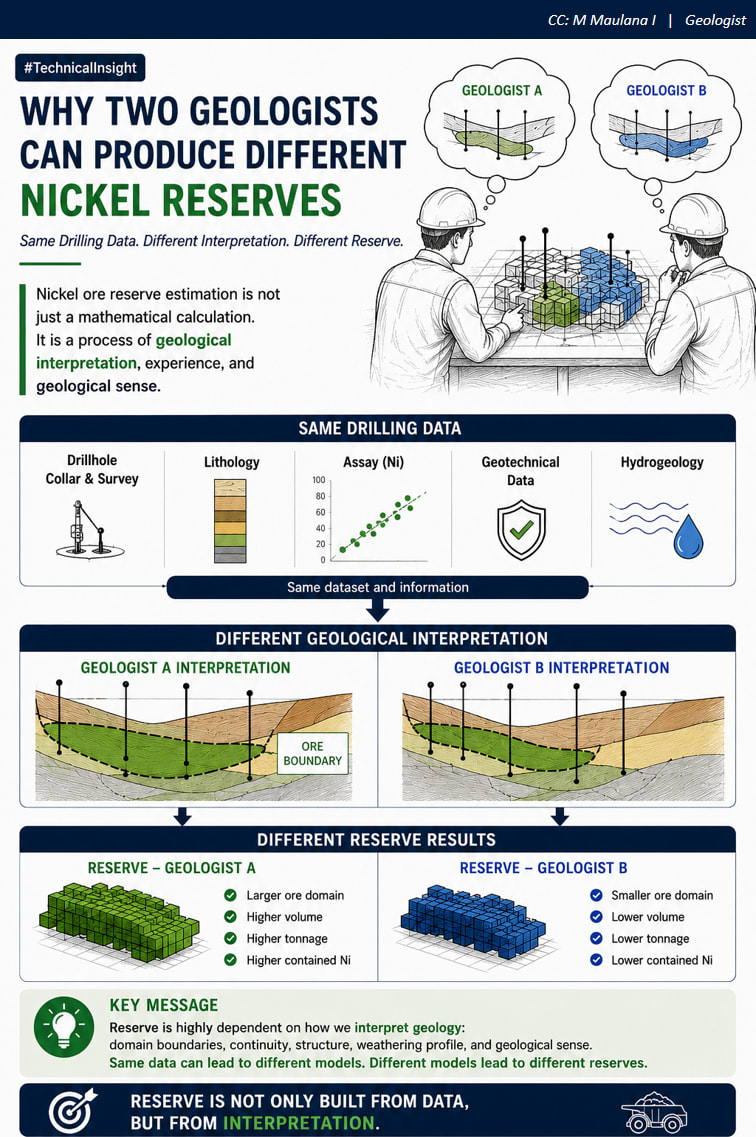

A common mistake I see in mining project reviews — Resource Classification
Reviewing mining projects from discovery through to operations, there’s one issue that comes up time and time again: resource classification. Teams spend countless hours on estimation methods and geological interpretation, only to fall short when it comes to correctly classifying the resource. Why does it happen? Optimism bias (often driven by board or funding expectations) Time pressure at the end of a study Inexperience with classification standards Or simply underestimating how critical classification really is As an external reviewer, here are a few practical principles that consistently separate robust resource models from risky ones: 🔹 Let drill spacing lead the classification Be strict. If there are spacing gaps, classify them accordingly. No “spotted dogs”. 🔹 Avoid circles around drill holes Resources aren’t radial. Use orebody knowledge and geological controls to define realistic shapes. 🔹 Data integrity matters QAQC results, core recovery, and missing samples must be reflected in the classification. Confidence in tonnes starts with confidence in data. 🔹 Respect the limits of your estimation parameters Search radii, variography, and interpolation choices should cap — not inflate — classification confidence. 🔹 Classify waste properly If the drill spacing supports a measured ore classification, the same logic applies to internal waste. Mining companies want to know where measured waste is — ironically, we mine far more waste than ore. Resource classification isn’t a tick-box exercise. It’s a risk statement, and decision-makers rely on it more than we often acknowledge. Get it right early, and everything downstream — mine design, scheduling, economics — becomes stronger. Happy to discuss or hear how others approach this challenge in their projects.