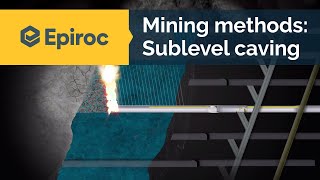
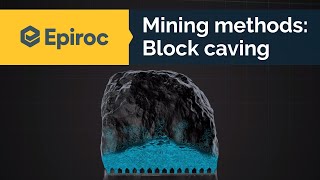
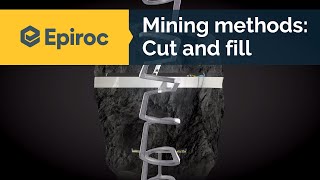
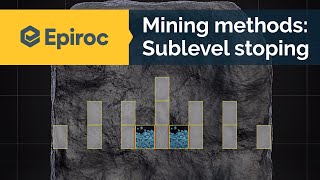
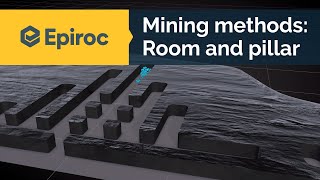
This module covers the fundamentals of mining, including mining methods, global production trends, mineral usage, and key industry statistics shaping the sector.
Articles explaining mining methods, production data, commodity trends, and how minerals support modern industries worldwide.
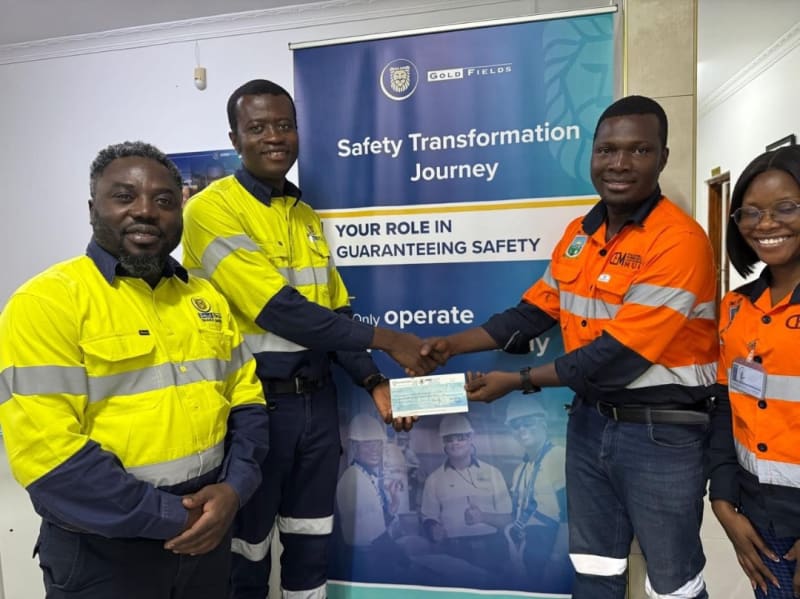
Gold Fields Ghana has presented a cheque of GHS400,000 to the University of Mines and Technology in support of this year's World Day for Safety and Health at Work, scheduled for 28 April 2026
Key Takeaways
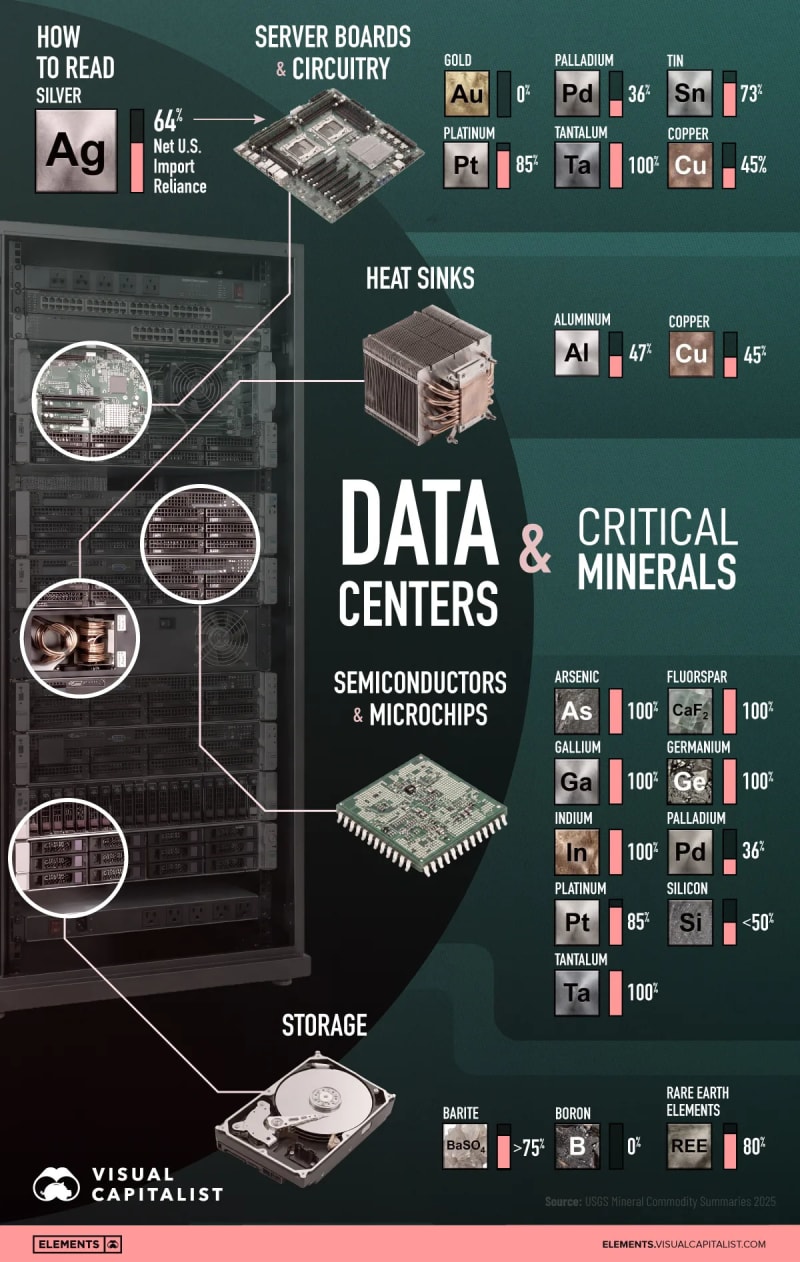
The U.S. is 100% import reliant for several critical minerals used in AI-related infrastructure.
Core data center components—from circuitry to magnets—depend heavily on foreign-sourced materials.
The artificial intelligence boom is driving an unprecedented buildout of data centers across the United States.
Behind every AI model and cloud server sits a complex web of minerals that make modern computing possible. From semiconductors to cooling systems, these materials form the backbone of digital infrastructure.
This visualization breaks down the critical minerals used in AI data centers—and how reliant the U.S. is on imports for each. The data for this visualization comes from the U.S. Geological Survey (USGS).
Semiconductors: America’s Biggest Vulnerability
Semiconductors are the “brains” of AI data centers—and they are highly import dependent. The U.S. is 100% reliant on imports for arsenic, fluorspar, gallium, germanium, indium, and tantalum used in chip production.
It also imports 85% of its platinum and 36% of its palladium needs, both critical for chip manufacturing.
While silicon, the base material for chips, has less than 50% import reliance, many of the trace elements that enable advanced computing are entirely foreign-controlled.
Data center component Critical mineral U.S. import reliance (%)
Server boards and circuitry Silver 64%
Gold 0%
Copper 45%
Tin 73%
Tantalum 100%
Palladium 36%
Platinum 85%
Heat sinks Aluminum 47%
Copper 45%
Semiconductors and microchips Arsenic 100%
Fluorspar 100%
Gallium 100%
Germanium 100%
Indium 100%
Palladium 36%
Platinum 85%
Silicon 75%
Boron 0%
Rare earth elements 80%
Circuitry and Server Components
Beyond chips, server boards and circuitry require a range of conductive and precious metals. The U.S. imports 64% of its silver and 73% of its tin, both vital for soldering and electrical conductivity.
Copper—essential for wiring and connectivity—has a 45% import reliance. Tantalum, used in capacitors, is 100% imported.
Gold stands out as a rare exception, with 0% net import reliance, offering a small pocket of domestic security in an otherwise globalized supply chain.
Cooling Systems and Data Storage
AI servers generate massive heat loads, making cooling systems crucial. Heat sinks rely on aluminum (47% import reliance) and copper (45%).
Meanwhile, data storage components such as magnets and drives depend on rare earth elements, with 80% import reliance. Barite—used in storage-related applications—has also more than 75% reliance.
China’s Commanding Share
Currently, China dominates the production of most of the critical minerals used in data centers. This near-monopoly has become a major concern for other nations, with the U.S. government currently pushing for increased domestic production of these materials.
In addition to being the leading producer, China also controls much of the refining capacity for many of these minerals. For example, around 90% of rare earths are refined in China.
In the race to dominate AI, access to critical minerals may prove just as important as technological leadership.
Source: Credit to Bruno Venditti and Visual Capitalist
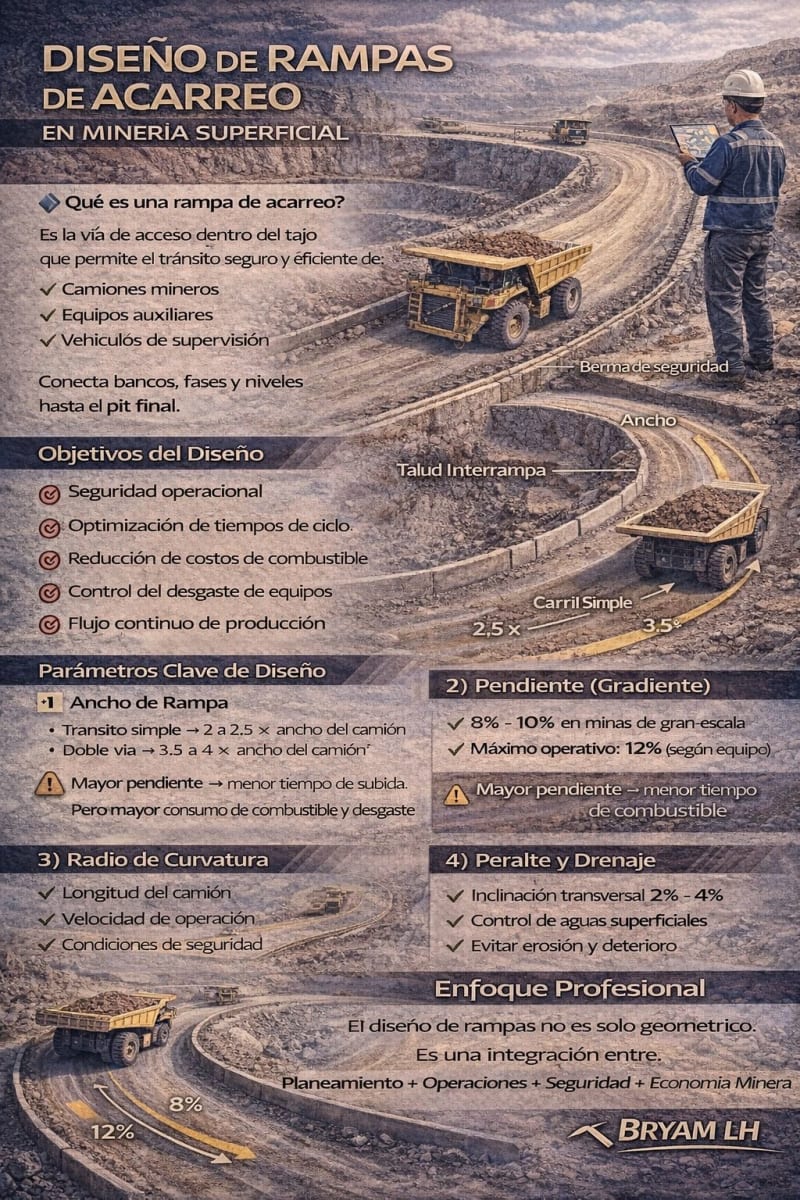
Diseño de Rampas de Acarreo en Minería Superficial
🔷 ¿Qué es una rampa de acarreo?
Es la vía de acceso dentro del tajo que permite el tránsito seguro y eficiente de:
✔ Camiones mineros
✔ Equipos auxiliares
✔ Vehículos de supervisión
Conecta bancos, fases y niveles hasta el pit final.
🔷 Objetivos del Diseño
🎯 Seguridad operacional
🎯 Optimización de tiempos de ciclo
🎯 Reducción de costos de combustible
🎯 Control del desgaste de equipos
🎯 Flujo continuo de producción
🔷 Parámetros Clave de Diseño
1️⃣ Ancho de Rampa
Depende del tipo de vía:
• Tránsito simple → 2 a 2.5 × ancho del camión
• Doble vía → 3.5 a 4 × ancho del camión
Incluye:
✔ Berma de seguridad
✔ Cunetas de drenaje
✔ Espacio de maniobra
2️⃣ Pendiente (Gradiente)
Rango típico:
• 8% – 10% en minas de gran escala
• Máximo operativo: 12% (según equipo)
⚠ Mayor pendiente → menor tiempo de subida
⚠ Pero mayor consumo de combustible y desgaste
3️⃣ Radio de Curvatura
Depende de:
✔ Longitud del camión
✔ Velocidad de operación
✔ Condiciones de seguridad
Curvas más amplias → menor riesgo de volcadura.
4️⃣ Peralte y Drenaje
✔ Inclinación transversal 2% – 4%
✔ Control de aguas superficiales
✔ Evitar erosión y deterioro
🔷 Factores que Influyen en el Diseño
🔹 Capacidad del camión (CAT 793, Komatsu 930E, etc.)
🔹 Producción diaria
🔹 Vida útil del proyecto
🔹 Geometría del pit
🔹 Condiciones climáticas
🔷 Impacto Económico
Un mal diseño genera:
❌ Mayor tiempo de ciclo
❌ Alto consumo de combustible
❌ Mayor costo por tonelada
❌ Riesgos operacionales
Un buen diseño permite:
✅ Mayor productividad
✅ Seguridad continua
✅ Optimización del stripping ratio
✅ Reducción de costos operativos
🔷 Enfoque Profesional
El diseño de rampas no es solo geométrico.
Es una integración entre:
Planeamiento + Operaciones + Seguridad + Economía Minera.
Mining executives are too distracted to fix operations.
Technology is not the answer.
Surprising to hear from someone who markets mining technology, I know. But hear me out.
Mining tech conferences are packed these days. Vendors pitch AI dashboards, autonomous trucks, and predictive-maintenance platforms. Boardrooms nod along, eager not to fall behind. Yet when Bain* recently asked executives from miners worth a combined $300bn to rank the factors most critical to improving site operations, technology came dead last.
What topped the list was considerably less photogenic. Buy-in from the front line and management came first, followed by a strong understanding of what actually creates value and, in third place, stable leadership.
The executives were saying that without the human scaffolding, even the cleverest tools amount to expensive furniture.
Technology works just fine. The software does what it promises.
The problem is rarely the tool.
The problem is the system underneath it.
And if that system is flawed, if decision rights are murky, if leadership turns over every eighteen months, if nobody on the front line was consulted before the rollout, then no amount of technology will fix it. You are just automating a broken process. You have to start from the beginning: people.
The more conversations I have with stakeholders across this industry, the clearer a pattern becomes.
There are two ways to bring innovation into mining.
The first, which most choose, is to adapt to the existing audience.
Sell to them the way they are used to buying. This is why mining tech startups begin with a consulting model before attempting to shift towards subscription or platform plays. It is pragmatic. It gets you in the door. But it also means you end up reinforcing the very system you set out to improve.
The second way is to try to shift the industry's thinking altogether.
This is harder, slower, and impossible for any single company or person to pull off alone. It requires a collective effort from operators, vendors, investors, and the growing number of voices in this sector who see that the old way of doing things is running out of road.
The pressure to produce more from less is not going away, and adapting to an outdated operating model will not meet it.
If you are a tech vendor, your leverage is limited. You build the best product you can and hope the buyer is ready for it. But there are plenty of people across this industry with platforms, experience, and credibility who could help change the narrative.
Mining's greatest untapped resource remains the one that has always been there: people who know the operation, who stay long enough to see changes through, and who are trusted enough to be told the truth when things go wrong. The industry would do well to invest in them with the same enthusiasm it reserves for the latest AI.
Whether enough of those voices choose to speak up is another question.
A quiet shift is under way in global industry. Systems that learn from data are moving from pilot projects to operational infrastructure, changing how firms assess risk, allocate capital and run complex processes. The productivity gains are real. So are the institutional consequences.
Mining offers a clear illustration. Faced with declining ore grades, more intricate geology and tighter environmental constraints, the sector is embedding machine-learning tools across exploration, planning, processing and monitoring. Algorithms refine geological models, optimise short-term schedules and anticipate equipment failure. Sensor networks and adaptive control systems improve safety and stabilize output. Processing plants increasingly adjust to feed variability through data-driven models rather than fixed operating assumptions.
The implications reach beyond efficiency. When predictive systems influence reserve estimation, dispatch decisions and environmental oversight, they also reshape how uncertainty is measured and how responsibility is assigned. Questions of transparency, skills and data governance become central.
The success of intelligent mining will depend less on technical sophistication than on institutional discipline. Properly integrated, these systems can strengthen resilience and resource efficiency. Poorly governed, they risk creating new forms of opacity. The challenge is not simply to deploy smarter tools, but to ensure they remain accountable.
Source: Credit to Fernando Acosta, International Copper Study Group
Hace unas semanas, la Sociedad Nacional de Mineria, Petroleo y Energia - SNMPE publicó su Memoria 2025 y los resultados son contundentes: la minería peruana no solo crece, se mantiene firme y se consolida como el verdadero motor económico del país. 🇵🇪📈
📈 +2% PBI Minero vs. 2024
💰 US$ 5,133 millones en inversión (ene–nov) → +21%
🌎 US$ 54,535 millones en exportaciones (ene–nov) → +24%
📊 Representa el 66% de las exportaciones nacionales
Precios promedio 2025 vs. 2024:
🥇 Oro +43.9%
🥈 Plata +41.8%
🥉 Cobre +8.3%
⚙️ Zinc +3.3%
🏛️ Recaudación minera: S/ 16,061 millones (+55%)
▪ Canon: S/ 6,993 millones (+25.3%)
▪ Regalías: S/ 2,687 millones (+22.9%)
💭 Reflexión clave (enero 2026):
Según cifras oficiales, 31,628 inscritos en el REINFO, de los cuales 25% tiene condición de suspendido.
El crecimiento es claro.
La inversión también.
Pero la formalización sigue siendo un desafío estructural.
La minería peruana está fuerte 📊
Ahora el reto es consolidarla con institucionalidad y sostenibilidad.
Source: Credit to Leonardo Brandon Ch. Valverde Rubio & SNMPE
💡 What Happens to Waste Rock in Mining?
In every mining operation, not all rock extracted contains valuable minerals. The material with insufficient economic value—known as waste rock—must still be handled responsibly.
After excavation, waste rock is typically hauled to designated storage areas, known as waste rock dumps or stockpiles. These are carefully engineered to ensure slope stability, erosion control, and drainage management. In modern mines, environmental engineers also assess the rock’s acid-generating potential to prevent acid mine drainage (AMD), which can contaminate water resources.
Increasingly, mining companies are re-evaluating waste rock as a resource. Techniques such as re-mining for residual metals, crushing for aggregate use, and progressive reclamation are turning waste rock piles into sustainable landforms and even construction materials.
Mining responsibly means closing the loop—treating waste not as a by-product, but as part of a continuous cycle of value and restoration. 🌱
💭 How do you think the mining industry can further repurpose waste rock to support sustainability?
Ghana’s mining industry continues to evolve, with major reforms, investments, and regulatory actions positioning the sector for sustainable growth.
🔹 Crackdown on Illegal Mining
The government has intensified its campaign against illegal mining, recording 1,486 arrests and 443 seized excavators between January and November 2025. These efforts reflect a strong commitment to protecting the environment and promoting responsible mining practices.
🔹 Strategic Lithium Development
Ghana is taking bold steps to become a significant player in the global lithium market. Current policies emphasize local processing and value addition, ensuring the country captures greater economic benefits from this strategic mineral.
🔹 New Mining Reforms
Ongoing reforms aim to create a fairer and more transparent mining industry. Proposed measures include:
Shorter mining leases
Capped prospecting licenses
Mandatory community development agreements
These reforms are designed to enhance accountability while ensuring mining activities deliver real value to host communities.
🔹 Strong Investor Confidence
Newmont’s $900 million Ahafo North project is set to produce 50,000 ounces of gold this year, with plans to scale up to 275,000–325,000 ounces annually. This major investment underscores the continued confidence global players have in Ghana’s mining landscape.
🔹 Environmental Concerns & Call for Sustainability
Groups like the Kwahuman Global Network continue to raise concerns about the environmental impact of illegal mining, reinforcing the need for sustainable and responsible practices across the sector.
🎓 Admissions Open — 2025/2026 Academic Year
Festari Institute of Professional Studies (FIPS) is now enrolling for professionally aligned programs, with all qualifications awarded by iPED UK.
📌 Hybrid learning
📌 Flexible schedules
📌 Diploma to Postgraduate Diploma levels
☎️ Contact: 0541603237 / 0207702157 / 0240699535
📍 Tarkwa - Ghana
Apply now and elevate your career trajectory.
Don't forget to subscribe to ZVENIA.COM
#Education #ProfessionalDevelopment #AdmissionsOpen #FIPS #iPEDUK #CareerAdvancement
[PT] Do ponto de vista matemático, podemos interpretar o processo de cominuição como uma sucessiva redução do tamanho médio das partículas através da adição de energia ao sistema. E estas partículas podem ser descritas através de uma distribuição granulómetrica, partindo da rocha intacta até um eventual produto de moagem.
Para mais detalhes, confira o post completo aqui na plataforma ZVENIA.
[EN] From a mathematical point of view, we can interpret the comminution process as a successive reduction in the average particle size through the addition of energy to the system. And these particles can be described by a granulometric distribution, starting from the intact rock to a possible grinding product.
For more details, check out the full post here on the ZVENIA platform.
https://zvenia.com/z-posts/estado-de-fraturamento-e-fragmentacao-de-macicos-rochosos-tese-de-doutorado-2020/
This module covers the fundamentals of mining, including mining methods, global production trends, mineral usage, and key industry statistics shaping the sector.
Conferences, webinars, and forums focused on global mining trends, commodities, and industry outlooks.
This module covers the fundamentals of mining, including mining methods, global production trends, mineral usage, and key industry statistics shaping the sector.
Discussions on mining fundamentals, market evolution, and the role of minerals in the global economy.
This module covers the fundamentals of mining, including mining methods, global production trends, mineral usage, and key industry statistics shaping the sector.
Consulting, market studies, training, and advisory services related to mining fundamentals and industry analysis.