- Z-POSTS (28)
- Z-NOTES
- Z-EVENTS
- DESCRIPTION
- Item 1
17 Finances and markets
Add Z-POSTZ-POSTS is a public space. The content written here will be visible to the ZVENIA community.
 ZVENIA Mining .27/03/2024
The CFO should act as a business partner to other CXO roles.
What are some concrete areas where the CFO can be a partner?
Here’s an overview of seven CXO roles, including what each is responsible for…CEO
– Provide financial insights and data to inform strategic decisions.
– Develop financial models to assess the impact of various strategies.
– Ensure financial transparency to support stakeholder communication.
– Collaborate on budgeting and resource allocation to align with the vision.
– Monitor key performance indicators (KPIs) to track the company’s performance.COO
– Provide financial data for optimizing operational processes.
– Assist in cost control and resource allocation to improve efficiency.
– Evaluate the financial impact of operational decisions.
– Implement financial controls to mitigate operational risks.
– Collaborate on capital investments and resource planning.CSO
– Collaborate on setting realistic sales targets.
– Provide financial data for sales forecasts and revenue tracking.
– Assist in pricing strategies to optimize profitability.
– Monitor and analyze the financial impact of sales initiatives.
– Ensure alignment between sales and financial goals.CMO
– Allocate marketing budgets effectively based on financial analysis.
– Measure and report on the financial impact of marketing campaigns.
– Provide data for market research and customer segmentation.
– Collaborate on pricing strategies and revenue forecasts.
– Ensure alignment between marketing spending and revenue goals.CTO
– Assist in budgeting for technology investments.
– Evaluate the financial impact of technology projects.
– Ensure compliance with IT-related financial regulations.
– Collaborate on cost-effective tech solutions.
– Monitor ROI on technology investments.CHRO
– Provide financial data for compensation and benefits planning.
– Collaborate on budgeting for recruitment and training.
– Monitor labor-related costs and identify cost-saving opportunities.
– Support HR in aligning talent strategies with financial goals.
– Employee benefit cost managementCLO
– Collaborate on budgeting for legal expenses.
– Provide financial data for risk assessment and mitigation.
– Assist in compliance reporting and financial impact analysis.
– Support legal teams in cost-effective contract negotiations.
-Legal cost managementDid we miss any critical CXOs?
Do you have more suggestions for how the CFO (and Finance) can best be a business partner to other CXOs?
Source: Anders Liu-Lindberg
Credits to Anders Liu-Lindberg ZVENIA Mining .26/03/2024
1. How to read an annual report
2. How to analyze stocks
3. Thinking Fast and Slow
4. Ten tips from Warren Buffett
5. The power of compounding
6. How people will remember you
7. Biases that harm your decision-making
8. The psychology of human misjudgment
9. EBITDA 101
10. McKinsey’s Valuation BookSource: Pieter Slegers
Credits to Compounding Resources ZVENIA Mining .16/03/2024
EBITDA is an acronym that stands for Earnings Before Interest, Taxes, Depreciation & Amortization.
EBITDA is a major financial indicator used to evaluate companies’ profitability with different capital structures.
EBITDA is a rough guide to show how much cash a business generates.
Calculating EBITDA requires information from the company’s Income Statement and Cash Flow Statement.
Here’s one way to do it:
Net Income
+ Interest Expense (Income Statement)
+ Taxes (Income Statement)
+ Depreciation (Cash Flow Statement)
+ Amortization (Cash Flow Statement)Some investors love EBITDA. Others despise it.
EBITDA does not take into account all business activities, so it might overstate cash flow.
Charlie Munger calls EBITDA “Bullsh*t Earnings”
Why? Because it ignores depreciation as an expense.
Depreciation is when a tangible asset’s value is gradually reduced over time to account for wear and tear.
The equipment will eventually be replaced, so depreciation is an actual expense. This is why ignoring it when calculating profits can be a big mistake.
Buffett & Munger prefer to look at EBT — Earnings Before Taxes. This allows them to compare the earnings yield on a business to the earnings yield on bonds (which is also a pre-tax number).
Credits to Brian Stoffel
Credits to Brian Stoffel ZVENIA Mining .28/02/2024
Learn Financial Modeling for free with this comprehensive handbook! 🤩
1. Why is Financial Modeling Important?
2. Types of Financial Models
3. Financial Statement Anatomy
4. Top 10 Excel Functions You Should Know in Financial Modeling
5. The Income Statement Guide
6. The Balance Sheet Guide
7. The Cash Flow Statement Guide
8. The Ultimate Budgeting Guide
9. Inventory Valuation Methods
10. Depreciation Methods
11. Financial Ratios
12. What is beta? https
13. Options Pricing
14. Top Finance KPIs
15. Accounting vs Finance
16. EBIT vs EBITDA
17. Company Valuation Methods
18. Top Finance Certifications
19. 17 Financial Modeling Tips & Tricks
20. Excel Shortcuts Cheatsheet
21. Typical Excel Mistakes When Building a Financial ModelFollow Financial Modeling World Cup for more finance and Excel content! 📈
ZVENIA would like to say a big thank you to the people at FMWC for sharing this great content with us:
🙏 Katrīna Anevica
🙏 Renat Stanko
🙏 Andrew Grigolyunovich, CFA
🙏 Shihan Maheen Seenath
🙏 Maksims Sičs
🙏 Toomas O’Brock
🙏 Emils SaulitisFinancial Modeling World Cup ZVENIA Mining .22/02/2024
The ranks of the most valuable mining companies in the world were throughly scrambled in 2023 as governments intervened, lithium and nickel prices tumbled, gold hit records and a new listing went ballistic
At the end of 2023, the MINING.COM TOP 50* ranking of the world’s most valuable miners reached a combined $1.42 trillion, up a healthy, if far from spectacular $48.7 billion over the course of 2023. Mining’s top tier is also worth $330 billion less than in March 2022.
Metal and mineral markets are volatile at the best of times – the nickel, cobalt and lithium price collapse in 2023 was extreme but not entirely unprecedented. Rare earth producers, platinum group metal watchers, iron ore followers, and gold and silver bugs for that matter, have been through worse.
Mining companies have become better at navigating choppy waters and as a whole the majors performed fairly consistently last year despite geopolitical and market turmoil, but within the ranking, 2023 fortunes were made and lost over what seemed like days.
The forced closure of one of the world’s biggest copper mines – and the subsequent collapse of owner First Quantum Minerals stock – served as a stark reminder of the outsized risks miners face over and above market swings.
Panama root canal
After months of protests and political pressure, at the end of November the Panama government ordered the closure of First Quantum Minerals’ Cobre Panama mine following a ruling by the Supreme Court that declared the mining contract for the operation unconstitutional.Public figures, including climate activist Greta Thunberg and Hollywood actor Leonardo Di Caprio backed the protests and shared a video calling for the “mega mine” to cease operations, which quickly went viral.
That mining cobre is at the nexus of the green energy transition is clearly an irony lost on those trying to save the world. FQM is seeking arbitration and completely winding down operations will take time, but a reopening of Cobre Panama is not on the cards.
From 25th position in the ranking at the end of March 2022 and a valuation well above $20 billion, the November-December sell off saw FQM drop out of the top tier altogether, ending 2023 at number 58 with a market cap below $6 billion.
Cobre Panama supplied more than 40% of the company’s revenue, and with nickel prices plummeting FQM has also been forced to suspend operations at its Raventhorpe mine in Australia.
Amid the inevitable takeover rumours now in circulation, shares in the Vancouver-based company have rallied in 2024, but still not enough to reenter the top 50.
No. 12 with a bullet
If 2023 was an annus horribilis for FQM it was mirabilis for Amman Mineral Internasional. Stock in the Indonesian firm surged by 269% from its July debut in Jakarta to reach a market capitalisation of more than $30 billion at the end of last year – and number 12 in the ranking.That valuation is quite an achievement on annual revenue of $2 billion no matter how fat margins are at the company’s Batu Hijau copper and gold mine. Batu Hijau is the third largest mine worldwide in terms of copper equivalent output (but no match for Cobre Panama when it comes to the orange metal alone) and has been in production since the turn of the millennium. Amman is also developing the adjacent Elang project on the island of Sumbawa.
Amman Minerals’ ascent has minted at least six new billionaires and the stock appears to be building on its success in 2024, rising by double digits in January already.
Indonesia’s other major mining IPO, Harita Nickel, was on a different trajectory altogether. After listing in April and raising $672m, the company has had a tough go of it and the stock has shed more than 38% since then as nickel prices continue to decline.
Shiny gold, dull silver, tarnished PGMs
The price of gold hit an all-time record on December 1, 2023. But bullion’s best ever level passed without the usual fanfare and despite bullish indications for 2024, gold mining stocks did not exactly storm the rankings of the most valuable miners.Over the course of 2023 gold and royalty companies on the MINING.COM TOP 50* ranking of the world’s most valuable miners added a collective $20.8 billion in market cap.
And judging by gold miners’ performance so far this year, gold above $2,000 is not providing enough support. Newmont is already down 17%, Barrick has shed 13% and Agnico Eagle shareholders are 9% poorer.
The number of precious metals companies in the top 50 has also been relatively stable over the years. With Newmont’s absorption of Newcrest now complete, the open slot was taken up by Kinross, which spent a few years in the wilderness.
Anglogold Ashanti was just edged out by Jiangxi Copper for position number 50 on the last trading days of 2023, but based on its performance so far in 2024 the London-listed company is already back among the top tier. Indeed Anglogold is the only major gold player in the black year to date.
…
Source: mining.com/top-50-biggest-mining-companies/ ZVENIA Mining .21/02/2024
May 2023
Newmont agree deal with Newcrest
Newmont, the world’s biggest gold mining company agreed in May 2023 to acquire Australia-based gold miner Newcrest US$19.2bn/AU$26bn in the industry’s biggest deal to date.May 2023
Allkem and Livent Fuse
Allkem Limited and Livent Corp join forces in a US$10.6 bn or AU$15.7bn all-stock merger of equals deal.April 2023
BHP acquires OZ Minerals
The scheme was finally given the green-light by the Federal Court of Australia after the OZ Minerals shareholders gave the US$6.4bn or AU$9.6 bn acquisition the thumbs up.Dec 2022
Rio Tinto completes Turquoise Hill deal
Rio Tinto completes US$3.3bn or AU$4.9bn Turquoise Hill deal for larger chunk in the mammoth Oyu Tolgoi project in Mongolia.Feb 2022
Agnico and Kirkland Lake Merge
In a merger of equals which now creates a mining industry leader with a dominant position in the Canadian gold mining industry, Agnico Eagle Mines Limited and Kirkland Lake Gold Ltd combined in a transaction valued at US$11bn or CAD 13.5 bn/ AU$16bn.Dec 2019
Barrick Gold-Randgold agree to merger creating a new gold mammoth In the industry
The share-for-share deal valued at US$6.5 bn or AU$9.8bn. The deal resulted in the formation of a “new Barrick” with a strong operational foundation across Africa, North America and South America as well as operations in Saudi Arabia and PNG.March 2019
Newmont acquire Goldcorp for $10bn
An acquisition meaning the creation of a world leading gold company,. In 2019, Newmont acquired all the outstanding common shares of Goldcorp in a stock-for-stock transaction valued at US$10bn or AU$15bn.And way back in 2007…
November 2007
Rio Tinto acquires Alcan’s outstanding shares
At the time this was the largest deal in mining & metals history for US$38.1bn/ AU$44bn.Source: Jon Taylor, LinkedIn
csgtalent ZVENIA Mining .19/01/2024
How to analyze In 2 minutes a:
• Balance sheet
• Income Statement
• Cash Flow Statement1️⃣ Balance sheet
A balance consists of the following elements:
• Current Assets
• LT Assets
• Current Liabilities
• LT Liabilities
• Shareholders EquityIt shows you what the company owns and owes.
This statement is based on a simple formula:
Assets = Liabilities + Equity2️⃣ Income Statement
An income statement shows you the income and expenses of a company.
Revenue
– COGS
= Gross Profit
– Operating Expenses
= Operating Income
– Non-Operating Income/Expenses
= Pre-Tax Income
– Taxes
= Net Income3️⃣ Cash Flow Statement
The Cash Flow Statement consists of 3 elements:
• Cash Flow from Operating Activities
• Cash Flow from Investing Activities
• Cash Flow from Financing ActivitiesIt shows you the cash that enters and leaves a company.
Cash Flow from Operating ActivitiesNet Income
+ Non-Cash Changes
+/- Changes in Working Capital
= Cash Flow from Operations
Cash Flow from Investing Activities– Capital Expenditures
– Acquisitions
+ Proceeds from the sale of investments
= Cash Flow from Investments
Cash Flow from Financing Activities+/- Borrow/Repay Debt
+/- Issue/Repurchase of stocks
– Pay Dividends
= Cash Flow from FinancingCredits to Compounding Resources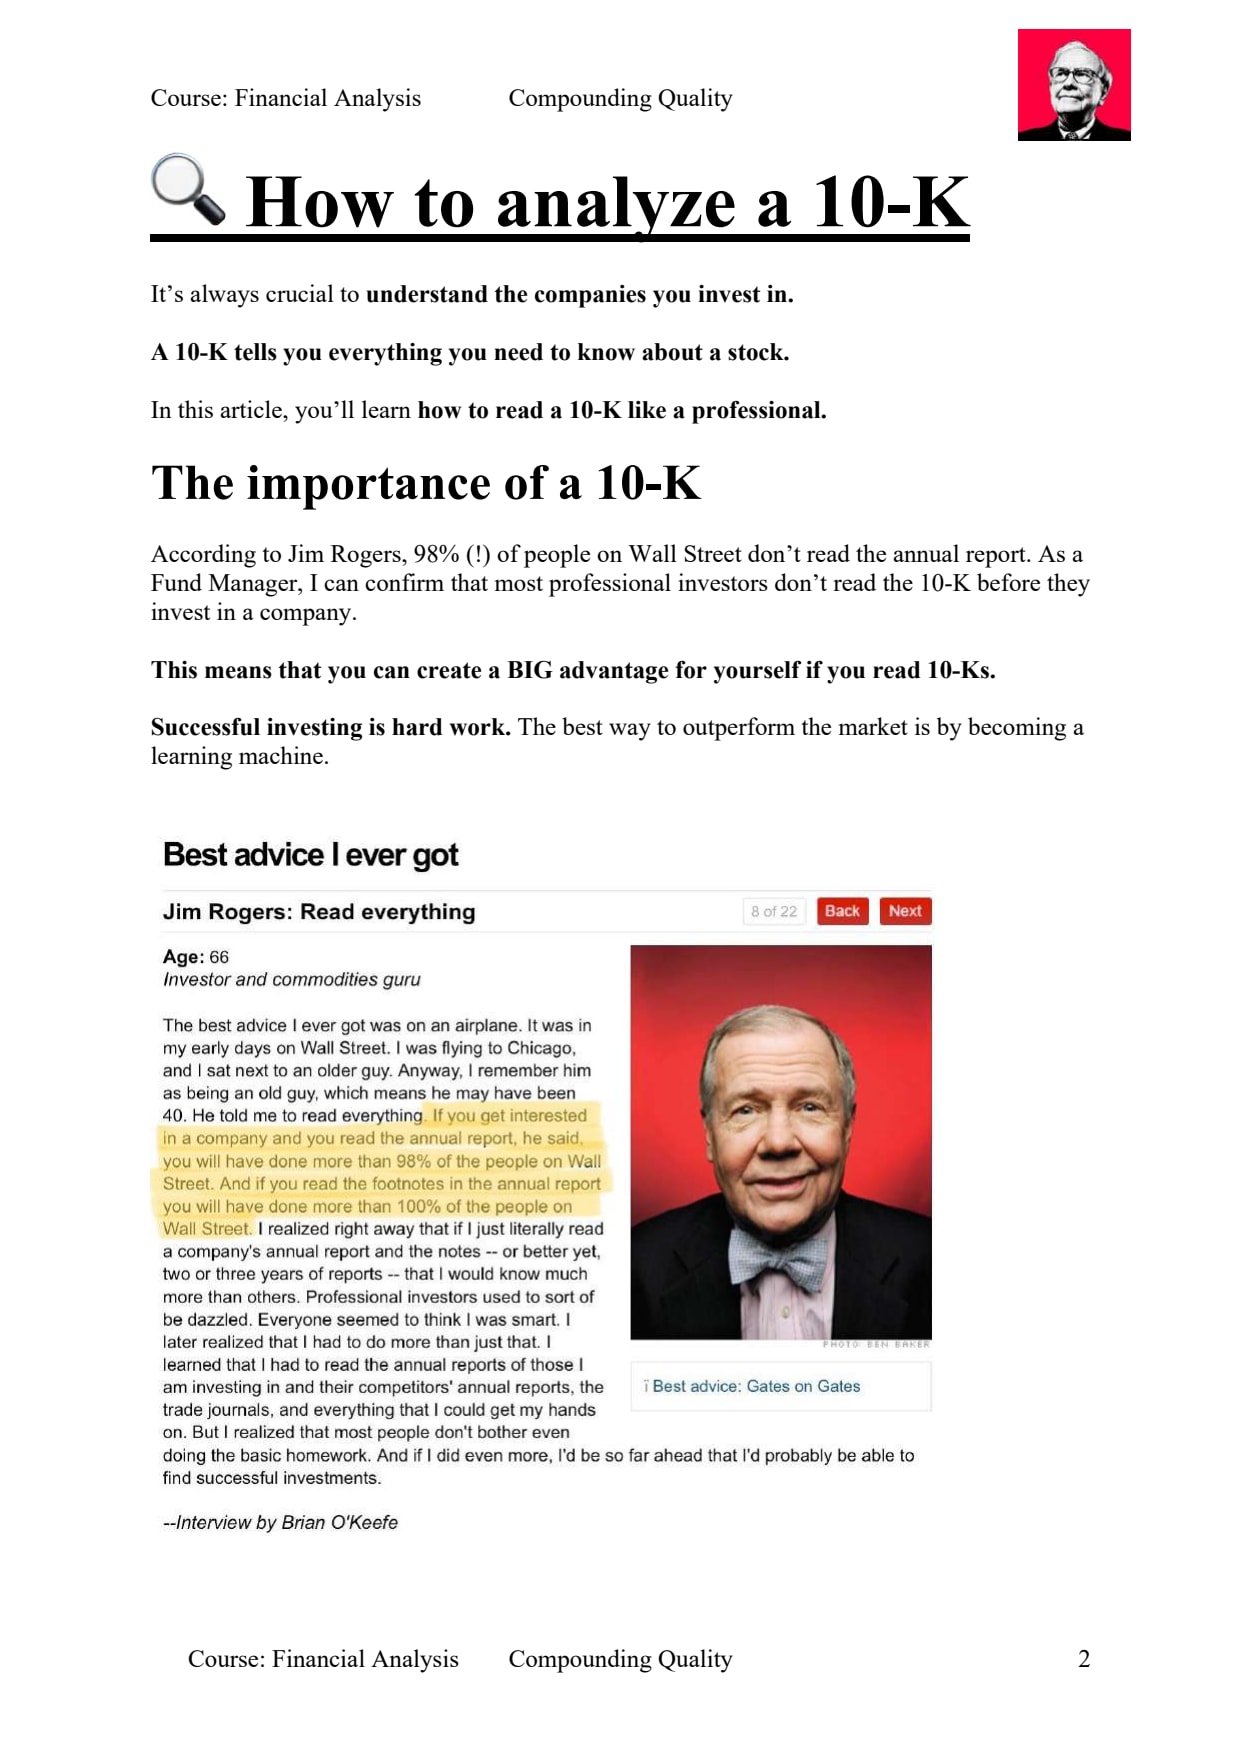 ZVENIA Mining .17/01/2024
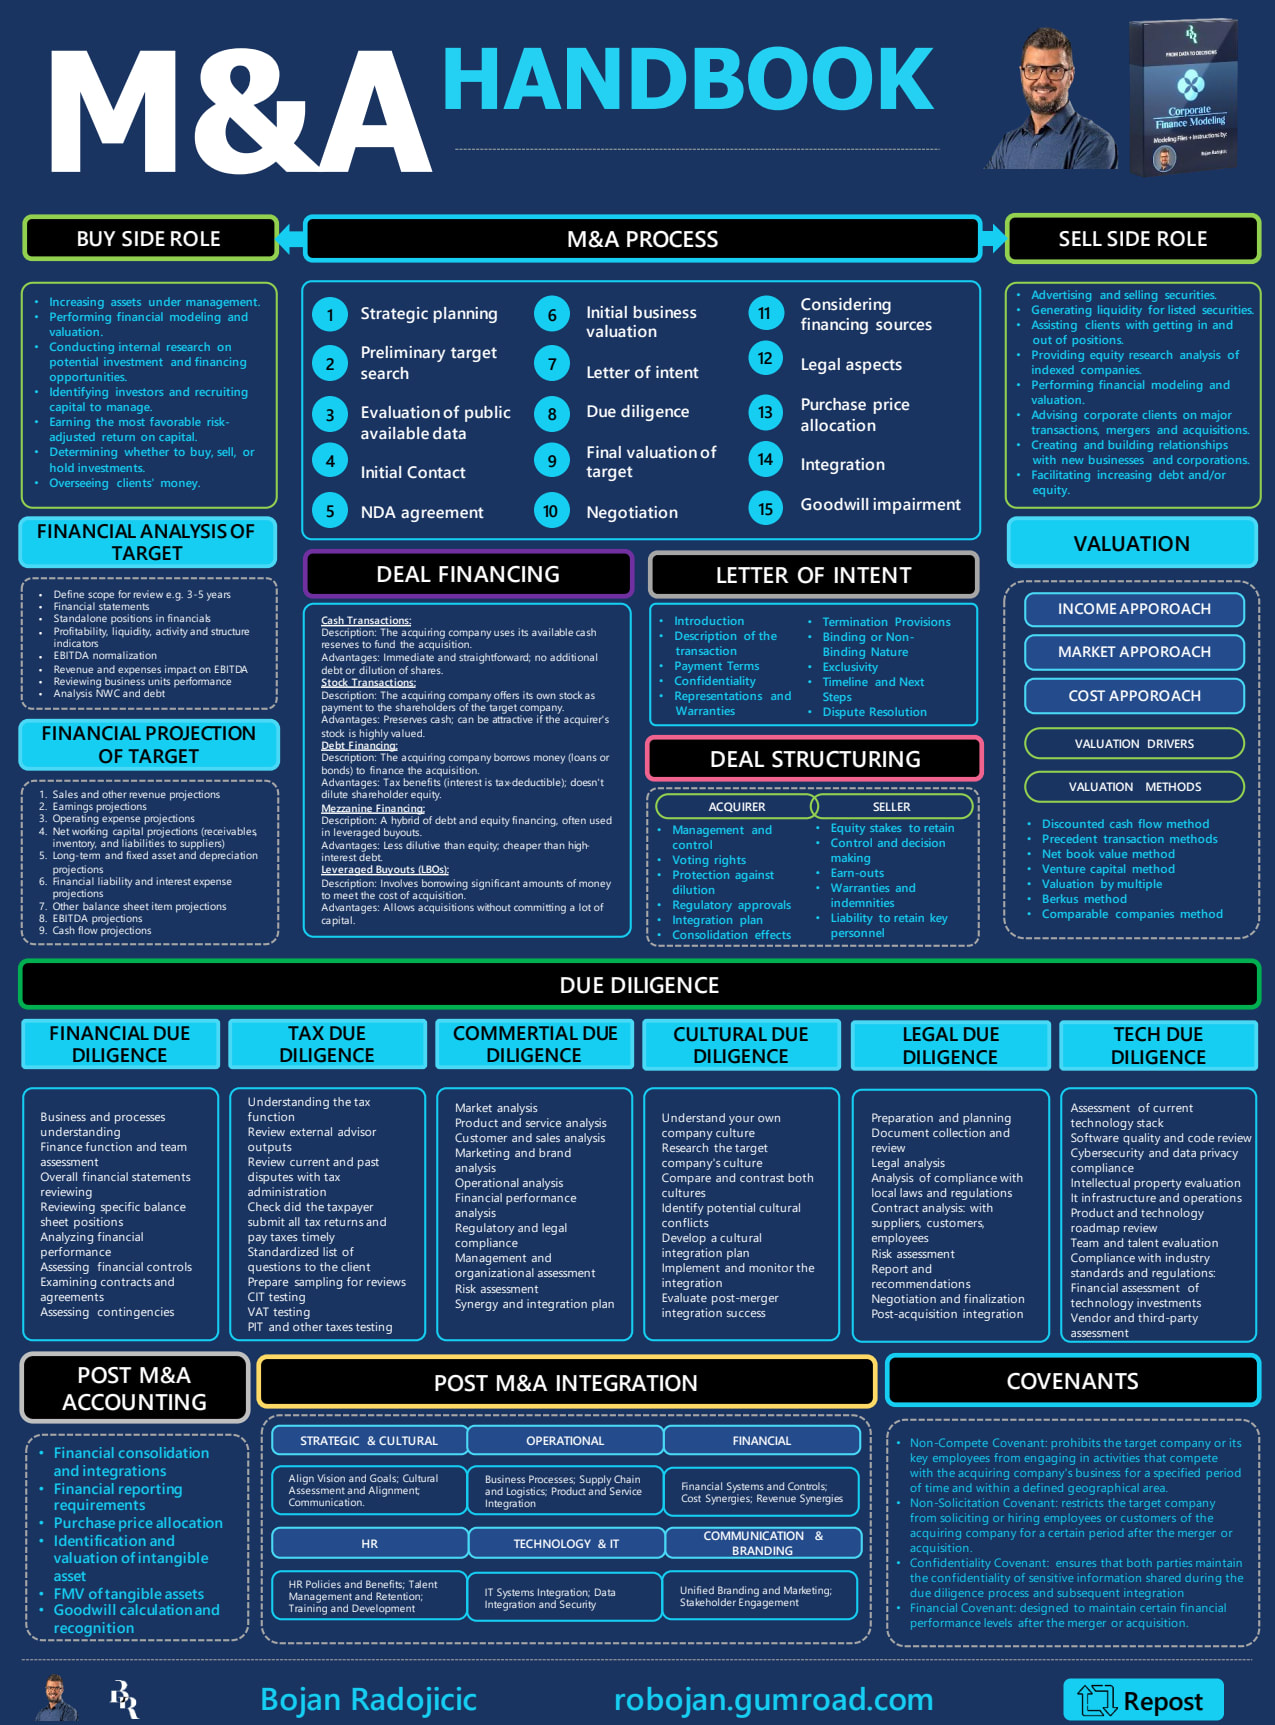
Mega M&A Bundle
Includes:
→M&A Handbook
→Due Diligence Types
→M&A Deal Buy Side Roadmap
→Private Equity Vs Venture Capital
→Financial Due Diligence Checklist
→Financial Due Diligence Process
→ABCs of M&A
→M&A Buy-side VS Sell-side
→Unwritten M&A Model
→Proof of cash modelSource: Corporate Finance Learning®, LinkedIn
 ZVENIA Mining .17/01/2024
The wrong rate could cancel your project.
1// Risk vs. Reward:
➡️ Understand that a higher discount rate suggests higher risk, reducing NPV and IRR.
➡️ Tailor the rate to the project’s unique risk profile.2// Strategic Perspective:
➡️ Prioritize long-term strategic benefits that may warrant accepting a lower NPV.
➡️ Look beyond immediate financial returns.3// Accurate Cash Flows:
➡️ Present realistic cash flow projections.
➡️ Clear and credible forecasts can mitigate the effects of a higher discount rate.4// Cost of Capital:
➡️ Ensure the discount rate reflects your company’s actual cost of capital.
➡️ Overstated rates can unfairly disadvantage good projects.5// Opportunity Cost:
➡️ Consider what might be lost by not pursuing the project.
➡️ Sometimes, the benefits outweigh the risks suggested by a high discount rate.6// Sensitivity Analysis:
➡️ Use this tool to show how various discount rates affect project viability.
➡️ Demonstrating robustness under different scenarios.7// Risk-Adjusted Phases:
➡️ Propose varying discount rates for different project stages.
➡️ Align rates with the varying risk levels of each phase.8// Historical Data Utilization:
➡️ Leverage past project data to argue for a realistic rate.
➡️ Especially relevant when previous projects have shown success.9// Non-Financial Value:
➡️ Account for intangible benefits like brand enhancement or sustainability impacts.
➡️ These benefits don’t directly figure into NPV calculations but are valuable.10// Flexible Rate Review:
➡️ Advocate for periodic reassessments of the discount rate.
➡️ Adjust as the project advances and uncertainties diminish.Credits to Oana Labes, MBA, CPA ZVENIA Mining .17/01/2024
Here’s a simple way to understand this confusing finance term.
Working capital — aka Net Working Capital — is the difference between a company’s current assets (expected to be used/consumed/converted into cash <1 year) and current liabilities (debts that are expected to be paid off in <1 year).
Why is working capital important?
Working Capital is a quick way to assess a company's liquidity, which is its ability to meet its short-term obligations.
It serves as an indicator of a company's financial health.
If working capital is positive, it indicates that a company has sufficient resources to cover its short-term financial needs.
If working capital is negative, it indicates that a company may face financial difficulties.
There are three ways to calculate working capital:
THE SIMPLE METHOD
Current Assets – Current Liabilities
This is the most common method and easiest to calculate.
THE NARROW METHOD
(Current Assets – Cash) – (Current Liabilities – Debt)
This method excludes cash & debt, which can be useful for comparing companies with different capital structures.
THE SPECIFIC METHOD:
Accounts Receivable + Inventory – Accounts Payable:
This method focuses on the cash conversion cycle of a business, which is the time it takes to convert inventory into cash.
Credits to Brian Feroldi ZVENIA Mining .22/12/2023
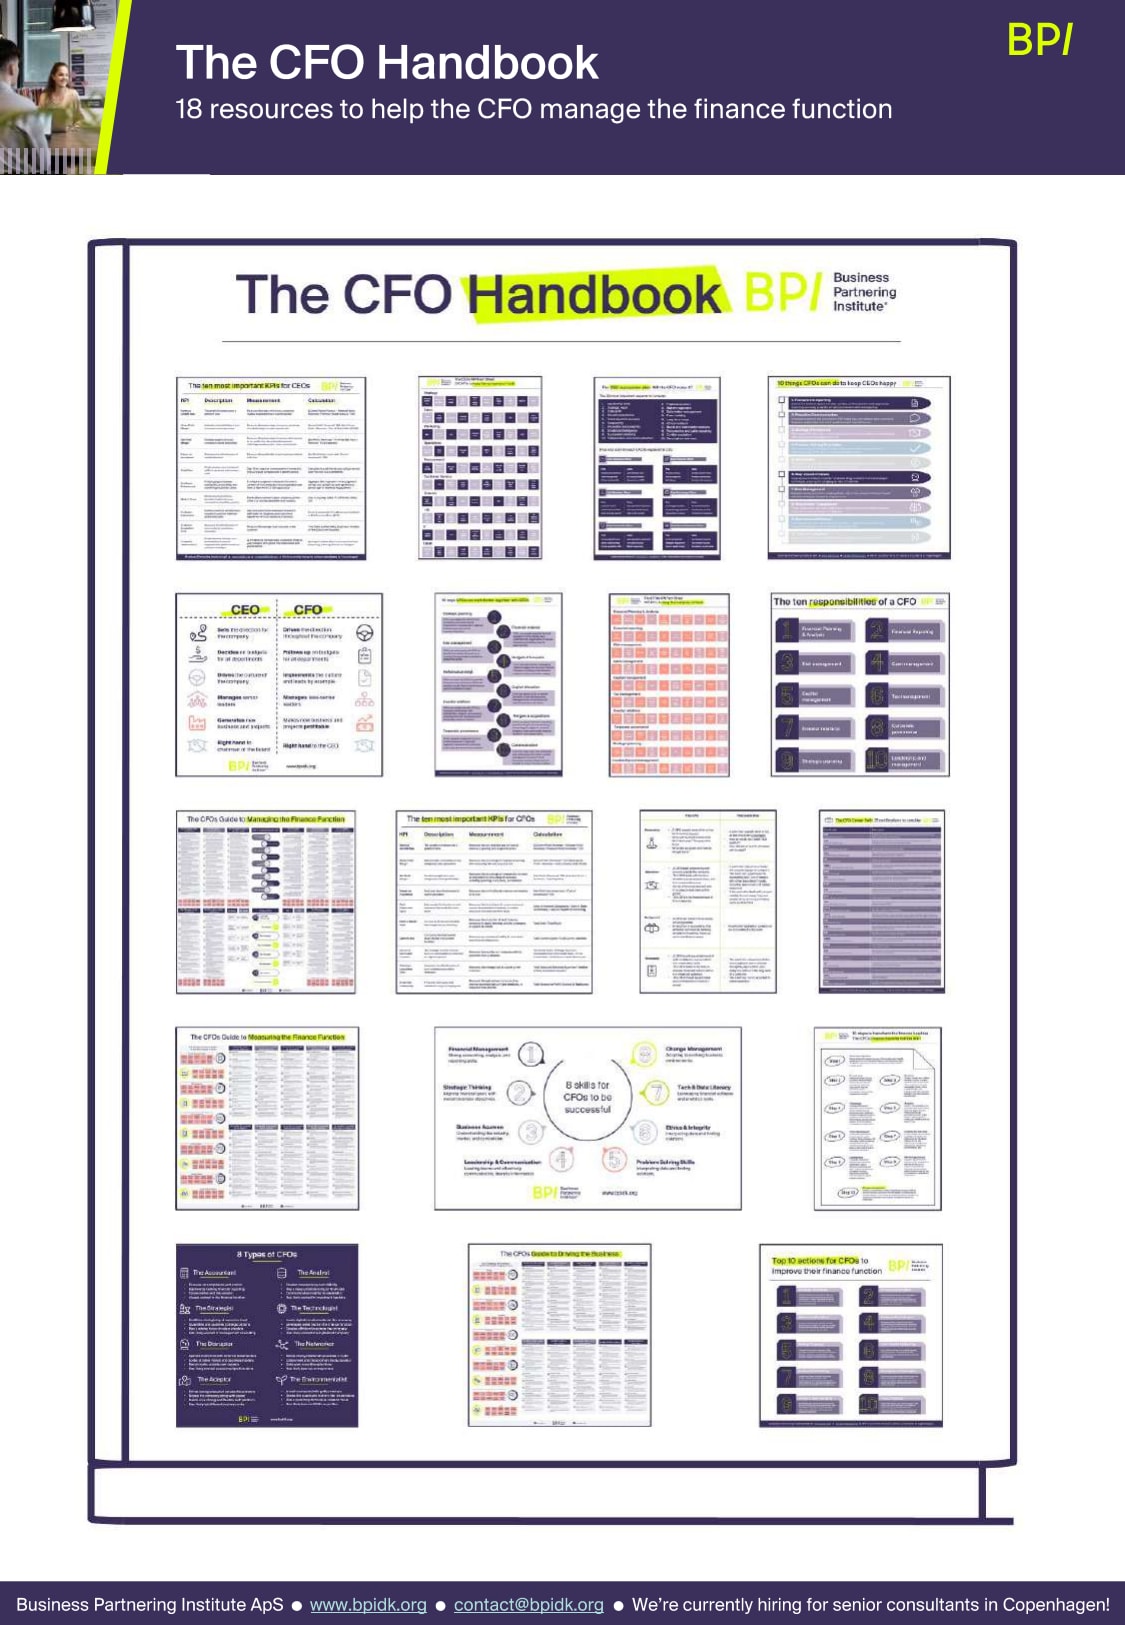
CFOs are today’s corporate superheroes.
Tasked with doing so much and granted so few resources.
It’s a challenge for the ages.
To help them with this challenge we’ve drafted “The CFO Handbook”.
18 resources to help CFOs excel and ultimately become CEOs.
Here’s a list of the resources you’ll get…
1. The ten responsibilities of a CFO
2. Eight skills to be successful as a CFO
3. The ten most important KPIs for CFOs
4. The CFO’s KPI Fact Sheet
5. The CFO’s Guide to Managing the Finance Function
6. The CFO’s Guide to Measuring the Finance Function
7. The CFO career path
8. CFO vs. Controller
9. Eight types of CFOs
10. Ten actions for CFOs to improve the finance function
11. The CFO’s Finance Transformation Plan
12. The CFO’s Guide to Driving the Business
13. CEO vs. CFO
14. The ten most important KPIs for CEOs
15. The CEO’s KPI Fact Sheet
16. Ten things CFOs can do to keep CEOs happy
17. Ten ways CEOs and CFOs can work better together
18. The CEO succession planWhat’s even more daunting is that the list of responsibilities extends way beyond this!
– ESG
– Cybersecurity
– War for talent
– Strategy
…It’s not easy being a CFO in today’s world but with this handbook, it just got a little bit easier.
What do you think a handbook for CFOs should cover?
Do you find this handbook particularly useful?
This handbook is a 15$ value and is offered to you one time for free so don’t forget to grab your copy!
Source: Anders Liu-Lindberg, LinkedIn
 ZVENIA Mining .18/12/2023
🔍 Purpose:
Budgeting is about setting financial targets and creating a plan to achieve them. It’s a roadmap for your business’s financial journey.
Forecasting, on the other hand, is about predicting financial outcomes based on current trends and data. It’s like a weather forecast for your business’s financial health.
⏳ Time Horizon:
Budgets are typically set for a specific period, usually a fiscal year.
Forecasts are more flexible, often updated monthly or quarterly to reflect the latest data.
🔄 Flexibility:
Budgeting is relatively static, a set plan you aim to follow.
Forecasting is dynamic, constantly adapting to new information and market trends.
📊 Metrics and Evaluation:
Budgeting focuses on variance analysis, comparing actual results to the budget.
Forecasting evaluates trend accuracy, how well predictions match reality over time.
🛠️ Tools and Data:
Budgeting relies on historical data and established goals.
Forecasting uses statistical tools and models, incorporating real-time data for accuracy.
🤔 Decision Making:
Budgets guide spending and investment decisions.
Forecasts inform strategic planning, highlighting potential opportunities or risks.
🔮 Risk Management:
Budgeting controls expenditure, reducing financial risks.
Forecasting identifies future risks and uncertainties, allowing proactive measures.
🤝 Collaboration:
Both require collaboration across departments for accurate and effective implementation.
Are you ready to master your financial strategy? Let’s connect and discuss how budgeting and forecasting can fuel your business’s success. Share your thoughts below or drop a message!
Source : Tejas Parikh (ACMA, MBA), LinkedIn
Tejas Parikh (ACMA, MBA), LinkedIn ZVENIA Mining .13/11/2023
Cause of Change
What causes the change from the revenue to EBITDA to Net Profit?Observing the movement on the chart below will help you understand the cause of change.
Below are the explanations and calculations for each step depicted on the chart:
Revenue
• Revenue, also known as sales or turnover, is the total amount of money a company generates from its primary business activities.COGS
• COGS refers to the direct costs associated with producing or manufacturing the goods or services that a company sells.Gross Profit
• Gross Profit is the amount of money a company has left after subtracting the direct costs of producing its goods or services (COGS) from its total revenue.
• GP = Revenue – GOGSOPEX
• OPEX are a company’s ongoing costs to operate its business. Include items such as rent, utilities, salaries, and marketing expenses.Other Income
• Other Income refers to revenue generated by a company that is not directly related to its core business operations. This can include income from investments, interest, or other sources outside the company’s primary activities.EBITDA (Earnings Before Interest, Taxes, Depreciation, and Amortization)
• EBITDA is a measure of a company’s operating performance. It excludes interest, taxes, and non-cash expenses like depreciation and amortization.
• EBITDA = GP – OPEX + Other IncomeEBIT (Earnings Before Interest & Taxes)
• Depreciation and amortization are non-cash expenses that represent the allocation of the cost of tangible and intangible assets over time.
• EBIT = EBITDA – DepreciationEBT (Earnings Before Taxes)
• Interest expenses represent the cost of borrowed funds. Subtract interest from the Adjusted EBITDA.
• EBT = EBIT – Interest ExpenseNet Profit
• Subtract taxes from Earnings Before Taxes to arrive at Net Profit.
• Net Profit = Earnings Before Taxes – TaxesFuente: Abdul Khaliq, LinkedIn
 ZVENIA Mining .16/10/2023
Hard commodities had a roller coaster year in 2022.
While prices for some commodities stabilized after skyrocketing on the heels of the pandemic, others delivered stellar returns. Behind the volatility was a plethora of factors, including the Russia-Ukraine war, the global economic slump, and a drop in China’s demand for materials.
This chart uses price data from TradingEconomics to highlight the 10 best and worst performing hard commodities of 2022. It excludes soft commodities like agricultural products and meat.
Energy Crisis Sets Coal on Fire
The global economic rebound of 2021, which set the fastest post-recession growth pace in the last 80 years, sparked coal prices as energy demand increased. Russia’s invasion of Ukraine ignited the spark, with coal prices exploding 157% in 2022.Consequently, coal was the best performing commodity in 2022, far outperforming the other nine top commodities by returns.
Rank Commodity 2022 Returns
#1 Coal 157%
#2 Lithium 87%
#3 Nickel 43%
#4 Titanium 27%
#5 Heating oil 21%
#6 Uranium 12%
#7 Platinum 9%
#8 Molybdenum 4%
#9 Iron ore 1%
#10 Gold 1%
Lithium (carbonate) and nickel prices continue to be supercharged by the demand for EVs and batteries. Since the beginning of 2021, lithium prices have increased 11-fold, and remain elevated at more than $70,000 per tonne.As a result of high prices for lithium, nickel, and other battery metals, the average cost of lithium-ion battery packs increased in 2022, for the first time since 2010. Battery pack prices are expected to increase in 2023 as well, before falling in 2024.
The year was also positive for uranium as countries revived their nuclear power plans to combat the energy crunch. Notably, Germany extended the lifetime of three plants that were set to shut down in 2022, and Japan announced accelerated restarts for several idle reactors.
The 10 Biggest Commodity Drawdowns
The negative returns for most commodities can be largely attributed to prices stabilizing at lower levels after bullish runs in 2021 and the beginning of 2022.Rank Commodity 2022 Returns
#1 Magnesium -54%
#2 Tin -37%
#3 Propane -37%
#4 Rubber -26%
#5 Cobalt -26%
#6 Natural Gas TTF -20%
#7 Naphtha -19%
#8 Zinc -18%
#9 Copper -16%
#10 Aluminum -16%For example, magnesium prices more than halved in 2022, declining from an all-time high in September 2021. Similarly, tin prices also normalized after rising due to unprecedented demand from the electronics sector during the economic rebound from the pandemic.
Source: https://elements.visualcapitalist.com/the-top-10-best-and-worst-performing-commodities-of-2022/
 ZVENIA Mining .13/10/2023
TOP SIGNS 📉
1. Large Number of IPO
2. Rapidly Rising Prices
3. High Merger & Acquisition Activity
4. Easy Availability of Credit
5. Optimistic Covers of Newspapers & Magazines
6. Higher Than Average Trading Volumes
7. Historically High Valuation Multiples
8. Art & Luxury Markets Booming
9. Financial Media Viewership Soars
10. “This Time is Different” Declared
11. Amateur Investors Move To Equities Asset Class
12. Speculative Assets Prices Spike
13. Record Venture Capital FundingBOTTOM SIGNS 📈
1. No Mergers and Acquisitions
2. No IPOs
3. Low Venture Capital Funding
4. Historically Low Price/E & EV/EBITDA Multiples
5. Many Companies Trading Below Book Value
6. Speculate Asset Prices Down Huge
7. Central Banks Easing for 6+ Months
8. Recession Officially Declared
9. Previously Favorite Sectors are Hated
10. Credit Only Available to High-Quality Borrowers
11. Amateur Investors are Filled with Caution
12. Negative Covers of Newspapers and Magazines
13. Negative and Depressed Consumer SentimentDo you see more top or bottom signs right now?
Source : Brian Feroldi, LinkedIn
ZVENIA Mining .11/10/2023Economic and Investing Principles Cheat Sheet
Every Finance Formula you’ll ever need in 1 PDF:
🎯Time Value of Money
🎯 Discounted Cash Flow
🎯Profitability Concepts
🎯Common Probability Distributions
🎯Sampling and Estimation
🎯Technical Analysis
🎯Demand and Supply Analysis
🎯Aggregate Output, Prices and Economic Growth
🎯Understand Business Cycles
🎯Currency Exchange Rates
🎯Financial Statement Analysis
🎯Understanding Cash Flow Statements
🎯Financial Analysis Techniques
🎯Inventories
🎯Long Lived Assets
🎯Income Taxes
🎯Capital Budgeting
🎯Cost of Capital
🎯Measures of Leverage
🎯Dividends and Share Repurchase Basics
🎯Working Capital Management
🎯Portfolio Risk and Return
🎯Market Organization and Structure
🎯Security Market Indices
🎯Equity Valuation
🎯Fixed Income Valuation
🎯Fixed Income Risk and ReturnSource:
https://www.icicidirect.com/idirectcontent/FinancialEducation/StaticData/ICFLCFABooklet.pdf
Chris Quinn, LinkedIn ZVENIA Mining .05/10/2023
Gold and silver have been precious and monetary metals for millennia, with the gold-to-silver ratio having been measured since the days of Ancient Rome.
Historically, the ratio between gold and silver played an important role in ensuring coins had their appropriate value, and it remains an important technical metric for metals investors today.
This graphic charts 200 years of the gold-to-silver ratio, plotting the pivotal historical events that have shaped its peaks and valleys.
What is the Gold-to-Silver Ratio?
The gold-to-silver ratio represents the amount of silver ounces equivalent to a single ounce of gold, enabling us to see if one of the two precious metals is particularly under or overvalued.Currently, the ratio sits at about 80 ounces of silver equivalent to one ounce of gold. This is after the ratio spiked to new highs of 123.3 during the COVID-19 pandemic.
While gold is primarily viewed as an inflation and recession hedge, silver is also an industrial metal and asset. The ratio between the two can reveal whether industrial metals demand is on the rise or if an economic slowdown or recession may be looming.
The History of the Gold-to-Silver Ratio
Long before the gold-to-silver ratio was allowed to float freely, the ratio between these two metals was fixed by empires and governments to control the value of their currency and coinage.The earliest recorded instance of the gold-to-silver ratio dates back to 3200 BCE, when Menes, the first king of Ancient Egypt set a ratio of 2.5:1. Since then, the ratio has only seen gold’s value rise as empires and governments became more familiar with the scarcity and difficulty of production for the two metals.
Gold and Silver’s Ancient Beginnings
Ancient Rome was one of the earliest ancient civilizations to set a gold-to-silver ratio, starting as low as 8:1 in 210 BCE. Over the decades, varying gold and silver inflows from Rome’s conquests caused the ratio to fluctuate between 8-12 ounces of silver for every ounce of gold.By 46 BCE, Julius Caesar had established a standard gold-to-silver ratio of 11.5:1, shortly before it was bumped to 11.75:1 under emperor Augustus.
As centuries progressed, ratios around the world fluctuated between 6-12 ounces of silver for every ounce of gold, with many Middle Eastern and Asian empires and nations often valuing silver more highly than Western counterparts, thus having a lower ratio.
Source: https://elements.visualcapitalist.com/charting-the-gold-to-silver-ratio-over-200-years/

 Maria Vallejo Garcia02/10/2023
It is indisputable, LATAM is called to be the superpowerful group of nations that will provide the mineral resources needed for the #greentransformation. LATAM possesses 69% of the world’s #Molybdenum resources, 53% of the world’s #Lithium resources, 40% of the #Nickel, and 36% of the #Cobalt in the world. If you are not looking at LATAM for investment and growth you are already too late. LATAM is one of the fastest-growing economies of the developing world with a capacity for early technology adaptation. More companies and individuals are turning to do business in Latin America. and the companies currently operating in Latin America are now able to make national or international payments, obtain loans, and many other financial needs through faster and simpler processes.
https://www.economist.com/the-americas/2023/08/08/latin-america-could-become-this-centurys-commodity-superpower
 ZVENIA Mining .02/10/2023
Today we had on the show Jonathan Fisher, CEO of Cauldron Energy, to chat through what the stance on uranium mining and nuclear power generation currently looks like in Australia.
Jonathan shared his thoughts on various commonly cited critiques of why nuclear isn’t viable as a fossil fuel free energy source, as well as what would have to change for mining to commence and the flow on effects of that.
Source : Money of Mine, YouTube
ZVENIA Mining .01/10/2023Financial Abbreviations at glance. Why you need this:
⛏ 𝗘𝗳𝗳𝗶𝗰𝗶𝗲𝗻𝗰𝘆 – Speed up conversations and reading.
⛏ 𝗣𝗿𝗼𝗳𝗲𝘀𝘀𝗶𝗼𝗻𝗮𝗹𝗶𝘁𝘆 – Showcase industry expertise.
⛏ 𝗖𝗹𝗮𝗿𝗶𝘁𝘆 – Avoid misinterpretations.
⛏ 𝗡𝗲𝘁𝘄𝗼𝗿𝗸𝗶𝗻𝗴 – Engage with peers effortlessly.
⛏ 𝗖𝗼𝗻𝗳𝗶𝗱𝗲𝗻𝗰𝗲 – Navigate financial documents with ease.
⛏ 𝗦𝘁𝗮𝘆 𝗨𝗽𝗱𝗮𝘁𝗲𝗱 – Keep pace with evolving financial lingo.📈 Knowing your financial abbreviations isn’t just about jargon – it’s about effective and informed communication in the finance world!
Source: Bojan Radojicic, LinkedIn
 ZVENIA Mining .15/08/2023
✅ La inflación es la tasa a la que aumentan los precios de los bienes y servicios en una economía. Se refiere a la disminución del poder adquisitivo de una determinada moneda.
▶ La inflación ocurre en todos los sectores, desde la vivienda y los alimentos hasta la atención médica, el transporte, etc. Pero la inflación que estamos discutiendo aquí ocurre cuando afecta los bienes y servicios en todas las industrias.
▶ Crear transparencia para el riesgo y la priorización es clave para un programa efectivo de protección contra la inflación. Los departamentos de Compras y Procura deben dar este primer paso para comprender las posibles vulnerabilidades.⚠ Deben enfocar las acciones en las categorías que impulsan el mayor riesgo de inflación para la empresa, categorías con gasto significativo en las que:
✳ Los precios están vinculados a los índices de materias primas
✳ Los productos tienen un alto valor comercial y/o es probable que enfrenten solicitudes de aumentos de precios por parte de los proveedores en el corto plazo
✳ Los aumentos de precios no se pueden traspasar fácilmente a los clientes
✳ Una vez que se han identificado las categorías prioritarias, las organizaciones de adquisiciones pueden tomar decisiones informadas y específicas sobre qué estrategias implementar en las categorías de enfoque✴ Las estrategias para protegerse contra la inflación se dividen en tres áreas:
✔ Gestión de Contratos
Si bien la transparencia de los contratos es clave para construir un plan sólido, el enfoque de la contratación también es un método de mitigación en sí mismo.✔ Estrategia de abastecimiento y colaboración de proveedores
Las formulaciones y especificaciones de los productos se pueden ajustar para tener en cuenta las diferencias esperadas en los precios de los insumos.
La colaboración con los proveedores puede revelar oportunidades para reducir costos y compensar aumentos mutuamente.✔ Coberturas financieras
La compra de contratos que fijan o limitan el precio de una materia prima, si existen mercados líquidos (futuros, forwards, opciones), también puede ser eficaz. Esta estrategia debe usarse cuando otras formas de cobertura no sean posibles dado el costo asociadoCuál aplicar depende del contexto específico del negocio y de la relación con el proveedor. Algunos también tienen un costo y, por lo tanto, deben considerarse cuidadosamente
Source: Penélope Rojas, LinkedIn
www.visualcapitalist.com/mapped-2023-inflation-forecasts-by-country/
Advisor Channel ZVENIA Mining .06/08/2023
1⃣ Return on Equity (ROE)
Measures the profitability of a company by calculating how much profit it generates for each dollar of shareholder’s equity.2⃣ Return on Assets (ROA)
Measures how efficiently a company is using its assets to generate profit. Tells you how much profit company is generating for each $ of its assets.3⃣ Gross Profit Margin (GPM)
Measures how much money a company makes from its sales after deducting the cost of goods sold.4⃣ Net Profit Margin
Measures how much money a company makes from its sales after deducting all of its expenses, including taxes and interest.5⃣ Debt to Equity Ratio (D/E)
Measures the amount of debt a company has relative to its equity. It is calculated by dividing the total debt by the total equity.6⃣ Working Capital Ratio
Measures a company’s ability to meet its short-term financial obligations. It is calculated by dividing current assets by current liabilities.7⃣ Accounts Receivable Turnover Ratio
Measures how quickly a company collects its money from its customers.8⃣ Accounts Payable Turnover Ratio
Measures how quickly a company pays its suppliers.9⃣ Inventory Turnover Ratio
Measures how quickly a company sells its inventory and replaces it with new inventory over a certain period of time.🔟 Fixed Assets Turnover Ratio
Measures how efficiently a company is using its fixed assets (such as property, plant, and equipment) to generate revenue.Source: Asif Masani
Link to download: https://fpnaprofessionals.teachable.com/p/my-downloadable-142081 ZVENIA Mining .01/08/2023
The internet is full of investing resources.
If you know how to use them well, it can be a gold mine.1. Morningstar
Morningstar is an American financial services firm. It provides an array of investment research and investment management services.
You can take a look at a company’s financials, valuation, operating performance, dividend, ownership and much more.2. Dataroma
Via Dataroma, you can track the portfolios of the best investors in the world. Think about Warren Buffett, Chuck Akre, Terry Smith and Howard Marks.
You can also take a look at which stocks are bought the most by these superinvestors, which insiders are buying their own stock, and so on.3. Yahoo Finance
Yahoo Finance provides you with financial news, data and commentary including stock quotes, press releases, financial reports, and original content.
It’s a great website to check daily stock news or create a watchlist.4. Seeking Alpha
If you are looking for stock analysis, Seeking Alpha is the place to be.
You can follow the stocks you want and you’ll receive an email each time someone publishes an article about the companies you’re interested in.5. The SEC website
The SEC website gives you access to the full text of SEC filings since 2001.
Everything that a company has filed over the past few years can be found on this website.6. ROIC.ai
Via ROIC.ai you can find more than 30 years of financial data for free. ROIC.ai covers more than 37.000 companies.
It’s a great way to look at the evolution of the financials of a company.7. The company’s website
The best way to start analyzing a stock is by going to the company’s ‘Investor Relations’ section on their website.
Via this section, you can download it’s annual reports, investor presentations, and much more.8. Stratosphere
Stratosphere offers you a platform where you can take a look at the financials of a company, visualize data, and screen for stocks which match certain criteria.9. Investopedia
If you want to learn about a certain investment topic, Investopedia is the place to be.
It features articles, tutorials, videos, and other content designed to help individuals make informed financial decisions.10. Quartr App
The Quatr App is a financial research and investor relations platform.
This app makes it easy for you to listen to conference calls and take a look at the Investor Presentation of a company.Source: Chris Quinn, LinkedIn
 ZVENIA Mining .29/07/2023
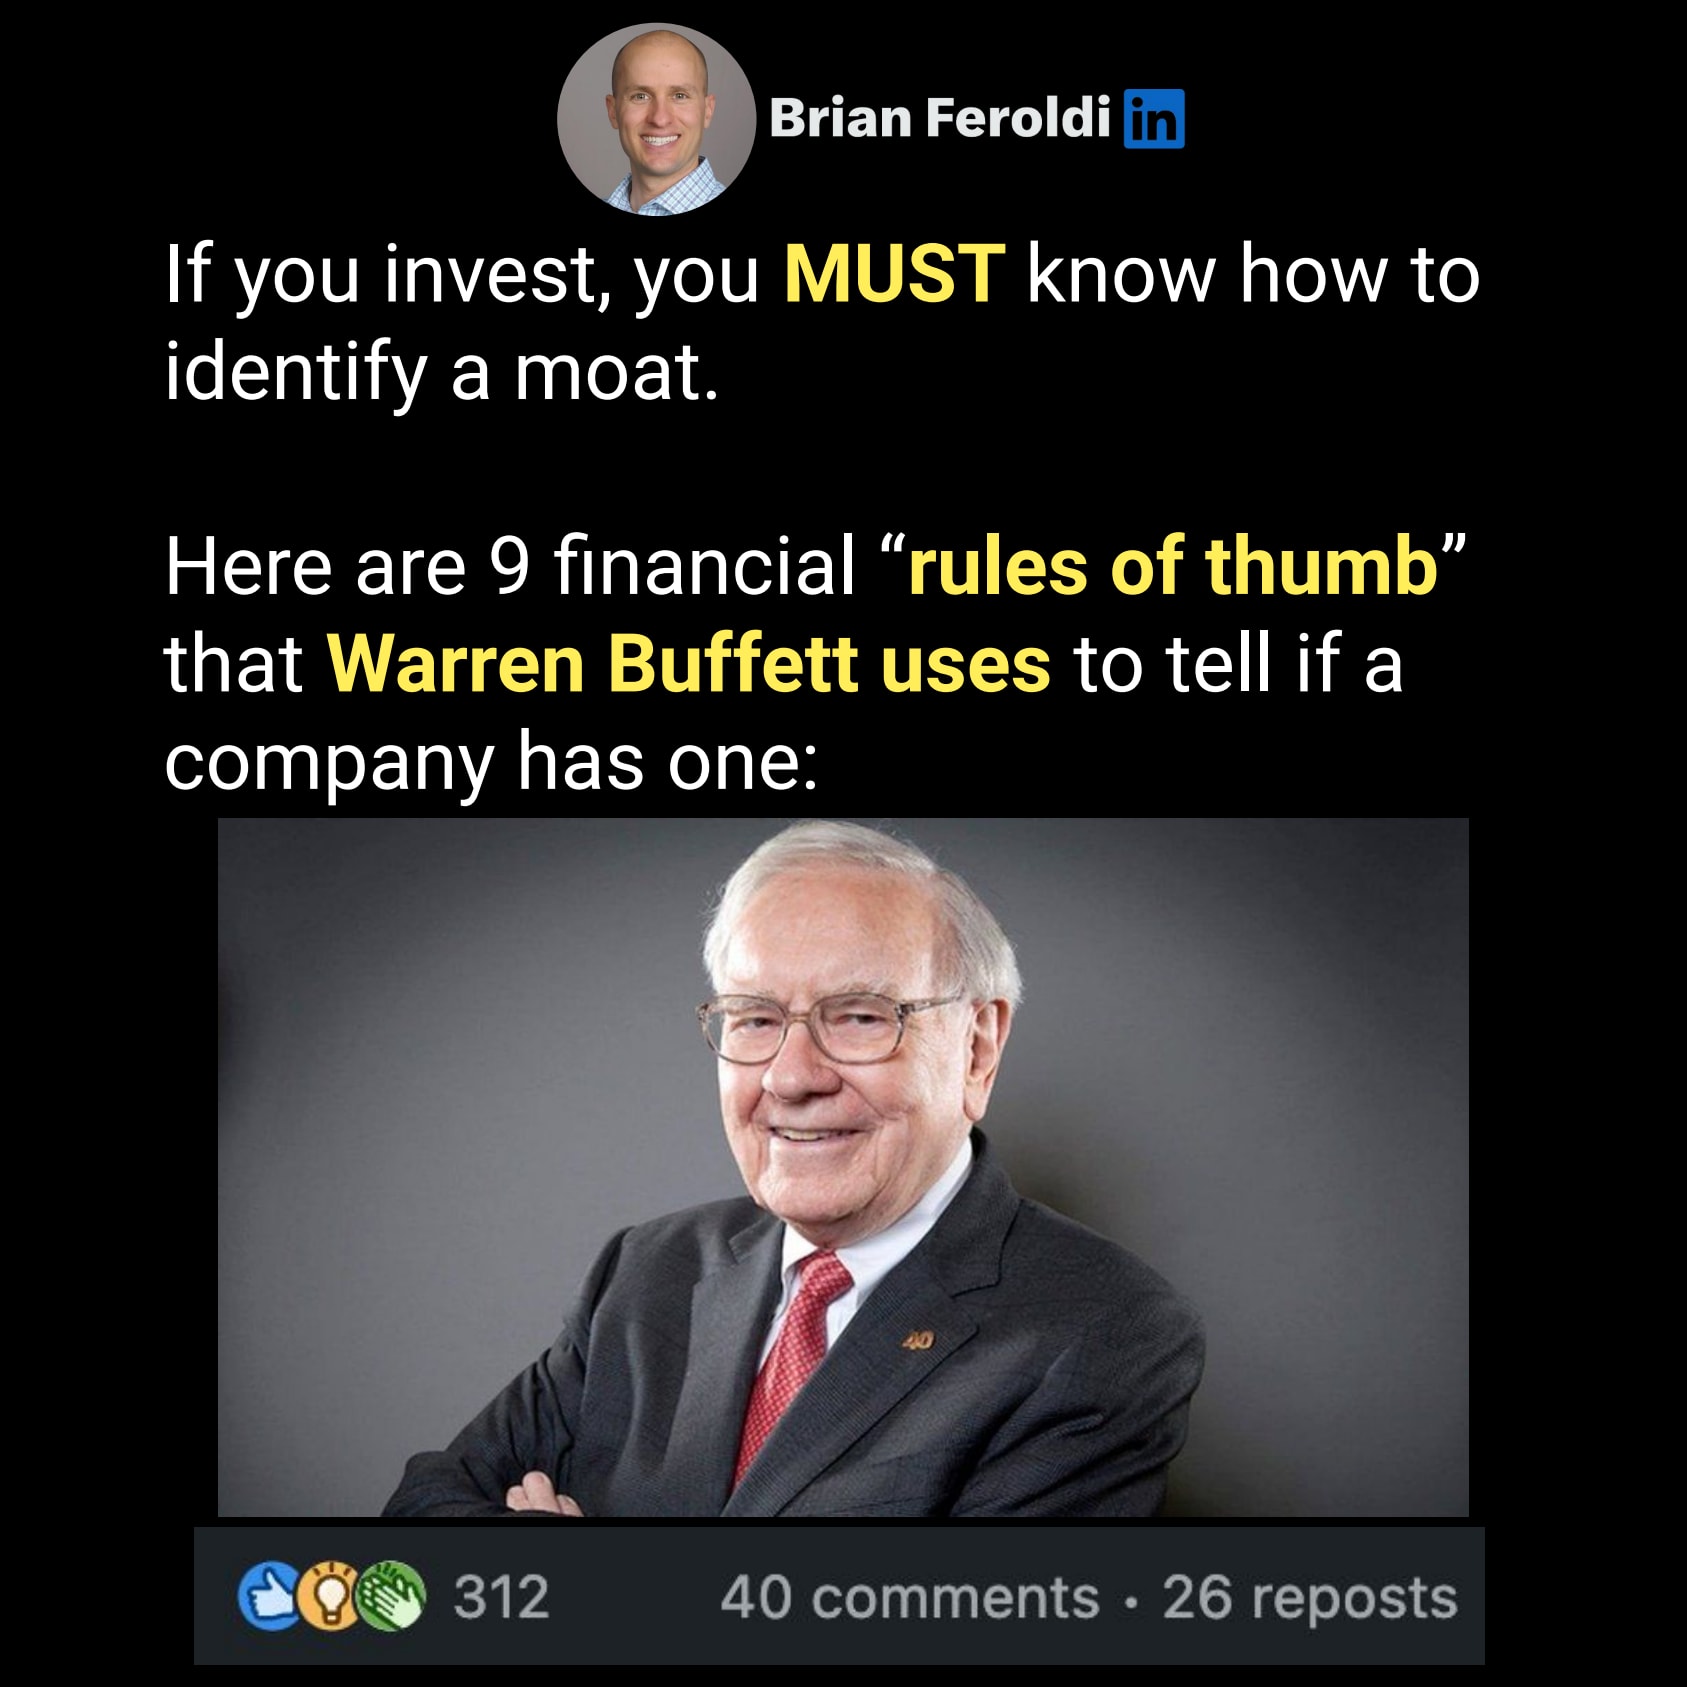
Here are 9 financial “rules of thumb” that Warren Buffett uses to tell if a company has one:
1: Gross Margin
Formula: Gross Profit / Revenue
Moat: Consistently above 40%
No Moat: Under 40% & volatile2: Sales, General, and Administrative Expenses
Formula: SG&A / Gross Profit
Moat: Consistently under 30%
No Moat: Over 80% & volatile3: Depreciation Expense
Formula: Depreciation / Gross Profit
Moat: Consistently under 10%
No Moat: Volatility & high4: Interest Expense
Formula: Interest Expense / Operating Income
Moat: Consistently under 15%
No Moat: Over 50% & volatile5: Income Tax Expense
Formula: Income Tax Paid / Pre-tax Income (Earnings Before Tax)
Moat: Consistently pays the full amount (~21% in U.S.)
No Moat: Negative, erratic6: Profit Margin (Net Margin)
Formula: Net Income / Revenue
Moat: Consistently above 20%
No Moat: Below 10%, negative, and volatile7: Capital Expenditures
Formula: Capital Expenditures / Net Income
Moat: Consistently under 25%
No Moat: Consistently above 75%8: Total Liabilities to Adjusted Shareholder Equity
Formula: Total Liabilities / Shareholder Equity
Moat: Below 0.80
No Moat: Over 2.009: Return on Shareholders’ Equity
Formula: Net Income / Shareholder Equity
Moat: Consistently above 15%
No Moat: Below 10%, negative, or volatile3 Important notes:
a) These “rules of thumb” are only useful when a company is fully optimized for profits (phases 4 & 5).B) CONSISTENCY is key
The real test is if a company generates good numbers over multiple years & various economic cyclesC) There are PLENTY of exceptions & nuances to these rules
Many of Buffett’s largest holdings do not pass every rule of thumb.
That’s because investing & accounting have TONS of nuances.Source: Brian Feroldi, LinkedIn
 Abdul Khaliq28/07/2023
Everything you need to begin implementing, monitoring, and enhancing internal controls.
Here’s what is included in the cheat sheet:
✔ Internal Control Culture (Top-Down Approach)
✔ 20 Essential Internal Controls
✔ 20 Internal Control KPIs
✔ 10 Steps to Implementing Internal Controls
✔ Responsibility Hierarchy
✔ 14 Balance Sheet Controls
✔ 10 EBITA Controls
✔ 14 ERP Controls
✔ 10 Built-In Excel Controls
✔ 10 Accounts Payable Internal Controls
✔ 10 Accounts Receivable Internal ControlsSource: Abdul Khaliq
LinkedIn: https://www.linkedin.com/in/abdul-khaliq-alpha-at-mak-alpha/ ZVENIA Mining .24/07/2023
They are highly confused, often misunderstood and mostly underutilized.
Here’s what they are and how to use them:1️⃣ Operating cash flow
⚫ Represents the net cash generated by your company’s core operations
⚫ Calculated by adjusting Net Income for non-cash items & changes in net working capital assets.
⚫ Used to assess:
>> financial health
>> ability to meet its financial obligations
>> ability to generate sufficient cash to fund ongoing business operations
>> cash generation trends2️⃣ Investing cash flow
⚫ Represents the net cash generated by your company’s investments in long-term assets such as property, plant and equipment (PPE).
⚫ Calculated by totaling the net investments in PPE over the period (purchases less sales of PPE)
⚫ Used to assess:
>> investment decisions
>> ability to generate returns from its investments3️⃣ Financing cash flow
⚫ Represents the cash generated by your company’s net debt and/or equity activity.
⚫ Calculated by totaling net debt and equity proceeds over the period.
⚫ Used to assess:
>> financing choices and risk profile
>> ability to raise capital4️⃣ Free Cash Flow to Firm (FCFF or Unlevered Cash Flow)
⚫ Represents the cash remaining in your business after accounting for cash outflows that support product sales and operations (product costs + operating expenses + working capital) and cash outflows that maintain the capital asset base (capital expenditures).
⚫ Calculated by adjusting Operating Cash Flow for after tax interest expense and investments in capital assets
⚫ Used to assess:
>> financial strength and ability to generate sufficient cash for growth and reinvestment
>> value based on the discounted cash flow (DCF) valuation.5️⃣ Free Cash Flow to Equity (FCFE or Levered Cash Flow)
⚫ Represents the cash remaining in your business after accounting for all business expenses, investments in working capital assets, investments in fixed assets, and also all debt obligations.
⚫ Calculated by adjusting Operating Cash Flow for after tax, interest expense, investments in capital assets and net debt payments.
⚫ Used to assess:
>> ability to generate cash for distributions to shareholders holdersSource: Oana Labes, MBA, CPA – LinkedIn
 ZVENIA Mining .23/07/2023
Financial planning and analysis (FP&A) is a set of planning, forecasting, budgeting, and analytical activities that support a company’s major business decisions and overall financial health.
10 Scenario Analysis Frameworks
You work in FP&A ?
Here is an extract from a course I gave recently.
One of the questions from the students was:
“What are the different methods for scenario analysis”Here are 10 different methods, with instructions and an illustrative example.
1. “What if” analysis
Identify a set of variables that might impact your business, such as raw material, price, shipping costs, or regional demand.
For example: “What if limestone prices rise by 10%?”2. Sensitivity
Analyze how changes in a single input would impact a certain output, such as profits.
For instance: examine how a +/- 5% change in energy costs would affect your profits.3. Probabilistic
Assign probabilities to different scenarios based on historical data or industry insights.
Example: There might be a 20% chance of a severe supply chain disruption.4. Stress testing
Identify extreme scenarios that might put your company under strain, Evaluate how your company would withstand these scenarios.
Example: a massive drop in demand or a significant disruption in raw material supply.5. Monte Carlo
Use a computer program to simulate a range of outcomes of different scenarios and calculate probabilities for each.
This could help you understand potential fluctuations in profits, costs, or revenues.6. Brainstorming
Bring together key stakeholders to generate a wide range of possible future scenarios.
Examples: consider potential political, economic, or industry changes.
Create narratives for different scenarios to help stakeholders visualize potential futures.7. Clustering
Group similar scenarios together to simplify your analysis.
For example, you might have one cluster of scenarios for Raw material and another for Labor costs8. Matrix
Create a matrix with two key uncertainties as the axes. Then fill in the quadrants with scenarios based on these uncertainties.
For instance, one axis could be “Energy price volatility” and the other “Regulatory changes”.9. Storytelling
For example, tell a story on how your company would fare under a scenario of rapid economic growth or a severe recession.10. Simulation
Use sophisticated software to simulate how your company would perform under different scenarios.Source : Nicolas Boucher, LinkedIn
www.nicolasboucher.onlineZVENIA Mining .23/07/2023MINING.COM’s ranking of world’s biggest miners welcomes the first Indonesian company to the top tier and Perth as the city hosting the greatest number on the list at the end of the second quarter 2023
At the end of the first quarter of 2022 metals and minerals were setting all-time records led by bellwether copper which briefly traded above $5 a pound or more than $11,000 per tonne. Iron ore, the second most traded bulk commodity after crude oil and the cash cow for the top tier of the mining world, was above $150 a tonne.
Both commodities are down by more than 20% since then – officially a bear market.
At the end of Q1 2022, the MINING.COM TOP 50* ranking of the world’s biggest miners hit an all time record of a collective $1.75 trillion.
Half way through 2023 and mining valuations have slumped a total of $356 billion after giving up a collective $47 billion during the second quarter.
The Top 50 now has a combined market value of $1.38 trillion – back to levels seen end-June 2021.
Indonesian debut
The first Indonesian company to make it into the top 50 is Amman Minerals Internasional, owner and operator of the Batu Hijau copper and gold mine and developer of the adjacent Elang project.Elang is one of the world’s largest undeveloped copper and gold porphyry deposits and is currently in the feasibility stage.
Indonesia has become a red-hot IPO market this year and Amman was the largest of the year so far.
The company debuted in Jakarta on July 7, raising more than $700m, and enters the ranking at no 46 with a valuation just shy of $9 billion or 135 trillion rupiah, up smartly since the IPO.
Harita Nickel, which listed in Jakarta in April raising $672m, has had a tough go of it and the stock has shed more than 30% since then as nickel prices decline at a similar rate.
In USD terms Harita Nickel is worth less than $4 billion which places the stock outside the 70 most valuable mining stocks globally.
Lithium ranks grow
Lithium producer Pilbara Minerals makes a spectacular entry into the Top 50 at position no 42 after spending several quarters bubbling under the ranking.Pilbara Minerals shares are up over 40% so far this year, lifting its value to over $10 billion, surpassing that of fellow lithium miner and Perth neighbour, Mineral Resources.
Pilbara Minerals, which is the ranking’s best performer for the quarter, brings the number of companies based in the Wes…
Source : https://www.mining.com/top-50-biggest-mining-companies/
- Item 2
17 Finances and markets
Add Z-NOTEZ-NOTES is a private space. The content written here will be visible only to you.
- Item 2
17 Finances and markets
Add Z-EVENTZ-EVENTS is a public space. Events posted here will be visible to the ZVENIA community.
- Item 2
17 Finances and markets
In this module you will have access to the following topics (not exhaustive) :
– “Royalties”
– Cash flow
– EBITA
– Speculation
– Price volatility
– Taxes
– Depreciation
– Inflation
– Export
– Exchange rate
– “Discount rate”
– Working capital


